
Abstract
Background
Exposure to asbestos is associated with malignant and nonmalignant respiratory disease. To strengthen the scientific basis for risk assessment on fibers, the National Institute of Environmental Health Sciences (NIEHS) has initiated a series of studies to address fundamental questions on the toxicology of naturally occurring asbestos and related mineral fibers after inhalation exposure. A prototype nose-only exposure system was previously developed and validated. The prototype system was expanded to a large-scale exposure system in this study for conducting subsequent in vivo rodent inhalation studies of Libby amphibole (LA) 2007, selected as a model fiber.
Results
The exposure system consisting of six exposure carousels was able to independently deliver stable LA 2007 aerosol to individual carousels at target concentrations of 0 (control group), 0.1, 0.3, 1, 3, or 10 mg/m3. A single aerosol generator was used to provide aerosol to all carousels to ensure that exposure atmospheres were chemically and physically similar, with aerosol concentration as the only major variable among the carousels. Transmission electron microscopy (TEM) coupled with energy dispersive spectrometry (EDS) and selected area electron diffraction (SAED) analysis of aerosol samples collected at the exposure ports indicated the fiber dimensions, chemical composition, and mineralogy were equivalent across exposure carousels and were comparable to the bulk LA 2007 material.
Conclusion
The exposure system developed is ready for use in conducting nose-only inhalation toxicity studies of LA 2007 in rats. The exposure system is anticipated to have applicability for the inhalation toxicity evaluation of other natural mineral fibers of concern.
Background
Asbestos is a group of minerals that occur naturally in the environment and is composed of soft and flexible fibers resistant to heat, electricity, and corrosion. Asbestos has been classified as a human carcinogen causing mesothelioma and cancers of the lung, larynx, and ovary (Mossman and Gee Citation1989; Noonan Citation2017; Solbes and Harper Citation2018). Asbestos exposure may also increase the risk of asbestosis associated with inflammation and scarring in the lung and pleural lesions, leading to an impaired respiratory function (Mossman and Gee Citation1989; Noonan Citation2017; Solbes and Harper Citation2018). The National Institute of Environmental Health Sciences (NIEHS) has recently initiated a series of studies to address fundamental questions on the toxicology of naturally occurring asbestos and related mineral fibers after inhalation exposure (National Toxicology Program Citation2007). Specifically, Libby amphibole (LA) asbestos 2007 (referred to as LA 2007, bulk materials) (Lowers et al. Citation2012), a test material representing the air from the vermiculite mine near Libby, Montana (MT) was selected as a model fiber, with the generation of in vivo data complementing robust chemical/physical characterization and human exposure/health effect data sets (McDonald et al. Citation1986; Agency for Toxic Substances and Disease Registry Citation2003; Benson et al. Citation2015; Szeinuk et al. Citation2017; Pfau et al. Citation2019; Dodson et al. Citation2020). In addition, in vivo fiber studies in general will address fundamental questions, particularly around exposure–response, that will advance the understanding of fiber toxicology and risk assessment. In particular, inhalation fiber toxicity is believed to be related to cumulative dose, which in turn is associated with both the magnitude of exposure and the biopersistence of the fiber (Environmental Protection Agency (EPA) Citation2014). With respect to biopersistence, previous studies reported fiber dimension was one of the most important determinants of pathogenicity and cancer development (Davis et al. Citation1986; McConnell et al. Citation1999; Oberdorster Citation2000; Boulanger et al. Citation2014). Besides dose and biopersistance, mineral fiber chemical composition could also be a key determinant of fiber toxicity (McConnell et al. Citation1999).
While recognizing that asbestos is an established human carcinogen, further animal studies are anticipated to provide better understanding of toxic and carcinogenic risk. To date, several inhalation approaches are available for exposing animals, including whole-body, head-only, and nose-only systems (Wong Citation2007). Acknowledging the advantages of the in vivo nose-only exposure system (e.g. reduce amount of test materials needed and target respiratory exposure with controllable exposure concentrations), various directed-flow, nose-only exposure models have been established for more efficient and targeted exposure in inhalation toxicity studies (Pauluhn Citation1994; Stone et al. Citation2012; Mainelis et al. Citation2013; Gavett et al. Citation2016; Lucci et al. Citation2020; Hu et al. Citation2021). These exposure systems appear to share similar characteristics but vary in system operation, configuration, and design, resulting in differences in aerosol generation and delivery. It is worth noting that exposure systems typically either contain a single exposure carousel with 5–96 ports connected with an aerosol generation system, or multiple carousels each with an individual generation system. For a study design that requires a separate aerosol generator for each carousel, there are a few advantages such as ability to independently control concentration in each carousel, which facilitates achievement of a wide concentration range among the exposure groups. However, such a study design will not only require operation and maintenance of multiple aerosol generators (leading to inefficiencies) but also may result in different aerosol properties among exposure carousels (e.g. fiber length, width, etc.), depending upon operation settings of the aerosol generator (e.g. pressure, flow, etc.), potentially confounding determination of exposure–response relationships. An alternative design features a single generator that supplies aerosol to all exposure carousels. The resulting aerosol may go through a distribution system in which a desired amount of aerosol flow is directed toward each exposure carousel with some excess flow (for better control of exposure concentrations) directed from the end of the distribution system to the exhaust system. Meanwhile, the high aspect ratio of asbestos fibers adds complexity as aerosol flow is directed from the distribution system to smaller diameter delivery tubing attached to the inlets of exposure carousels. With such a design, the operation and maintenance of the exposure system is complex and specialized training is needed to ensure proper system operation. Despite the complexity of the exposure system, this design offers the significant advantage of isolating aerosol concentration as the only major variable among exposure groups, with no significant difference in aerosol properties among the groups. Delivery of consistent aerosols across exposure groups allows for robust exposure–response characterization.
With this background in mind, prior to establishing a multi-carousel system for exposure to naturally occurring asbestos, as the phase 1 of the NIEHS study, a prototype generation system was developed and its delivery of aerosol to a single nose-only carousel (with 24 ports) was characterized to explore the feasibility of generating natural mineral fiber aerosol for in vivo inhalation toxicity studies (Wang et al. Citation2023). The average aerosol concentrations were within 20% of target concentration during a three-hour generation test on the prototype generation system using LA 2007. These findings were consistent in both a single exposure and over a five-day testing period. Further characterization testing verified that the aerosol generation and delivery systems were able to deliver stable LA 2007 to the exposure carousel with fiber aerosols that were chemically and physically equivalent to the bulk test material. Importantly, the determined fiber dimensions, including length, width, and aspect ratio (i.e. the ratio of a fiber length to its width) of aerosol samples were consistent over the five days (Wang et al. Citation2023).
Based on the experience of developing the prototype, an exposure system consisting of a single generator, appropriate distribution system, and six 96-port exposure carousels was fabricated and optimized, to accommodate five target exposure concentrations to the test material, plus a control group. Notably, a wide separation between the high and low concentrations (100-fold) was achieved. A series of characterization tests using LA 2007 as test material at 0 (control group, exposed to HEPA filtered air), 0.1, 0.3, 1, 3, or 10 mg/m3 are presented herein. The exposure system has been optimized for examining the short- and long-term health effects of LA 2007 following nose-only exposure with the goal for NIEHS to further develop the scientific basis for risk assessment on fiber toxicity. In addition, this system is anticipated to have applicability for the evaluation of inhalation exposure to other natural mineral fibers of concern present in the environment at a larger scale capability as well.
Methods
Test material
The test material is LA 2007, which was collected and processed such that the chemical and physical characteristics are similar to those encountered in Libby, MT where human exposures are associated with adverse health effects (Lowers et al. Citation2012). A large sample (∼10 kg) of bulk LA 2007 test material was provided to NIEHS from the US EPA for use in the research program (Wang et al. Citation2023). The bulk LA 2007 test material was further characterized, and the results are presented in Supplementary File 1 of this article.
Aerosol generation and exposure system
A nose-only rodent exposure system was designed and fabricated for repeat inhalation exposure studies of asbestos-like fibers. The exposure system consisted of six exposure carousels capable of producing aerosol of LA 2007 at target concentrations of 0 (control group, exposed to HEPA filtered air), 0.1, 0.3, 1, 3, or 10 mg/m3. The exposure carousels and the aerosol generation system were setup in a dedicated inhalation exposure suite as illustrated in . The schematic of the inhalation exposure system is presented in . The aerosol generator was housed within a sealed glove box. The control carousel was segregated from the exposure carousels using a curtain, with air pressure in the curtained area maintained at positive pressure with respect to the area outside the curtain. The positive pressure ensured the room air flow was directed away from the curtained area (with control carousel) to other parts of the exposure room, thus avoiding possible contamination of the air space around the control carousel.
Figure 1. Exposure suite layout.
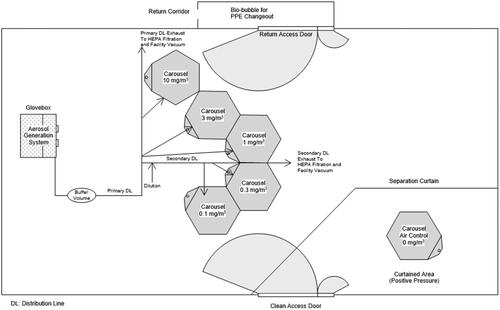
Figure 2. Schematic diagram of the aerosol exposure system.

The nose-only inhalation exposure carousel was developed by Battelle (Cannon et al. Citation1983, Citation1988). Each exposure carousel consisted of six-tier modular sections with 16 nose-only inhalation ports radially arranged per tier, providing a total of 96 ports for animal exposure and/or test atmosphere sampling. Test article aerosol was introduced into each exposure carousel through the top of the central plenum within the carousel, then flowed radially out to each of the 96 evenly spaced exposure ports where rodents restrained in exposure tubes would have access to inhale the aerosol.
In subsequent in vivo studies, rodents are individually restrained in specially designed polycarbonate rodent restraint tubes, such that the ability to turn in the tube is minimized. The exposure carousel and rodent restraint tube design permits rodents to breathe fresh test article aerosol within the exposure carousel while minimizing other routes of exposure to the target aerosol. Further, the design minimizes any effect animals may have on the exposure atmosphere as the exhaled air from each rodent is directed toward the exhaust and does not get re-entrained with the fresh test article being delivered to other rodents.
A slide bar aerosol generator used in the prototype study (Wang et al. Citation2023) was used to produce LA 2007 aerosol. Aerosol was delivered from the generator through a primary distribution line constructed of stainless steel, which was grounded to prevent the buildup of electrostatic charge. The distribution line contained a stainless-steel buffer chamber to dissipate the pressure wave created by the cyclic generation of the aerosol by the slide bar generator.
Aerosol was delivered from the primary distribution line to each exposure carousel using custom-made ejector pumps (Wang et al. Citation2023), which controlled the aerosol feed rates. Humidified air was added to the aerosol-laden air stream downstream of the ejector pump to bring the air stream to the study target concentrations and target relative humidity (RH) of 55 ± 15% for animal nose-only inhalation. The humidified air was generated by custom-made bubbler humidifiers with an individual humidifier installed for each exposure carousel. The output RH of a humidifier was controlled by adjusting the temperature of the humidifier water reservoir. As shown in (the light grey shaded area) for the 1 mg/m3 carousel, due to its relative lower target concentration compared to the 3 and 10 mg/m3 carousels, aerosol concentration was also controlled by siphoning the excess aerosol flow from a location downstream of the ejector pump, followed by the introduction of additional dilution air.
To achieve the target aerosol concentration for the 0.1 and 0.3 mg/m3 carousels, a secondary distribution line was installed in the distribution system. The air stream was metered from the primary distribution line into the secondary distribution line using an ejector pump. The air stream was then diluted in the secondary distribution line using the siphon/dilution flow adjustment. The diluted air flow was delivered from the secondary distribution line into the 0.1 and 0.3 mg/m3 carousels using ejector pumps followed by further dilution to achieve the target concentrations and target RH of 55 ± 15%. The flow rate and configuration of the ejector pumps were chosen to optimize delivery efficiency.
Temperature for the exposure suite was controlled by the facility heating, ventilation, and air conditioning (HVAC) system. Temperature of the exposure carousels was controlled by water heating/cooling radiators individually installed in each exposure cabinet. Air flow through the carousel was controlled using flow meters. The testing facility compressed air and vacuum were both used to maintain the target flow of 48 L/minute through each carousel.
Intake air to the exposure carousels was HEPA filtered. The quality of the air delivered to the exposure carousels was analyzed before the start of exposure tests to demonstrate the delivered air met Grade E Standards as defined by the Compressed Gas Association (CGA) Commodity Specification G7.1 (Compressed Gas Association (CGA) Citation2018).
The LA 2007 aerosol concentration in each exposure carousel was measured using a MicroDust Pro real-time aerosol monitor (RAM) (Casella CEL Ltd, Bedford, UK), with a dedicated RAM for each exposure carousel. The concentrations were controlled manually by adjusting the ejector pump delivering rate, changing the dilution/siphon flows, or adjusting the aerosol generator generating rate if all exposure carousels have lower (or higher) concentrations than the targets.
The RAMs were calibrated by correlating the RAM response (voltage) with gravimetrically determined aerosol mass concentrations (mg/m3) from aerosol collected on filters. For 1, 3, and 10 mg/m3 carousels, filter samples were collected at the nose port with flow rate around 0.5 L/minute. For 0.1 and 0.3 mg/m3 carousels, due to the low concentrations, to collect enough mass of the test aerosol for gravimetrical analysis, filter samples were collected from a sampling location at the inlet of carousel, at higher flow rate of approximately 5 L/minute. Sampling flow rates were verified daily for each sampling line using a calibrated flow meter to ensure accuracy of the filter samples. The sampling duration varied from 60 to 180 min depending on the target aerosol concentrations. The filter media were weighed prior to and after sampling using a six-digit calibrated microbalance, and the net gain of the filter mass was divided by the total volume of sampled air to determine the aerosol mass concentration.
The RAM calibration was verified on each test day by collecting at least one set of duplicate filter samples from each exposure carousel. Concentrations determined gravimetrically were compared to the mean concentrations determined by the RAM during the time period of the filter sample collection. The RAM calibration curves were updated if the concentration measured by RAM varied by more than 20% of the concentration measured gravimetrically.
Aerosol particle size distribution was determined using seven-stage Mercer cascade impactors (In-Tox Products, Clinton, MS, model J/1). The impactor samples were collected at the inlet of the exposure carousels at sampling flow rate of approximately 5 L/minute. The impactors had effective cutoff diameter ranged of approximately 0.5–10.6 µm at the flow rate of use. The mass collected on each stage was determined gravimetrically and the resulting data were analyzed via a Battelle developed Microsoft Excel-based program, which used probit analysis to calculate the mass median aerodynamic diameter (MMAD) (Hinds Citation1999) and geometric standard deviation (GSD) (Hinds Citation1999). MMAD and GSD describe aerosol particle-size distribution based on mass and aerodynamic diameter (Hinds Citation1999) of particles and are related to the deposition of inhaled particles. For the 96-port carousel, the operating range for the carousel inlet air flow was targeted at 48 ± 2 L/minute to ensure each individual port has a volumetric flow rate of approximately 500 mL/minute. The carousel inlet flow was measured using a pressure-based flow meter designed and fabricated by Battelle. The flow meter consisted of a section of Teflon tubing, and the pressure drop across the tubing was measured by a pressure transducer to provide the flow rate. The length and internal diameter of the Teflon tubing were specified based on flow rate and the response range of the pressure transducer. The flow meter was calibrated to establish the flow versus pressure drop relationship. The calibration was checked periodically, and the flow meter was cleaned and re-calibrated when necessary. The exposure port temperature was targeted at 72 ± 3 °F and the exposure port RH was targeted at 55 ± 15%. Temperature and RH at the exposure ports were measured using calibrated Vaisala temperature and RH probes (Vaisala, model HMP 60. Helsinki, Finland).
The six exposure carousels were interfaced with the Battelle Exposure Data Acquisition and Control (BEDAC) system. The aerosol concentration, exposure port temperature, exposure port RH, and air flow through the exposure carousels were automatically recorded by the BEDAC systems, which also controlled the timing of exposures.
A series of engineering controls was included in the exposure system design for laboratory health and safety. The primary engineering control was to use local exhaust ventilation systems. A glovebox was used to contain the aerosol generation system, which was maintained at negative pressure to prevent potential release of LA 2007 fibers from the glovebox. The pressure in the glovebox was monitored and the aerosol generator would be automatically shut down (with audible alarm) in case of a glovebox leak.
Each exposure carousel was surrounded by a ventilated exposure cabinet mounted on a stainless-steel stand. The exposure cabinet was maintained at a slightly negative pressure to the exposure room to minimize the release of test article from the carousel into the exposure room. Each exposure cabinet was ventilated at a target flow rate of approximately 600 L/minute for the 0.1, 0.3, 1, 3, and 10 mg/m3 carousels and a target flow rate of approximately 550 L/minute for the control carousel.
The distribution and delivery lines that connect the aerosol generator and exposure carousels were leak checked at the beginning of the study before starting any LA 2007 aerosol generation. The exhaust from each carousel was HEPA-filtered to remove residual test aerosol prior to entering the testing facility’s exhaust system. The filtration efficiency for the test system exhaust air was evaluated before the start of exposure tests and was measured as greater than 99.98%. The exposure room had high air changes of approximately 12–13 times per hour to minimize LA 2007 aerosol concentration in the exposure room. The exposure room pressure was slightly negative to surrounding to ensure potential LA 2007 fibers were contained in the exposure room.
The study used the OSHA asbestos permissible exposure limit (PEL) of 0.1 fibers/cm3 (Occupational Safety and Health Administration Citation1994) for LA 2007, and with an action level of 50% of the threshold limit value (TLV). Both personal breathing zone and exposure room samples were collected during exposure tests, and no sample exceeded the action level with the engineering controls in place. The engineering controls described combined with administrative controls and appropriate personal protective equipment (PPE) were essential to maintain laboratory health and safety when conducting the LA 2007 exposure tests.
However, due to the large scale and complicity of the exposure system, operators in PPE need to stay in the exposure room during entire exposure test to generate aerosol, and adjust concentration and environmental conditions (temperature, and RH, and flows). The system may be further improved in future studies by building in automatic control systems for concentration and environmental conditions to minimize the time of operators in the exposure room.
Asbestos fiber analysis methods
Asbestos fiber analysis, including fiber size distributions, chemical composition, and asbestos fiber identification, of aerosol samples and bulk test material samples were determined using transmission electron microscopy (TEM) combined with selected area electron diffraction (SAED) and energy dispersive spectrometry (EDS) analysis as described previously (Wang et al. Citation2023). Full characterizations of the bulk LA 2007 test material have been performed to evaluate composition, identification, and purity. The results are presented in Supplementary File 1.
Briefly, for TEM analysis, triplicate aerosol samples were collected from exposure ports of each exposure carousel using EMSL Zefon TEM Asbestos Cassettes (EMSL Analytical, Inc., Cinnaminson, NJ). For direct comparison, additional bulk test material samples were collected from the bulk material containers on the exposure days and analyzed together with the aerosol samples. The samples were analyzed for TEM with SAED and EDS analysis at EMSL Analytical Inc. (Cinnaminson, NJ).
Aerosol and bulk test material samples were analyzed using either a JEOL 1200 EX II or a JEOL 1010 (Akishima, Japan) scanning transmission electron microscope equipped with an energy dispersive X-ray analyzer (PGT and IXRF, respectively) and side mount digital camera at approximately 20,000X magnification. Structures were identified by examining both morphology and elemental chemistry via EDS and SAED. All structures greater than 0.5 µm in length with an aspect ratio of at least 3:1 were counted and recorded following the ISO 10312 method’s counting rules (International Organization for Standardization (ISO) Citation1995). For each sample, approximately 300 fibrous structures were analyzed following the NIOSH counting rules (i.e. 300 fibers/sample with aspect ratios ≥3) (National Institute for Occupational Safety & Health (NIOSH) Citation1994).
Determination of the chemical composition of the collected fibers was performed using EDS. For each set of triplicate aerosol samples, one sample was analyzed quantitatively via 300 individual EDS scans to assess chemical composition and mineral type. The bulk material sample was also analyzed quantitatively via 300 individual EDS scans for assessment of chemical composition and mineral type. The system (microscope/EDS detector) generated Cliff–Lorimer factors which were used to calculate the chemical composition within the PGT Spirit software.
In addition, for every aerosol sample and the bulk material sample, 20 representative SAED images were used to qualitatively confirm structure crystallinity.
Results
Aerosol generation tests were conducted using the LA 2007 test material over three consecutive days for three hours per day to characterize the six-carousel nose-only exposure system. The test time of three hour per day was the anticipated exposure duration for the subsequent in vivo rodent study.
Aerosol concentrations
Exposure carousel aerosol concentrations measured during the three-day generation tests are summarized in . Target concentrations were achieved for all exposure carousels with daily mean concentrations within 20% of target except for one data point. Concentrations overall were stable, with relative standard deviation (RSD measured by RAM) within 30% for most tests. The high RSDs (>30%) observed on day 1 was due to concentration adjustment, and the variability was improved on day 2 as the operators gained experience with the test system.
Table 1. Aerosol concentration in the three-day generation tests.
Aerosol mass median aerodynamic diameters
The MMAD of the asbestos aerosol was measured at the inlet of the carousels 1, 3, and 10 mg/m3, and the results are presented in . The measured aerosol MMAD ranged from 2.5 to 2.6 µm with GSD ranged from 2.7 to 2.9, which were within the respirable size range for rodents (i.e. MMAD ≤ 3.0 µm and GSD ≤ 3.0). Cascade impactor samples were not collected for carousels 0.1 and 0.3 mg/m3 due to the low concentrations that would need prolong sampling duration.
Table 2. Average aerosol mass median aerodynamic diameters.
Environmental and flow conditions
Temperature, RH, and airflow data recorded by BEDAC during the testing period are presented in Supplementary File 2. The mean exposure port temperature and RH were within the target ranges of 72 ± 3 °F for temperature and 55 ± 15% for RH on all test days. The daily mean carousel inlet flow was also within the target range (48 ± 2 L/minute) for all carousels.
Exposure carousel flow uniformity
The air flow uniformity between the ports and tiers of each exposure carousel was evaluated by measuring air velocity through all 96 exposure ports of each exposure carousel at a target inlet flow rate of 48 L/minute using an air velocity meter (Kurz Instruments, Inc., Monterey, CA). The output of the meter (meter/minute) was used to calculate total port variability (TPV) of the air flow through the exposure port. The measured TPVs (data not shown) were ≤5% for all six exposure carousels, which is considered acceptable for satisfactory spatial uniformity.
TEM with EDS and SAED analysis
Fiber size distributions
A summary of the fiber size distribution determined by TEM analysis of the aerosol samples and the bulk test material is presented in . The average fiber lengths and widths measured at the exposure ports (sample-to-sample averages ranged from 4.42 to 4.88 µm for fiber length and 0.35 to 0.40 µm for fiber width) and were comparable to the bulk material sample (4.55 µm and 0.29 µm, respectively) collected along with exposure aerosol samples. The aspect ratio for each set of aerosol samples was approximately 15, which is similar to the result of the bulk sample considering the overlapped distributions in aspect ratios for the aerosol and bulk samples (as indicated by the standard deviations). Fiber size distributions are represented in via the range of minimum and maximus values measured in each set of samples.
Table 3. Fiber dimensions characterization by TEM analysis.
The fiber length, width, and aspect ratios presented in have high standard deviations and wide ranges for both aerosol samples and bulk LA 2007 sample, which are due to the natural variability in bulk LA 2007 test material. There is inherent variability in the composition and size of amphiboles, as it is a mixture of different minerals formed by geological processes. While measures were taken to ensure that the bulk LA 2007 test material is homogeneous (first by mixing when collected and processed the material (Lowers et al. Citation2012), and subsequently by mixing the material prior to taking aliquots for use and analysis in this work), the characterization results of bulk LA 2007 samples suggest that the inherent variability in LA 2007 still exists.
A summary of fiber size distributions analysis on bulk LA 2007 conducted throughout this study and reported in the USGS study (Lowers et al. Citation2012) is presented in . As shown in , the average fiber size measured in each analysis ranged from 3.98 to 5.76 µm in fiber length and 0.24 to 0.33 µm in fiber width. The average fiber size reported by USGS (4.99 µm in length and 0.28 µm in width) was within the ranges measured in this study. The variation in average fiber length/width obtained between each analysis and the large standard deviation within each analysis (as shown in ) demonstrate the degree of variability in LA 2007 fiber dimensions (i.e. length, width, and aspect ratio), and the observation is consistent with the data reported by USGS study (Lowers et al. Citation2012).
Table 4. A summary of bulk LA 2007 fiber dimensions analysis by TEM.
Representative fiber length distribution graphs of one aerosol sample and bulk material are presented in . Representative fiber width distribution graphs of one aerosol sample and bulk material are presented in . Representative TEM images are shown in for aerosol sample and in for the bulk material.
Figure 3. Representative fiber length distributions. (Top plot: one example of aerosol sample (1 mg/m3). Bottom plot: one example of bulk LA 2007 test material.)

Figure 4. Representative fiber width distributions. (Top plot: one example of aerosol sample (1 mg/m3). Bottom plot: one example of LA 2007 bulk material.)
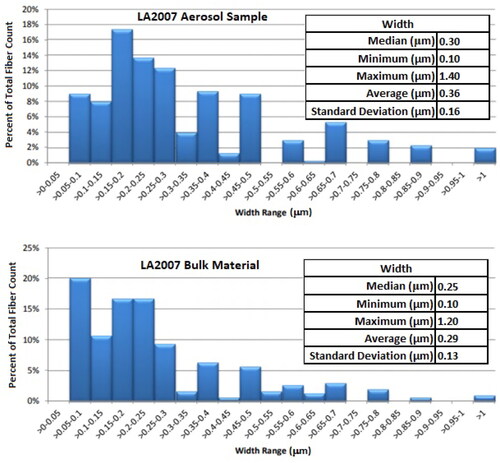
Figure 5. Representative TEM images of LA 2007 fibers aerosol samples. (Scale bar is 800 nm.)
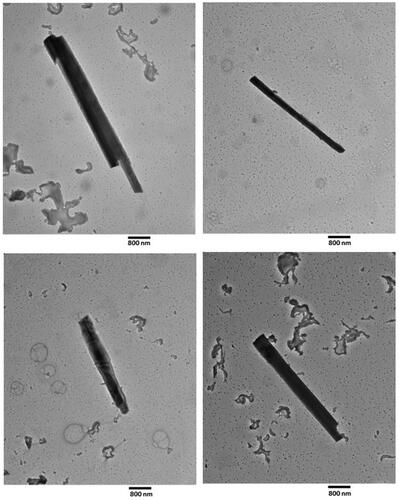
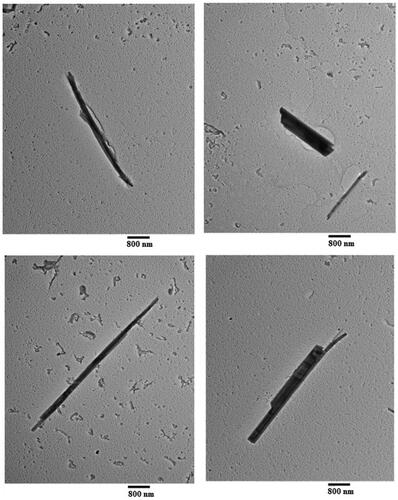
Figure 6. Representative TEM images of fibers of LA 2007 bulk material. (Scale bar is 800 nm.)
The TEM analysis indicated fiber lengths, widths, aspect ratios, and imaging of the aerosol samples were consistent with the characterization of the bulk test material. The aerosol fiber dimensions were also consistent among the exposure carousels. The results indicated the fiber dimensions of the aerosolized material were not altered during generation and transport processes through the exposure system.
Aerosol fiber identification and chemical composition
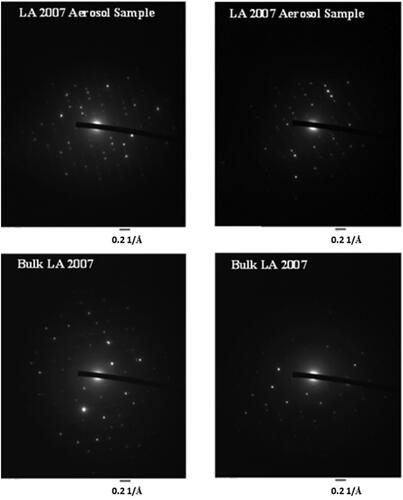
SAED provides a diffraction pattern for crystalline particles that is helpful in distinguishing organic from mineral fibers and classifying the nature of the crystalline structure (serpentine, amphibole, pyroxene, etc.). SAED patterns presented by amphibole fibers are uniform rows of closely spaced spots with patterns that are influenced by the orientation of the fiber to the direction of the electron beam (Millette Citation1987). The presence of concise spots conveys the crystallinity of the fiber. Upon measurement, sets of zone-axis patterns of spots are used to describe types of amphiboles in conjunction with chemical composition measured by EDS (Millette Citation1987; Meeker et al. Citation2003). Analysis of the electron diffraction patterns for aerosol sampled at the exposure port and the bulk LA 2007 test material indicated the fiber material was highly crystalline and consistent with the standards of amphibole asbestos from the LA, MT region (Meeker et al. Citation2003). The representative SAED images for the aerosol samples and the bulk LA 2007 test material are shown in .
Figure 7. Representative SAED images. (Top two scans were from aerosol samples. Bottom two scans were from bulk LA 2007 test material. Scale bar is 0.2 1/Å for all scans.)
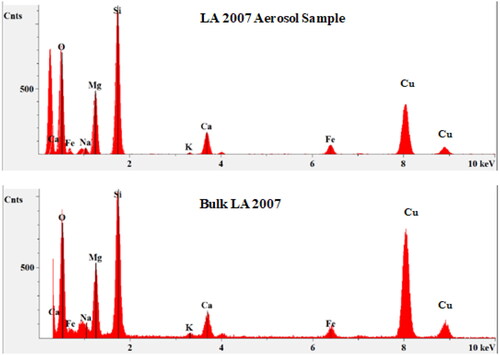
The elemental oxide content of the fibers determined by EDS are summarized in . also presents the elemental oxide content of the bulk LA 2007 test material determined using electron probe microanalysis (EPMA) and reported by the USGS report (Lowers et al. Citation2012). The composition of the determined element oxides from the aerosol presented herein is comparable to both the bulk sample and the results from the USGS report (Lowers et al. Citation2012). Representative EDS spectra for the aerosol sampled at the exposure port and bulk LA 2007 test material are shown in . The peaks at approximately 8 and 9 keV in are copper peaks, which are the background peaks that exist in all the EDS spectra of asbestos material prepared on copper TEM grids.
Figure 8. Representative EDS spectra. (Top spectra were from an aerosol sample. Bottom spectra were from bulk LA 2007 test material.)
The mineralogical characterization of the bulk test material and the aerosol sampled at the exposure port was determined using semiquantitative EDS via analysis of 300 individual fibers. This semi-quantitative EDS analysis was used to determine mineral species per International Mineralogical Association (IMA) 1997 classifications (Leake et al. Citation1997). The formula and determination of the mineral species was done with the spreadsheet ProbeAmph (Tindle and Webb Citation1994), which follows the recommendations of the IMA 1997 (Leake et al. 1997; Hawthorne et al. Citation2012). The results are presented in . Representative mineral composition scatter plots for bulk LA 2007 and LA 2007 aerosol are presented in . All fibers from the bulk LA 2007 test material and the aerosol samples were identified as LA. The mineral types identified in this analysis included winchite, richterite, and tremolite as the three predominate minerals. The findings were also consistent with those reported by Meeker et al. (Citation2003) on the composition and morphology of the amphiboles from Libby, MT. The composition scatter plots in show mineral composition similarity in bulk LA 2007 and LA aerosol samples with predominate mineral present were winchite, richterite, and tremolite, which are also consistent with the mineral composition plot reported by the USGS for the LA. As shown in , winchite was the major component in both bulk and exposure air samples, and winchite and tremolite were slightly higher in exposure air samples than in bulk material while richterite was lower in exposure air samples.
Figure 9. Representative mineral composition plots for LA 2007 analyzed using EDS. (Top: representative plot for LA 2007 aerosol sample. Bottom: representative plot for bulk LA 2007.)
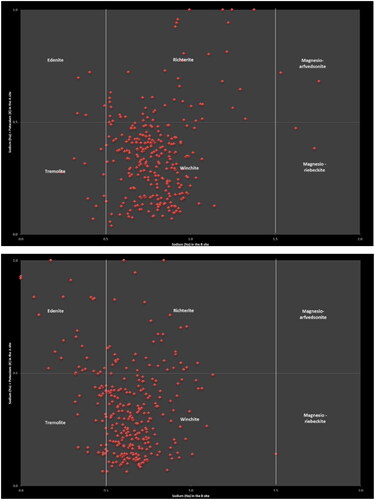
Table 5. Element oxide content of aerosol samples and bulk LA 2007 test material.
Discussion
Exposure to LA 2007 is of high relevance to humans, both in and around the Libby, MT area and nationally, due to its uses as a soil conditioner and insulator. In addition, there are robust data sets available on chemical/physical properties and human exposure/health effects of this mixture of fibers. To complete this data set and address significant questions on fiber toxicity, particularly those related to exposure–response relationships, LA 2007 was selected by NIEHS as a model sample for studying short- and long-term inhalation toxicological effects of natural mineral fibers in rodents. Enough of the test material was prepared such that the chemical and physical characteristics are similar to air samples taken from Libby, MT during the same time period (Lowers et al. Citation2012). As such, it is critical that the chemical/physical properties of the exposure aerosol, including the fiber dimension, chemical composition, and mineralogy, are highly similar to those of the bulk LA 2007 sample.
Several previous studies have investigated the inhalation toxicity of a range of asbestos materials in rodents (Davis et al. Citation1978, Citation1986; McConnell et al. Citation1999; Gavett et al. Citation2016), including the report on LA 2007 from EPA (Gavett et al. Citation2016). The EPA study demonstrated that inhalation of LA fibers generated from the bulk LA 2007 caused inflammatory, fibrogenic, and tumorigenic responses in rats recapitulating asbestos-related disease in exposed humans (Gavett et al. Citation2016). In the EPA study (Gavett et al. Citation2016), rats were exposed to LA 2007 in three exposure groups each with individual nose-only exposure systems and individual aerosol generation systems. Fiber size distributions were determined by collecting aerosol samples from exposure carousels and analysis by scanning electron microscope (SEM) to count the number of structures with dimension ≥0.2 µm. It is worth noting that different technologies (SEM vs. TEM) and fiber counting rules were used to determine fiber size distribution in the EPA study and this present study.
The EPA study was the first to generate exposure–response data on LA 2007 in rodents and served as a model study for examining exposure–response of amphibole fibers in rats. The design of the current NIEHS toxicity study was informed by the methods and results of the EPA study, with a few notable deviations, e.g. inclusion of lower exposure concentrations with a wider concentration range, to extend the ability to characterize exposure–response. These features rendered the design and execution of the exposure system particularly challenging. To isolate aerosol concentration as the only variable among exposure groups, the present study explored and confirmed the feasibility of using a single aerosol generator (vs. separate generators for each group) to provide consistent LA 2007 aerosol to five exposure carousels, with a low concentration of 0.1 mg/m3 and a concentration range of 100-fold. Despite the technical challenges associated with this design, the characterization results demonstrated stable and controllable aerosol concentrations in the exposure carousels. Most importantly the aerosol fiber dimensions, chemical composition, and mineralogy were consistent across exposure carousels and with the LA 2007 test material. This result is consistent with what was attempted to achieve in system design of being able to independently assess exposure–response without the influence of fiber dimension, chemical compositions, and mineralogy.
Taken together, the six-carousel LA 2007 exposure system was optimized, and the performance confirmed. It has been then used to conduct studies characterizing the toxicity and carcinogenicity of LA 2007 in rats (National Toxicology Program Citation2007). Notably, to assess the biopersistence of this fiber, extensive characterization of lung burden has been included in these studies. Optimization of the lung burden method will be reported separately. The results of these studies with LA asbestos are expected to complete a large data set for this material, together with the existing extensive chemical/physical characterization of the bulk material and human exposure/health effect data, which can further serve as a benchmark for the fiber research community.
Conclusion
An asbestos aerosol generation and exposure system was fabricated and characterized for short-term and long-term nose-only exposure studies of asbestos-like materials in rodents. The exposure system has six exposure carousels with target exposure concentrations of 0 (control), 0.1, 0.3, 1, 3, or 10 mg/m3 for the short-term study. System characterization tests conducted using LA 2007 test material demonstrated the exposure system delivered stable aerosol concentration to the exposure carousels at the target concentrations. The exposure atmosphere (aerosol concentration, temperature, and RH) was stable across three consecutive exposure days.
TEM coupled with EDS and SAED analysis of aerosol samples collected at the exposure port indicated the fiber dimensions, chemical composition, and mineralogy were equivalent across exposure carousels and were comparable to the bulk LA 2007 material. The six-carousel exposure system developed was used to conduct nose-only inhalation toxicity studies of LA 2007 in rats. The exposure system is anticipated to have applicability for the inhalation toxicity evaluation of other natural mineral fibers of concern present in the environment.
Author contributions
AW and AG designed and supervised the experimental work and MG and DP executed the experiments. BE and RR conducted the TEM with SAED and EDS analysis. JR and JS coordinated the TEM samples collection and interpreted the data. AW drafted the manuscript and PLY wrote the ‘Background’ section. BS, KE, GR, PLY, and MS supervised the work and critically reviewed and revised the manuscript. The manuscript was written through contributions of all authors. All authors read and approved the final manuscript.
Ethical approval
Not applicable.
Consent form
Not applicable.
| Abbreviations | ||
| DL | = | distribution line |
| EDS | = | energy dispersive spectrometry |
| EPMA | = | electron probe microanalysis |
| EPA | = | US Environmental Protection Agency |
| GSD | = | geometric deviation |
| HEPA | = | high efficiency particulate filter |
| ISO | = | International Organization for Standardization |
| LA 2007 | = | Libby amphibole 2007 |
| MMAD | = | mass median aerodynamic diameter |
| NIEHS | = | National Institute of Environmental Health Sciences |
| NIOSH | = | National Institute for Occupational Safety and Health |
| PPE | = | personal protective equipment |
| RAM | = | real-time aerosol monitor |
| RH | = | relative humidity |
| RSD | = | relative standard deviation |
| SAED | = | selected area electron diffraction |
| SD | = | standard deviation |
| SEM | = | scanning electron microscope |
| TEM | = | transmission electron microscopy |
| USGS | = | United States Geological Survey |
Supplemental Material
Download Zip (2.7 MB)Disclosure statement
No potential conflict of interest was reported by the author(s).
Data availability statement
The dataset supporting the conclusions of this article is included within the article.
Additional information
Funding
References
- Agency for Toxic Substances and Disease Registry. 2003. Public health assessment for Libby asbestos NPL site, Libby, Lincoln County, Montana. EPA facility ID: MT0009083840.
- Benson R, Berry D, Lockey J, Brattin W, Hilbert T, LeMasters G. 2015. Exposure–response modeling of non-cancer effects in humans exposed to Libby amphibole asbestos; update. Regul Toxicol Pharmacol. 73(3):780–789. doi: 10.1016/j.yrtph.2015.10.019.
- Boulanger G, Andujar P, Pairon J-C, Billon-Galland M-A, Dion C, Dumortier P, Brochard P, Sobaszek A, Bartsch P, Paris C, et al. 2014. Quantification of short and long asbestos fibers to assess asbestos exposure: a review of fiber size toxicity. Environ Health. 13:59–77. doi: 10.1186/1476-069X-13-59.
- Cannon WC, Bass EW, Decker JR. 1988. Nose-only exposure system. United States patent US 4721060A.
- Cannon WC, Blanton EF, McDonald KE. 1983. The flow-past chamber: an improved nose-only exposure system for rodents. Am Ind Hyg Assoc J. 44(12):923–928. doi: 10.1080/15298668391405959.
- Compressed Gas Association (CGA). 2018. CGA G-7.1. Commodity specification for air. 7th ed. Virginia: Compressed Gas Association.
- Davis JM, Addison J, Bolton RE, Donaldson K, Jones AD, Smith T. 1986. The pathogenicity of long versus short fibre samples of amosite asbestos administered to rats by inhalation and intraperitoneal injection. Br J Exp Pathol. 67(3):415–430.
- Davis JM, Beckett ST, Bolton RE, Collings P, Middleton AP. 1978. Mass and number of fibres in the pathogenesis of asbestos-related lung disease in rats. Br J Cancer. 37(5):673–688. doi: 10.1038/bjc.1978.105.
- Dodson RF, Black B, Poye LW, Bruce JR, McNew T. 2020. A clinical evaluation and tissue fiber burden analysis of a lifetime resident of Libby, Montana with adenocarcinoma of the lung. Am J Ind Med. 63(5):456–462. doi: 10.1002/ajim.23096.
- Environmental Protection Agency (EPA). 2014. Toxicological review of Libby amphibole asbestos. EPA 635/R-11/002F. Washington, DC: United States Enviromental Protection Agency.
- Gavett SH, Parkinson CU, Willson GA, Wood CE, Jarabek AM, Roberts KC, Kodavanti UP, Dodd DE. 2016. Persistent effects of Libby amphibole and amosite asbestos following subchronic inhalation in rats. Part Fibre Toxicol. 13:17. doi: 10.1186/s12989-016-0130-z.
- Hawthorne FC, Oberti R, Harlow GE, Maresch WV, Martin RF, Schumacher JC, Welch MD. 2012. Nomenclature of the amphibole supergroup. Am Miner. 97(11–12):2031–2048. doi: 10.2138/am.2012.4276.
- Hinds WC. 1999. Aerosol technology, properties, behavior, and measurement of airborne particles. New York: John Wiley & Sons Inc.
- Hu S-C, Min S, Kang H-K, Yang D-J, Lewis SM, Davis KJ, Patton RE, Bryant MS, Sepehr E, Trbojevich R, et al. 2021. 14-Day nose-only inhalation toxicity and Haber’s rule study of NNK in Sprague-Dawley rats. Toxicol Sci. 183(2):319–337. doi: 10.1093/toxsci/kfab094.
- International Organization for Standardization (ISO). 1995. Ambient air – determination of asbestos fibres – direct-transfer transmission electron microscopy method. ISO Method 10312. Geneva, Switzerland.
- Leake BE, Woolley AR, Arps CE, Birch WD, Gilbert MC, Grice JD, Hawthorne FC, Kato A, Kisch HJ, Krivovichev VG, etal. 1997. Nomenclature of amphiboles: Report of the subcommittee on amphiboles of the International Mineralogical Association, commission on new minerals and mineral names. Can Mineral. 35:219–246.
- Lowers HA, Wilson SA, Hoefen TM, Benzel WM, Meeker GP. 2012. Preparation and characterization of “Libby Amphibole” toxicological testing material. U.S. Geological Survey Open-File Report 2012–1012.
- Lucci F, Tan WT, Krishnan S, Hoeng J, Vanscheeuwijck P, Jaeger R, Kuczaj A. 2020. Experimental and computational investigation of a nose-only exposure chamber. J Aerosol Sci Technol. 54(3):277–290. doi: 10.1080/02786826.2019.1687843.
- Mainelis G, Seshadri S, Garbuzenko OB, Han T, Wang Z, Minko T. 2013. Characterization and application of a nose-only exposure chamber for inhalation delivery of liposomal drugs and nucleic acids to mice. J Aerosol Med Pulm Drug Deliv. 26(6):345–354. doi: 10.1089/jamp.2011-0966.
- McConnell EE, Axten C, Hesterberg TW, Chevalier J, Miiller WC, Everitt J, Oberdörster G, Chase GR, Thevenaz P, Kotin P, et al. 1999. Studies on the inhalation toxicology of two fiberglasses and amosite asbestos in the Syrian golden hamster. Part II. Results of chronic exposure. Inhal Toxicol. 11(9):785–835. doi: 10.1080/089583799196754.
- McDonald JC, McDonald AD, Armstrong B, Sebastien P. 1986. Cohort study of mortality of vermiculite miners exposed to tremolite. Br J Ind Med. 43(7):436–444. doi: 10.1136/oem.43.7.436.
- Meeker GP, Bern AM, Brownfield IK, Lowers HA, Sutley SJ, Hoefen TM, Vance JS. 2003. The composition and morphology of amphiboles from the rainy creek complex, near Libby, Montana. Am Mineral. 88(11–12):1955–1969. doi: 10.2138/am-2003-11-1239.
- Millette JR. 1987. Electron diffraction of asbestos. Microscope. 35:207–215.
- Mossman BT, Gee JB. 1989. Asbestos-related diseases. N Engl J Med. 320(26):1721–1730. doi: 10.1056/NEJM198906293202604.
- National Institute for Occupational Safety & Health (NIOSH). 1994. Manual of analytical methods (NMAM), asbestos by TEM. Method 7402. 4th ed. Washington, DC: The National Institute for Occupational Safety and Health.
- National Toxicology Program. 2007. Testing status of Libby amphibole 09075. https://ntp.niehs.nih.gov/whatwestudy/testpgm/status/ts-09075.html?utm_source=direct&utm_medium=prod&utm_campaign=ntpgolinks&utm_term=ts-09075.
- Noonan CW. 2017. Environmental asbestos exposure and risk of mesothelioma. Ann Transl Med. 5(11):234. doi: 10.21037/atm.2017.03.74.
- Oberdorster G. 2000. Determinants of the pathogenicity of man-made vitreous fibers (MMVF). Int Arch Occup Environ Health. 73(S1):S60–S68. doi: 10.1007/PL00014628.
- Occupational Safety and Health Administration. 1994. Occupational exposure of asbestos. Fed Register # 59:40964–41162.
- Pauluhn J. 1994. Validation of an improved nose-only exposure system for rodents. J Appl Toxicol. 14(1):55–62. doi: 10.1002/jat.2550140111.
- Pfau JC, McNew T, Hanley K, Swan L, Black B. 2019. Autoimmune markers for progression of Libby amphibole lamellar pleural thickening. Inhal Toxicol. 31(11–12):409–419. doi: 10.1080/08958378.2019.1699616.
- Solbes E, Harper RW. 2018. Biological responses to asbestos inhalation and pathogenesis of asbestos-related benign and malignant disease. J Investig Med. 66(4):721–727. doi: 10.1136/jim-2017-000628.
- Stone BR, Heimbuch BK, Wu CY, Wander JD. 2012. Design, construction and validation of a nose-only inhalation exposure system to measure infectivity of filtered bioaerosols in mice. J Appl Microbiol. 113(4):757–766. doi: 10.1111/j.1365-2672.2012.05403.x.
- Szeinuk J, Noonan CW, Henschke CI, Pfau J, Black B, Miller A, Yankelevitz DF, Liang M, Liu Y, Yip R, et al. 2017. Pulmonary abnormalities as a result of exposure to Libby amphibole during childhood and adolescence – the Pre-Adult Latency Study (PALS). Am J Ind Med. 60(1):20–34. doi: 10.1002/ajim.22674.
- Tindle AG, Webb PC. 1994. PROBE-AMPH a spreadsheet program to classify microprobe-derived amphibole analyses. Comput Geosci. 20(7–8):1201–1228. doi: 10.1016/0098-3004(94)90071-X.
- Wang A, Gupta A, Grimm MD, Pressburger DT, Sparrow BR, Richey JS, Shaw JR, Elsass KE, Roberts GK, Yao PL, Stout MD, Ellis BJ, Ray RL. 2023. Natural mineral fibers: conducting inhalation toxicology studies – part A: Libby amphibole aerosol generation and characterization method development. Inhalation Toxicol.
- Wong BA. 2007. Inhalation exposure systems: design, methods and operation. Toxicol Pathol. 35(1):3–14. doi: 10.1080/01926230601060017.