
 ?Mathematical formulae have been encoded as MathML and are displayed in this HTML version using MathJax in order to improve their display. Uncheck the box to turn MathJax off. This feature requires Javascript. Click on a formula to zoom.
Abstract
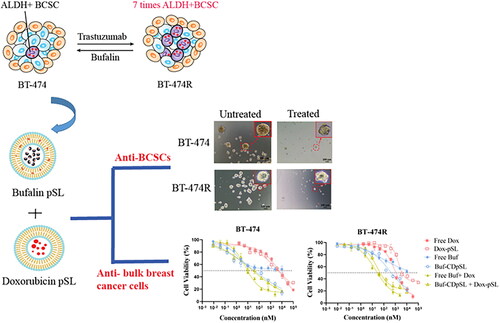
Breast cancer stem cells (BCSCs) play a key role in therapeutic resistance in breast cancer treatments and disease recurrence. This study aimed to develop a combination therapy loaded with pH-sensitive liposomes to kill both BCSCs and the okbulk cancer cells using trastuzumab-sensitive and resistant human epidermal growth factor receptor 2 positive (HER2+) breast cancer cell models. The anti-BCSCs effect and cytotoxicity of all-trans retinoic acid, salinomycin, and bufalin alone or in combination with doxorubicin were compared in HER2+ cell line BT-474 and a validated trastuzumab-resistant cell line, BT-474R. The most potent anti-BCSC agent was selected and loaded into a pH-sensitive liposome system. The effects of the liposomal combination on BCSCs and bulk cancer cells were assessed. Compared with BT-474, the aldehyde dehydrogenase positive BCSC population was elevated in BT-474R (3.9 vs. 23.1%). Bufalin was the most potent agent and suppressed tumorigenesis of BCSCs by ∼50%, and showed strong synergism with doxorubicin in both BT-474 and BT-474R cell lines. The liposomal combination of bufalin and doxorubicin significantly reduced the BCSC population size by 85%, and inhibited both tumorigenesis and self-renewal, although it had little effect on the migration and invasiveness. The cytotoxicity against the bulk cancer cells was also enhanced by the liposomal combination than either formulation alone in both cell lines (p < 0.001). The liposomal bufalin and doxorubicin combination therapy may effectively target both BCSCs and bulk cancer cells for a better outcome in trastuzumab-resistant HER2+ breast cancer.
GRAPHICAL ABSTRACT
1. Introduction
Breast cancer was responsible for most newly diagnosed cancer cases worldwide in 2020 [Citation1]. Despite recent advancements in cancer treatment, patients with breast cancer frequently experience therapy resistance, resulting in disease relapse, metastasis, and death [Citation2]. The presence of breast cancer stem cells (BCSCs) is believed to play a key role in the development of therapeutic resistance [Citation3].
BCSCs, first identified by Al-Hajj et al. in 2003, represent a small subpopulation of breast cancer cells capable of tumor initiation, differentiation, and self-renewal [Citation4,Citation5]. BCSCs are further classified as either mesenchymal or epithelial. Mesenchymal BCSCs, which overexpress cluster of differentiation 44 (CD44) and have low expression of CD24 (CD24+/CD24−) are associated with increased cell proliferation and tumorigenesis. Epithelial BCSCs have elevated intracellular aldehyde dehydrogenase activity (ALDH+), and are associated with cell migration and metastasis [Citation6,Citation7]. Only a small fraction of the two BCSC subpopulations overlap, and the remainder are interconvertible through the mesenchymal-epithelial transition (MET) or epithelial-mesenchymal transition (EMT). Although the removal of BCSCs is considered a promising strategy in anti-cancer therapy [Citation8], the elimination of BCSCs faces major challenges due to their resistance to conventional chemotherapies [Citation9]. Unlike bulk cancer cells, BCSCs are mainly quiescent and not proliferating, and therefore, resistant to chemotherapy agents. They tend to overexpress adenosine triphosphate binding cassette transporters, which pump chemotherapy agents out from the cells, and they have improved DNA repair ability [Citation10,Citation11]. Small molecule drugs, phytochemicals, and RNA interference-based therapies have all been explored to successfully target BCSCs with great success [Citation12–14]. Interestingly, some BCSCs inhibitors, such as salinomycin, showed little cytotoxicity against non-BCSCs [Citation15]. As a result, a cocktail therapy with two or more agents to target BCSCs and non-BCSCs simultaneously, has become a common practice in the search for a favorable outcome [Citation16,Citation17]. Furthermore, the therapy-induced senescence (TIS) cells, which used to be considered as cells undergo irreversible cell growth arrest as a result of chemotherapies or antibody therapies, have recently shown shared characteristics with cancer stem cells [Citation18,Citation19].
The clinical application of conventional chemotherapies and other anti-cancer agents often face limitations, mainly due to their poor solubility, rapid breakdown in the blood stream, and off target side effects. Nanoparticles, such as liposomes, have long been considered a promising strategy to address these issues and to enhance the efficacy and safety of the anti-cancer agents [Citation20]. Nano-scaled liposomes may exploit the tumoral leaky vasculature and exert tumor specific targeting via enhanced permeability and retention (EPR) effect [Citation21]. In addition, stimuli-responsive liposomes could further improve the targeted drug release by responding to exogenous stimuli at the level of tumor cells. In particular, pH-sensitive liposomes (pSL) not only release payload within an acidic tumor environment, they also promote drug escape from the acidic endosome lumen into the cytoplasm to have its effect [Citation22].
The aim of this study was to develop a pSL system loaded with a BCSC-specific inhibitor and doxorubicin (Dox) to target trastuzumab-resistance in human epidermal growth factor receptor 2 positive (HER2+) cells from breast cancer patients. BCSCs are believed to be involved in the high resistance rate (∼70%) of this revolutionary treatment [Citation23,Citation24]. In this study, a trastuzumab-resistant HER2+ cell line, BT-474R, was developed and characterized for the presence of BCSCs and TIS, and used as a more suitable breast cancer cell model of cancer. outlines the origin and reported mechanisms of action of three BCSC specific inhibitors investigated in this study, including all-trans-retinoic-acid (ATRA), salinomycin (Sal), and bufalin (Buf). Among these compounds, Buf, an endogenous cardiotonic steroid in human plasma, has attracted significant interest in the field of oncology with its potent anti-tumor activities through various molecular mechanisms, the ability of reversing various drug-resistance and affecting the immune microenvironment in addition to decreasing cancer cell stemness [Citation30]. The selected BCSC inhibitor alongside Dox was loaded in an optimized pSL system. The effects of the pair on BCSC function and the cytotoxicity against bulk cancer cells were measured in both trastuzumab-sensitive and -resistant HER2 cell lines using various tests. A promising drug combination was identified in the study to target trastuzumab resistance in HER2+ breast cancer patients via the simultaneous inhibition of BCSCs and non-BCSCs activities.
Table 1. The origins and mechanism of action for targeting BCSCs of all-trans retinoic acid (ATRA), salinomycin (Sal), and bufalin.
2. Materials and methods
2.1. Materials
Both all-trans retinoic acid and salinomycin (monosodium salt) were from Sigma-Aldrich (Auckland, New Zealand). Bufalin was purchased from Shanghai Standard Technology (Shanghai, China). Doxorubicin hydrochloride (98%) was purchased from AK Scientific (CA, USA). Trastuzumab solution (21 mg/ml) was reconstituted by dissolving each vial of 150 mg Herceptin® (Roche) in 7.2 ml of Bacteriostatic Water for Injection (Pfizer) and was kept at 4 °C while developing resistant cells. This trastuzumab solution stored at 4 °C was proved to be fully active for at least for 12 months [Citation31].
HER2+ BT-474 human breast cancer cell line was from the American Type Culture Collection (ATCC® HTB-20TM). Dulbecco’s modified eagle’s medium (DMEM), DMEM nutrient mix F12 (DMEM/F12), fetal bovine serum (FBS), penicillin-streptomycin (PS), anti-human/Mouse CD44 Fluorescein isothiocyanate (FITC), anti-human CD24 phycoerythrin, recombinant human basic fibroblast growth factor (bFGF), recombinant human epidermal growth factor (EGF), B27™ supplement (50×) and Trypsin-ethylenediaminetetraacetic acid (Trypsin-EDTA 0.5%) were all purchased from Thermofisher Scientific (Auckland, New Zealand). The agent 3–(4,5-dimethylthiazol-2-yl)-2,5-diphenyltetrazolium bromide (MTT) was from AK Scientific (California, USA). AldeRed® ALDH detection assay kit, dimethyl sulfoxide (DMSO), and β-Galactosidase (β-Gal) staining set were purchased from Sigma-Aldrich (Auckland, New Zealand) while Corning Matrigel basement membrane matrix from In Vitro Technologies (Auckland, New Zealand).
Cholesteryl hemisuccinate (CHEMS), 1,2-dioleoyl-sn-glycero-3-phosphoethanolamine (DOPE), 1,2-distearoyl-sn-glycero-3-phosphocholine (DSPC), cholesterol (CHOL) and 1,2-distearoyl-sn-glycero-3-phosphoethanolamine-N-[amino(polyethylene glycol)-2000] (ammonium salt) (DSPE-PEG2000) were from Avanti Polar Lipids (Alabaster, United States). 2-hydroxypropyl)-β-cyclodextrin (HP-β-CD) was from Sigma-Aldrich (Auckland, New Zealand).
2.2. Development of a trastuzumab-resistant HER2+ cell line
2.2.1. Drug treatment
HER2+ BT-474 cells were maintained in DMEM cell medium supplemented with 10% FBS and 1% PS in an atmosphere of 5% CO2 at 37 °C. To develop a trastuzumab-resistant cell line, BT-474 cells (1 × 10⁵) were grown in a T25 flask and treated with 10 µg/ml trastuzumab for 30 days, then 15 µg/ml for a further 5 months [Citation32,Citation33]. Cells were passaged when 80% confluence was achieved. The morphology of the cells was observed regularly under an Invitrogen Evos XL Core microscope (MA, USA). The final cell line, once confirmed to be trastuzumab-resistance (referred to as BT-474R), was maintained in 15 µg/ml trastuzumab and the first three passages were used in this study.
2.2.2. Confirming trastuzumab-resistance by cell viability assay
To measure the influence of trastuzumab on cell proliferation, BT-474 and BT-474R were seeded at a density of 3000 cells per well in a 96-well plate, and incubated at 37 °C, 5% CO2 overnight in 100 µl of DMEM with 10% FBS and 1% PS. Cells were then treated with trastuzumab at various final concentrations (0.02–1 µM) for 5 days. An MTT cell viability assay was conducted to determine the survival rate of treated cells, using the drug-free medium treated cells as a reference (100%) [Citation34].
2.2.3. Confirming trastuzumab-resistance by cell growth and doubling time (DT)
BT-474 and BT-474R were seeded at a density of 1 × 10⁴ cells per well in 48-well plates, and incubated with or without trastuzumab 10 µg/ml at 37 °C, 5% CO2. The cell growth rate was monitored by counting the cell numbers at day 1 (24 h after seeding), 3, 5, and 7. The doubling time (DT) was determined using an algorithm described by O’Brien et al. [Citation35]:
Where; N0 and Nt is the cell number observed Day 1 and Day 7, respectively, while T is the time between two points.
In addition, to reflect the cell response to the trastuzumab treatment, the ratio of doubling time (RDT) of cells was estimated as:
RDT reflects the fold change in the cell growth rate to the treatment. An RDT smaller than 1.2 of the cells was deemed to be trastuzumab-resistant [Citation35].
2.3. Characterization of BCSCs and TIS populations in BT-474 and BT-474R
2.3.1. Characterization of the CD44+/CD24− BCSC subpopulation
The expression of CD44+/CD24− of BCSCs was measured by flow cytometry. Briefly, BT-474 and BT-474R cells (106) were resuspended in 100 µl of PBS with 2% FBS. Anti-CD44 FITC and anti-CD24 PE (5 µl each) were added into the cell suspensions (100 µl) either individually (as the control) or as a combination. The mixtures were incubated on ice in the dark for 30 min, before being washed three times and resuspended with 500 µl PBS containing 2% FBS and analyzed by Becton Dickinson LSRII flow cytometry.
2.3.2. Characterization of ALDH+ BCSCs subpopulation by AldeRed™ ALDH assay
The ALDH+ BCSC population in BT-474 and BT-474R was measured by AldeRed™ ALDH detection assay kit. Briefly, cells were first resuspended in the supplied AldeRed assay buffer (containing verapamil), and the cell number was adjusted to 2 × 10⁵ cells/ml. Each of the resulting cell suspension (1 ml) was mixed with 5 µl of AldeRed 588 aldehyde, and 0.5 ml of the mixture was immediately transferred to a ‘control’ tube containing 5 µl of ALDH inhibitor diethylaminobenzaldehyde (DEAB). The cells were then incubated at 37 °C for 40 min. The cells were washed and resuspended with 0.5 ml of AldeRed assay buffer. Each sample was mixed with 1.25 µg of propidium iodide (PI) and kept on ice until being analyzed by a Becton Dickinson LSRII flow cytometer. The ratios of CD44+/CD24− and ALDH+ BCSCs to the bulk cancer cells were analyzed using FlowJo 10.8.1.
2.3.3. Determination of therapy induced senescence
To investigate if the slow cell growth in BT-474R was related to therapy-induced senescence, senescence-associated-beta-galactosidase (SA-β-gal) activity was measured using a β-galactosidase (β-gal) assay kit [Citation19]. BT-474 was tested as a reference. Briefly, cells were seeded at a density of 1 × 10⁴ cells/well in a 96-well plate and cultured overnight. The cells were then washed with PBS, and fixed with 0.1 ml of 4% paraformaldehyde at room temperature for 15 min. After removing the fixative solution and washing three times with PBS, the cells were stained with 100 µL of 5-bromo-4-chloro-3-indolyl-B-D-galactopyranoside (X-gal) in iron buffer (5% v/v) and incubated at 37 °C, 5% CO2 for 4 h. The cells were imaged using an Invitrogen EVOS XL Core microscope. The development of a blue color was taken as an indication of senescence.
2.4. Selection of BCSC inhibitor
To select a potent BCSC inhibitor, BCSC inhibition effects of all-trans retinoic acid (ATRA), salinomycin (Sal), and bufalin (Buf) with or without doxorubicin (Dox) were compared on both BT-474 and BT-474R using a mammosphere formation assay. Cytotoxicity and combination indices to bulk cancer cells were also investigated and taken into consideration in selection.
2.4.1. Mammosphere formation assay
The formation of a new mammosphere from a single cell is a distinctive feature of BCSCs (tumorigenicity), and the mammosphere formation assay provides a 3D environment where only BCSCs can survive and grow into a new sphere [Citation36].
Cells were seeded at a density of 4000 cells per well in a Corning Costar® 24-well ultra-low adherence plate and cultured in serum-free mammosphere forming medium consisted of DMEM/F12 with 20 ng/ml EGF, 10 ng/ml bFGF, and B27 supplement. Cells were incubated with ATRA (1 µM), Sal (1 µM), or Buf (20 nM) alone or in combination with Dox (100 or 200 nM) at 37 °C for 5 days with no disturbance. The numbers of the spheres with a diameter >50 µm were counted, and the sphere formation efficiency (SFE) was calculated:
2.4.2. Cytotoxicity and combination index
To determine the cell proliferation of BT-474 and BT-474R following each of the treatments, cells were seeded at a density of 1 × 10⁴ cells per well in a 96-well plate and incubated overnight. ATRA, Sal, and Buf alone and in combination with Dox at molar ratios of 1:10, 1:1, and 10:1 were added into each well (4 wells per concentration level), and incubated at 37 °C for 24 h. Cell viability was then determined using the MTT assay and the half-maximal inhibitory concentrations (IC50) were calculated using GraphPad Prism 8. The Combination Index (CI) was calculated based on the Chou-Talalay method [Citation37]:
Where; D(A)com and D(B)com are the dose of drug A and drug B in combination to inhibit x% of cell growth; D(A)mono and D(B)mono are the dose of drug A and drug B alone to achieve the same effect. The combinational effect is considered additive, synergistic, and antagonistic if CI = 1, <1, or >1, respectively. An additive effect describes a combinational effect of the two drugs equal to the sum of the two drugs acting independently; a synergistic or antagonism describes a greater or smaller effect than the additive effect, respectively [Citation37,Citation38].
Affected fraction (Fa) values alongside CI-Fa diagrams were obtained using CompuSyn software (Version 1.0). Fa has a value between 0 and 1 with the low value representing a low growth inhibition effect [Citation39,Citation40].
2.5. Preparation of Buf- and Dox-loaded pSL
Once the optimal BCSC inhibitor was determined, the selected agent (Buf) was loaded into pSL, with DOPE and CHEMS as a backbone. At neutral pH, ionized CHEMS stabilizes the cone-shaped DOPE to its lamella phase, which favors the formation of the lipid bilayer. At acidic pH, the protonation of CHEMS converts DOPE back to its inverted hexagonal phase, destabilizes the lipid bilayer, and leads to drug release from the liposomes [Citation22].
In the current study, a passive loading and cyclodextrin-aided drug loading of bufalin was attempted.
2.5.1. Loading Buf in pSL bilayer (Buf-pSL)
DOPE: CHEMS: DSPC: DSPE-PEG2000 at a molar ratio of 50:25:25:3 (total 10 mg) and 0.5 mg of Bufalin was dissolved in 1 ml of chloroform: methanol (3:1) in 25 ml round-bottom flask. A thin film was obtained by evaporating the organic solvent using a rotary evaporator (Buchi Rotavapor R-215) under vacuum at 45 °C. The lipid film was hydrated with 1 ml of 0.1 M PBS pH 7.4 at 37 °C. The liposome suspension was then sonicated at 60% amplitude, 0.4 cycle, for 4 min (Bandelin Sonopuls HD 2070). After removing the undissolved Buf by centrifuge at 1000 g for 20 min, the Buf-pSL pellet was obtained by ultracentrifugation at 188 000 g, 4 °C for 1 h using a Sorvall WX 80 Ultracentrifuge (Thermo Scientific).
2.5.2. Cyclodextrin-aided Buf loading into pSL (Buf-CDpSL)
Buf-CDpSL was prepared in a similar way as Buf-pSL. DOPE: CHEMS: DSPE-PEG2000 at a molar ratio of 60:40:3 (total 10 mg lipids) was studied as a basic pSL formulation. DSPC (0, 5, or 10%) or CHOL (0, 5, or 10%) were investigated to improve the drug retention in liposomes; but were not included in the final formula. Buf (3 mg/ml) solubilized in a hydroxypropyl-β-cyclodextrin solution (2.5% w/v, in 0.01 M PBS pH 7.4) was used to hydrate the thin film. In the resulting Buf-CDpSL, Buf was presumably incorporated in both the bilayer and the aqueous cores, either as free Buf or as a complex in HP-β-CD, therefore improving the drug loading and controlled release.
2.5.3. Preparation of Dox-loaded pSL (Dox-pSL)
Dox-pSL was prepared using a remote loading method [Citation41]. Briefly, lipid film made from 10 mg of DOPE: CHEMS: DSPC: CHOL: DSPE-PEG2000 (molar ratio 40:20:20:20:3) was hydrated with 250 mM ammonium sulfate (pH 6.9) at 45 °C. The resulting liposome suspension was frozen (−180 °C, 3 min) and thawed (45 °C, 7 min) for 7 cycles, and extruded through 200 nm (10 times) and 100 nm membrane (10 times) using a 10 ml LIPEX® liposome extruder [Citation42]. After ultracentrifugation, the obtained liposome pellet was resuspended with 1 ml of 1 mg/ml Dox solution (pH 8.0) and incubated at 45 °C for 30 min for drug loading. Liposome pellets were obtained as above and stored at 4 °C.
2.6. Characterization of liposomes
2.6.1. Particle size, zeta potential, and morphology
The particle size, polydispersity index (PDI), and zeta potential of Buf-pSL, Buf-CDpSL, and Dox-pSL were analyzed by dynamic light scattering (DLS) using Zetasizer Nano Series (Malvern Instruments, Malvern, UK). The samples were diluted 1:100 with MilliQ water and measured at 25 °C.
The morphology of the liposomal formulations was observed by cryogenic transmission electron microscopy (cryo-TEM). The liposome samples (10 µl) were placed on a copper grid and bolted to form a thin film. The grid was dipped into liquid ethane and cooled to −180 °C with liquid nitrogen. The samples were then visualized on a Tecnai 12 electron microscope (FEI, Hillsboro, OR, USA) operating at 120 kV.
2.6.2. Entrapment efficiency (EE) and drug loading (DL)
To determine EE and DL, drug-loaded liposomal pellets were re-suspended with PBS before being lysed with 10 times the volume of 10% Triton-X and sonicated for 15 min. The amount of Buf and Dox was determined by validated HPLC methods, both on an Agilent HP 1260 series (California, USA) HPLC system coupled with Chemstation software (Version B. 03). A Luna® 5 µm C18, LC 150 × 4.6 mm column (Phenomenex, California, United States) was used as the stationary phase (maintained at 25 °C). The mobile phase of Buf determination consisted of acetonitrile: 2% trifluoroacetic acid in water (50:50 v/v), set at a flow rate of 0.8 ml/min. The UV detector was set at 296 nm. The assay was linear in the range of 5–40 µg/ml (r = 0.9999). The mobile phase of Dox was consisted of MilliQ water (adjusted to pH 2.6 with 85% phosphoric acid) and acetonitrile (74:26 v/v) at a flow rate of 1.0 ml/min. Dox was detected at an excitation wavelength of 475 nm and emission wavelength of 555 nm. The assay was linear in the range of 0.5–20 µg/ml (r = 0.9952).
The EE and DL were calculated using the following equations:
2.6.3. In vitro pH-sensitive drug release
The pH-dependent release of Buf and Dox from liposomes was measured using the dialysis method with free drug solutions as references. Free Buf in methanol (4 mg/ml) was diluted with MilliQ water to a final concentration of 20 µg/ml. Free Dox (500 µg/ml) was obtained by dissolving Dox HCl in MilliQ water. Liposome pellets (10 mg lipids) were resuspended in 1 ml 0.01 M PBS pH 7.4. Free drug solutions or liposomal suspensions (1 ml per sample) in the cellulose acetate dialysis bags (MWCO 14 kDa) were submerged fully into 50 ml release medium containing either 0.05 M PBS (pH 7.4) or 0.05 M acetate buffer (pH 5.0) and maintained at 37 °C. Samples of the release medium (0.5 ml) were withdrawn at pre-determined intervals for HPLC analysis and replaced with equal volumes of fresh medium.
2.6.4. Physicochemical stability
Drug loaded liposomes (as pellets) were stored at 4 °C. The size, PDI, and zeta-potential were monitored regularly over 5 months.
2.7. In vitro anti-BCSCs effect of Buf and Dox free drug and liposomes
2.7.1. AldeRed™ ALDH detection
BT-474 or BT-474R cells were seeded into 6-well plate at 5 × 10⁵/well and treated with Buf (100 nM), Dox (1 µM), or the combination therapy in both free drug and liposomal formulation for 24 h. The cells were then collected and cell numbers were adjusted to 2 × 10⁵ cells/ml in AldeRed assay buffer (containing verapamil). The cell suspension (0.5 ml) containing AldeRed 588-A with or without DEAB was incubated at 37 °C for 40 min and analyzed by a Becton Dickinson LSRII flow cytometer.
2.7.2. Mammosphere formation
Buf (10 nM) and Dox (100 nM) alone or in combination as free drug or liposomal formulations were added into single cell suspension of BT-474 and BT-474R cells to assess the mammosphere formation efficiency as previously described, and SFEs were calculated to measure the tumorigenicity.
2.7.3. Self-renewal of mammospheres
BT-474 and BT-474R cells were first seeded in a 6-well ultralow attachment plate at 20 000 cells/well and left to grow into primary mammospheres with or without treatments (free or liposomal Buf and Dox alone or in combination) for 5 days. The resulting mammospheres were passaged and seeded in a 24-well ultralow attachment plate at 4000 cells/well in the absence of drug treatment to determine the secondary SFE, which was used to assess the self-renewal capacity of the BCSCs [Citation36].
2.7.4. Transwell migration and invasion assays
The migration ability and invasiveness of BT-474 and BT-474R cells were compared using Transwell migration and invasion assays [Citation43] (). In the invasion assay, 100 µl of Corning® Matrigel® Basement Membrane Matrix (3 mg/ml) was first added into each transwell chamber and incubated at 37 °C for 12 h to form matrix gels.
Figure 1. Schematic illustration of (A) transwell migration assay and (B) transwell invasion assay. BT-474 and BT-474R cells were seeded in the upper chamber in the serum-free DMEM and moved through the 8.0 µm pore membrane without or with Matrigel toward the lower chamber, containing DMEM with 10% FBS. Blue cell represents non-BCSCs and orange cells represent BCSCs.
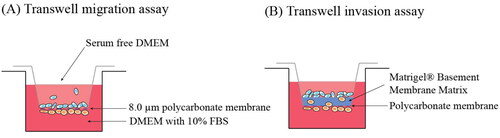
In both assays, the upper chamber was incubated with cells (1 × 10⁵) in serum-free DMEM medium containing the free drug or liposomal Buf (100 nM) and Dox (1 µM) alone or combined, and the lower chambers were filled with 650 µl of DMEM medium with 10% FBS as the attractant. The cells were cultured at 37 °C, 5% CO2 for 18 and 24 h for migration and invasion assays, respectively. After incubation, the retained cells and the matrigel in the upper chamber were cleaned with a cotton swab, and the cells on the lower surface of the chamber were fixed with 4% paraformaldehyde. The fixed cells were finally stained with 0.1% crystal violet at room temperature for 15 min. The migrated/invaded cells were counted in five random fields under 40× magnification with a light microscope (EVOS XL Core, Invitrogen). The average number of cells was used to calculate the percentage of cells migrated in each chamber.
2.8. In vitro anti-proliferation of Buf and Dox against non-BCSCs
Various formulations were incubated with BT-474 and BT-474R cells (10 000 cells/well in 96-well plate) for 24 h. The cell viabilities were evaluated with the MTT assay using medium as untreated controls.
2.9. Statistical analysis
Statistical analysis was performed by t-test or ANOVA tests using GraphPad Prism 8. A p-value of <0.05 was considered statistically significant.
3. Results and discussion
3.1. Confirmation of trastuzumab-resistance of BT-474R
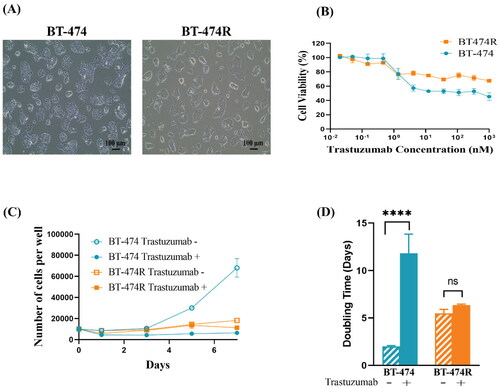
In this study, a trastuzumab-resistant cell line was first generated by continuous exposure of HER2+ BT-474 cells to trastuzumab over 6 months [Citation24,Citation32,Citation33]. BT-474 showed typical epithelial-like cell morphology (), which was maintained in the trastuzumab-resistant BT-474R cells.
Figure 2. Confirmation of trastuzumab-resistance in BT-474R. (A) Morphology observed under a light microscope. BT-474R has a similar morphology as BT-474; (B) Cell viability in the presence of trastuzumab for 5 days (mean ± SD, three independent experiments, four wells per concentration each time); (C) Cell growth curves and (D) Doubling time in the presence or absence of 10 µg/ml trastuzumab. ****p < 0.0001. ns: no significant difference.
3.1.1. Sensitivity to trastuzumab
The MTT assay showed that at concentrations below 1.37 nM, trastuzumab had a minimal effect on cell viability in both cell lines (). At higher concentrations (1.37 nM–1 µM), BT-474R constantly demonstrated a significantly higher cell viability than the parental BT-474 (p < 0.01). Interestingly, maximum cell death was achieved at >4.12 nM in BT-474 and >1.37 nM in BT-474R; and ∼50% of BT-474 and 70% of BT-474R cells remained viable despite increasing trastuzumab concentration.
Trastuzumab binds to the extracellular domain IV of HER2 and inhibits HER2 homodimerisation, thereby preventing HER2-mediated signaling pathway. To elicit antibody-dependent cytotoxicity in vivo, the fragment crystallisable region (Fc) of trastuzumab binds to the Fc gamma receptor on natural killer cells (NKs), which activates NKs and causes cancer cell lysis [Citation44,Citation45]. A lack of NKs in the MTT assay results in a large reduction in the therapeutic effect of trastuzumab, and likely explains why a majority of the cells, especially in BT-474R, were still alive at a high concentration of trastuzumab. The discrepancy between BT-474R and BT-474 could be due to factors, such as downregulation of HER2 receptors in BT-474R [Citation46], and more importantly the presence of BCSCs [Citation24].
3.1.2. The growth rate and doubling time (DT)
As shown in , the growth of parental BT-474 cells was almost completely inhibited by trastuzumab (10 µg/ml), while the cell number increased by almost 6-fold in the absence of trastuzumab (p < 0.0001). In comparison, the growth rate of BT-474R was much slower than BT-474 (p < 0.0001) and was unaffected by the trastuzumab treatment (p > 0.05), confirming its resistance to the antibody.
Consistently, the doubling time (DT) of BT-474 in the presence of 10 µg/ml trastuzumab was prolonged from 2 days to 11.8 days (p < 0.0001), resulting in an RDT value of 5.9. Conversely, DT in BT-474R was not affected by trastuzumab (5.5 ± 0.4 and 6.3 ± 0.1 days; p = 0.1181) (), and the RDT value was 1.1, confirming drug resistance [Citation35].
3.2. Characterization of BCSCs and TIS in BT-474R vs. BT-474
3.2.1. Minimal CD44+/CD24− BCSCs and elevated ALDH+ BCSCs in BT-474R
Flow cytometric analysis showed that the expression level of the most frequently reported BCSC marker CD44+/CD24− was surprisingly minimal in BT-474 (). However, this is consistent with a previous report [Citation47]. A similar unexpected result was found with BT-474R. Other studies reported the contribution of CD44 expression in generating trastuzumab-resistance [Citation48,Citation49], and EMT was well documented to drive the resistance [Citation50,Citation51].
Figure 3. Characterization of BCSCs subpopulation in BT-474 and BT-474R by flow cytometry. CD44+/CD24− BCSCs had minimal expression and ALDH+ BCSCs were elevated in BT-474R. MDA-MB-231 and SKBR3 were used as positive controls for CD44+/CD24− and ALDH+ cells, respectively. (A) CD44+/CD24− cells (in Q3). (B) Expression of ALDH+BCSC population in BT-474, BT-474R. Both experiments were performed in triplicates, and a representative graph is shown.
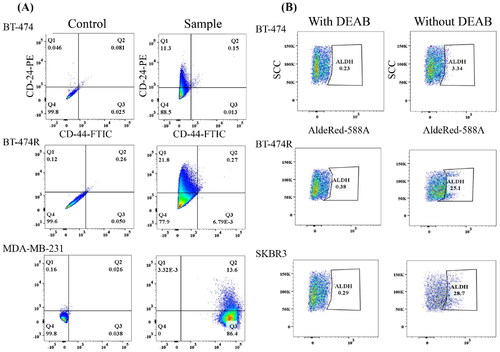
The ALDH+ BCSCs population was found to be 3.9 ± 0.4% in BT-474 (). However, a 5-fold increase in the ALDH+ population size was observed in BT-474R (23.1 ± 1.7%, p = 0.0001). HER2 overexpression is consistently shown to be positively linked to an enrichment of ALDH+ BCSCs [Citation8,Citation52]. High levels of ALDH+ have been associated with elevated cell migration and metastasis [Citation6,Citation7]. This finding may support a worse prognosis of trastuzumab-resistant patients [Citation53].
3.2.2. Senescence was not involved in the trastuzumab-resistance
After incubating with X-gal for 4 h, no development of blue pigmentation was detected in both BT-474 and BT-474R (Figure S1), suggesting long-term trastuzumab treatment did not cause senescence in HER2+ cells, which was in accordance with a previous report [Citation54].
3.3. Selection of BCSC inhibitor
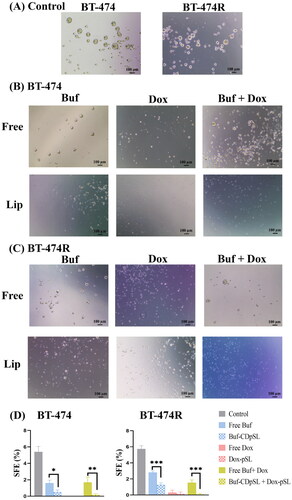
Untreated BT-474 and BT-474R showed similar mammosphere morphology and tumorigenicity () despite the large difference in their ALDH+ BCSC population size. BCSCs can survive and generate new tumor spheres however ALDH+ BCSCs are linked to the proliferation and migration of BCSCs, not tumorigenesis [Citation7].
Figure 4. Representative images of mammospheres (A,B) and SEF (C,D) formed in BT-474 (A,C) and BT-474R (B,D) after treated with free ATRA (1 µM), Sal (1 µM), and Buf (0.02 µM) alone or in combination with Dox (0.1 µM) for 5 days. Data are mean ± SD from three independent experiments.
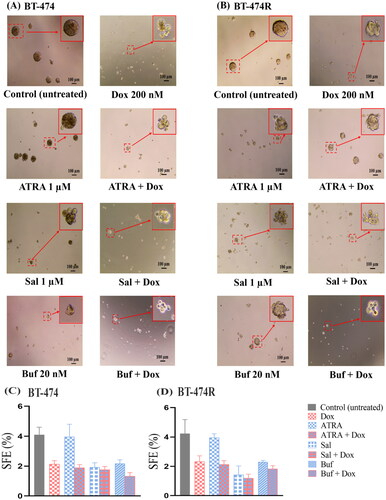
3.3.1. ATRA was ineffective against BCSCs, and the combination with Dox showed antagonism
Treatment with ATRA (1 µM) resulted in irregularly shaped mammospheres only in BT-474R (), but did not affect the SFE of either cell line (p > 0.05). Neither did it affect the cell viability (Figure S2(A)). Being an active metabolite of Vitamin A, ATRA exhibits its biological activity via retinoic acid receptors (RARs) [Citation55]. Overexpression of HER2 was shown to reduce RARα protein level and thus induce ATRA resistance [Citation55].
The combination of ATRA with Dox resulted in loosely packed mammospheres but did not reduce SFEs further than Dox alone () in either cell lines. ATRA and Dox at any tested molar ratios (1:10, 1:1, and 1:0.1) showed comparable IC50 values of Dox to Dox monotherapy (p > 0.05) in BT-474, and even increased values (p < 0.0001) in BT-474R (Figure S2(A)). In addition, the low Fa value (<0.5) in the Fa-combination index (Fa-CI) plot suggested strong antagonism in both cell lines (Figure S2(B)). ATRA has been shown to work in synergism with Dox, through differentiation of BCSCs and causing cell cycle arrest in triple negative breast cancer [Citation56,Citation57]. Possibly due to the low RARα level in HER2+ cells, ATRA failed to show synergism with Dox.
3.3.2. Sal inhibited BCSCs and showed a synergistic effect with Dox only at high concentrations
Sal (1 µM) treatment altered the shape and integrity of the mammospheres and reduced the SFE by 50–60% compared to the untreated group (p < 0.01) (), and the result was consistent with a previous study [Citation58]. Sal showed negligible cytotoxicity at low concentrations but dramatically enhanced after 5.5 µM (Figure S3), particularly to BT-474R. The IC50 values were comparable (p > 0.05) in both cell lines.
The SFE of Sal (1 µM) and Dox (100 nM) combination was comparable to either drug alone in BT-474 (p > 0.05), but lower than Dox monotherapy in BT-474R (). The cytotoxicity of the combination was enhanced with an increase in the molar portion of Sal (Sal: Dox 1:0.1; 1:1, and 1:10) (Figure S3(A)). Calculated CI indicated antagonism between the pair when Fa < 0.4 (Figure S3(B)).
3.3.3. Buf was an effective BCSC inhibitor and showed strong synergism with Dox
Compared with ATRA and Sal, Buf (20 nM) reduced the SFEs by ∼50% to 2.2 ± 0.3% in BT-474 and 2.0 ± 0.2%BT-474R (). The results indicated that Buf was the most effective BCSCs inhibitor among the three tested. Buf has been shown to reduce the number of spheres by 60% in triple negative breast cancer cell line MDA-MB-231 and inhibit tumorigenesis in estrogen receptor positive MCF-7 cells [Citation29,Citation59]. To the best of our knowledge, the present study was the first to show its anti-BCSC effect in HER2+ breast cancer cells with and without trastuzumab-resistance. However, the cytotoxicity of Buf alone was unsatisfactory against bulk cells, and could only reduce the cell viability to ∼50% in both cell lines (Figure S4). The limited cytotoxicity is possibly due to the limited solubility of Buf.
The combination of Buf and Dox significantly reduced SFEs in BT-474 and BT-474R () and reduced the cell viability to <20% in both cell lines. Interestingly, anti-proliferation effects did not appear to be different among different molar ratios of Buf and Dox (p > 0.7). The CIs further confirmed the synergism between Buf and Dox (Figure S4). There are a few mechanisms that might contribute to the synergism between Buf and Dox as found in other types of cancer [Citation60,Citation61]: (1) Buf was able to inhibit the ATP-binding cassette transporters and thus increase the intracellular Dox level; (2) the combination increased apoptosis than either drug alone; and (3) the combination resulted in cell cycle arrest at S-stage.
Overall, by comparing the effect of three BCSC-specific inhibitors, Buf showed a strong anti-BCSCs effect at a low concentration of 20 nM, and strong synergism with Dox, therefore the duo was chosen as an ideal candidate for future study. In addition, since the combination of Buf and Dox at different molar ratios was similar in their anti-cancer effect, a molar ratio with the lowest Buf molar component (Buf: Dox 1:10) was utilized in the in vitro experiments.
3.4. Characterization of Buf and Dox loaded pSL
A ‘Nano + Nano’ approach, in which Buf and Dox were loaded in two separate nanoparticles, was employed [Citation9]. In particular, two methods were investigated to formulate Buf-loaded pSL. The traditional passive loading method, where Buf was incorporated in the lipid membrane (Buf-pSL); or a 2-hydroxypropyl-β-cyclodextrin (HP-β-CD) aided Buf loaded pSL, in which HP-β-CD was used to increase the solubility of Buf by encapsulating additional Buf into the aqueous core (Buf-CDpSL). Initially, the effects of DSPC and CHOL (0, 5, or 10%) on the basic Buf-CDpSL liposome bilayers were investigated, since the two lipids were shown to prolong drug release through increased phase transition temperature or rigidity of the lipid membrane [Citation41]; however, cholesterol, with a similar structure of Buf, may also replace Buf from the inner hydrophobic cavity of HP-β-CD, and reduce drug loading as well as drug retention [Citation62]. The results showed that the addition of DSPC and CHOL to the current pSL membrane had minimal effect on the EE, DL, and drug release profile from Buf-CDpSL.
3.4.1. Morphology, size, and zeta potential
The Cryo-TEM revealed particles with a spherical shape, indicating the successful formation of liposomal vehicles (). The particle size, polydispersity index (PDI), and zeta potential of the liposome formulations were summarized in . The size and zeta potential of Buf-CDpSL with different ratios of DSPC and CHOL added were not changed (Data not shown). Compared with traditional Buf-pSL, the encapsulation of Buf-HPβCD significantly increased the size of the liposomes (t-test, p < 0.0001); such size increase had been previously observed by another research group [Citation63]. The sizes of Buf-CDpSL and Dox-pSL were both in the range of 100–200 nm, which is considered the optimal size of nanoparticles to achieve the enhanced permeability and retention (EPR) effect in solid tumor [Citation64]; and the size of Buf-pSL was also close to the range. The negative charge recorded was preferred in the nanosystem as it suggested an excellent stability and could prolong the circulation of the liposomes by avoiding their interaction with the negatively charged cell membrane [Citation65].
Figure 5. Physicochemical characteristics of liposome formulations. (A) Cryo-TEM images showing the morphology and structure of Buf-pSL and Buf-CDpSL. Scale bar: 100 nm (B) Dox and (C) Buf release in different mediums (pH 7.4 vs. pH 5.0). (D) Buf-CDpSL demonstrated better stability than Buf-pSL during the first 3 months.
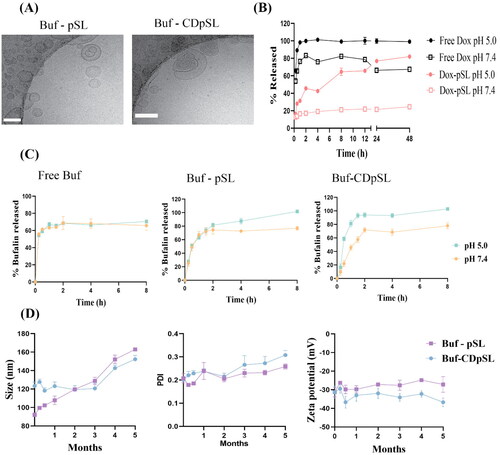
Table 2. Characterization parameters of freshly prepared liposomes (n = 3 experiments).
3.4.2. Entrapment efficiency (EE) and drug loading (DL)
As shown in , the DL in Buf-CDpSL (1.44 ± 0.09%) was significantly higher than Buf-pSL (0.43 ± 0.01%, t-test, p < 0.0001). In the conventional Buf-pSL, the hydrophobic Buf was incorporated in the lipid bilayer of the liposomes, and the poor solubility did not allow the accommodation of Buf into the aqueous core, therefore, the DL in Buf-pSL was limited by the drug-to-lipid ratio and the space offered by the lipid bilayer [Citation62]. HP-β-CD is a commonly used solubiliser, and improves the drug loading in liposomes [Citation42]. The incorporation of Buf into HP-β-CD (2.5% w/v) remarkably increased its solubility to 3 mg/ml in a preliminary study. When used as the hydration medium, it allowed more Buf to be incorporated into the aqueous core as well as the bilayers via partition. Therefore, DL of Buf-CDpSL was higher than that of Buf-pSL. However, a further increase in HP-β-CD concentration could affect the liposome integrity. Notably, the DL observed was lower than a previously reported DL (6% w/w) in non-pH-sensitive liposomes composed of hydrogenated soya phosphatidylcholine (HSPC) and cholesterol [Citation66], in which the ethanol injection method was used.
The EE of Dox was lower than previously reported (>90%) in non-pSL using the same remote loading method [Citation67,Citation68]. A close-to-neutral intraliposomal pH had to be used to stabilize pSL in this study, instead of pH 5.4 used in non-pSL. Therefore, the pH gradient across the lipid membrane, which acted as a driving force for Dox influx, was smaller.
3.4.3. pH-sensitive drug release
Compared with free Buf and Buf-pSL, Buf-CDpSL showed a slower drug release, especially within the first 30 min; but both Buf-pSL and Buf-CDpSL reached the same release level after 2 h (). Free Buf demonstrated similar release profiles at pH 7.4 and pH 5.0 (paired t-test, p > 0.05). Drug release from Buf-CDpSL at pH 5.0 was significantly higher than that at pH 7.4 (paired t-test, p = 0.001), which indicated pH-sensitive drug release was only achieved in Buf-CDpSL. CD-encapsulated liposomes have been shown to sustain drug release compared with conventional liposomes [Citation63,Citation69]. In Buf-CDpSL, Buf was first released from Buf-HPβCD in the liposomal core and then had to overcome the lipid membrane, therefore, the release of Buf from Buf-CDpSL was slower [Citation62]. On the other hand, Buf-pSL, in which Buf was incorporated in the bilayers, did not show pH-sensitivity and the release was too rapid than Buf-CDpSL.
Both free Dox and Dox-pSL showed pH-sensitive release in vitro (). Being a weak base, the solubility of free Dox increases with a decrease in pH; therefore more soluble Dox was released faster at pH 5.0 compared with pH 7.4 [Citation70]. However, at pH 7.4, the release of free Dox was more rapid than Dox-pSL, with 80% of total free Dox released by 2 h while <25% from Dox-pSL after 48 h. This is preferred to ensure an adequate amount of drug maintained in pSL before reaching the tumor [Citation71].
3.4.4. Stability
The size of Buf-pSL started to increase as early as the first week, and a significant increase in size was observed by the end of week 2 (p = 0.007) (). In contrast, Buf-CDpSL only showed an increased PDI after 3 months and a significant change in size after 4 months (p < 0.001) ().
Overall, Buf-CDpSL was used in the next evaluations identified as the ideal liposomal because of its higher DL, proved pH-sensitive drug release, and better stability profile than Buf-pSL.
3.5. In vitro anti-BCSCs effect of Buf and Dox free drug and liposome
3.5.1. Buf and Dox reduced ALDH+ BCSCs in BT-474R, not BT-474
In BT-474R, free Buf and free Dox were able to reduce ALDH+ BCSCs significantly from 23 to 11 and 7%, respectively (p < 0.0001). The inhibition activity was further improved by the incorporation of Buf and Dox into pSL systems. Liposomal Buf and Dox alone or in combination demonstrated a significant reduction of the ALDH+ population to ∼4%, which was similar to that in the untreated BT-474 cells (). Notably, the ALDH+ BCSCs density in BT-474 was not affected by any treatment investigated.
Figure 6. ALDH+ cell populations in BT-474 and Bt-474R measured by an AldeRed™ ALDH detection assay following 24 h exposure to bufalin (Buf; 100 nM) and doxorubicin (Dox; 1 µM) alone or in combination as free drug(s) or loaded in pSL, with untreated cells as controls. Data are mean ± SD (n = 3 independent experiments). ns: not statistically different by ANOVA; ****p < 0.0001.
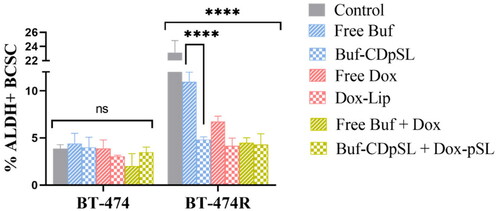
The measured inhibitory effect of Buf on ALDH BT-474R was consistent with a recent study by Ding et al., who demonstrated that ALDH+ CSC was significantly decreased by Buf in colorectal cancer via downregulation of the receptor tyrosine kinase receptor C-kit/Slug signaling [Citation72]. However, it is interesting to see the inhibition of ALDH+ BCSC by Dox in this study. Other studies on triple-negative breast cancer cells [Citation73], found ALDH BCSC was enriched after treatment with Dox.
3.5.2. Buf and Dox significantly inhibited the tumorigenesis of BCSCs
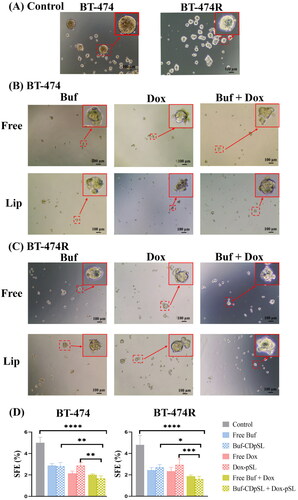
All treatments caused disintegration of the primary mammosphere and significantly reduced the secondary SFEs in both cell lines (p < 0.005) (). The combinations were more effective than either drug alone. There was no statistical difference between the free drug and the liposomal formulations, which was not surprising [Citation74]. The free drug could easily diffuse into the 2-dimensional cell models to exert its effect, while pSL formulations had to undergo extra steps, such as cell attachment, internalization, endosomal escape, and lastly release Dox into the cytoplasm. In addition, the negative charge on the cancer cells may repel the negatively charged pSL and prevent the internalization of the liposomes. However, the anionic and neutral liposomes are still preferred for intravenous administration and tumor targeting in clinical applications, as they are less likely to be cleared through reticuloendothelial system than cationic liposomes [Citation75].
Figure 7. Buf And Dox inhibit sphere formation of BCSCs in BT-474 and BT-474R. (A) Morphologies of spheres formed in untreated BT-474 and BT-474R cells (control). (B,C) Morphologies of spheres in BT-474 (B) and BT-474R (C) after being treated with Buf (10 nM) and Dox (100 nM) mono-or combination either as free drug or liposomes for 5 days. Cells were seeded at 4000 cells per well in ultra-low adherent 24 well plate. (D) SFE of BT-474 and BT-474R with or without (control) Buf and Dox treatment (mean ± SD). *p < 0.05; **p < 0.01; ***p < 0.001; ****p < 0.0001. The experiments were repeated three times, with two wells for each treatment in each experiment, and images from one experiment are presented.
3.5.3. Buf and Dox significantly inhibited the self-renewal of the BCSCs
After one passage, mammosphere formation was maintained in untreated cells (). All treatments investigated significantly reduced the formation of secondary mammospheres in both cell lines (p < 0.0001). Buf-CDpSL was more effective in reducing the formation of secondary spheres (SFEs 0.5 ± 0.3% in BT-474 and 1.3 ± 0.3% in BT-474R) than free Buf (SFEs 1.6 ± 0.4% in BT-474 and 2.8 ± 0.2% in BT-474R) (). The combination treatment with free Buf and Dox was not more effective than free Dox alone. However, the Buf-CDpSL and Dox-pSL co-treatment almost completely inhibited secondary mammosphere formation, a strong evidence of the efficient intracellular delivery of the pSL.
Figure 8. Buf And Dox inhibit self-renewal of BCSCs in BT-474 and BT-474R. (A) Morphology of secondary spheres formed in untreated BT-474 and BT-474R cells (control) were round. After treatments, the secondary mammospheres in (B) BT-474 and (C) BT-474R lost their integrity. (D) Secondary SFE of BT-474 and BT-474R (mean ± SD from three repeated experiments, with two wells for each treatment each time. *p < 0.05; **p < 0.01; ***p < 0.001.
Self-renewal, which refers to a cell division that enables stem cells to produce another stem cell with the same replication potential, is one of the major features of BCSCs [Citation76]. Previous studies have shown that free Buf was able to inhibit the self-renewal of CSCs in triple negative breast cancer and gallbladder cancer via down-regulation of stemness associated Sox2 and Oct4 [Citation29,Citation77]. This study further proved its inhibition of self-renewal in HER2+ breast cancer. Interestingly, Dox (25 nM) was found to enhance the self-renewal ability by 4-fold through the activation of transforming growth factor beta in triple-negative breast cancer cells after 7 days, which was in contradictory to the present finding [Citation78].
3.5.4. Buf and Dox did not significantly inhibit the migration and invasiveness of BCSCs
The invasion of cancer cells through the basement membrane and the extracellular matrix, and the migration of those cells into the surrounding tissue and the blood vessels, mark the first step of a metastatic cascade, which is the leading cause of cancer death [Citation79]. The current study discovered that although the ALDH+ level was elevated in BT-474R, the percentage of migrated and invaded cells was comparable in untreated BT-474 and BT-474R (∼30%, p > 0.05) (Figure S5). This finding was in disagreement with previous reports, which proposed an enhanced migration and invasion with elevated ALDH activity in vitro and in vivo [Citation80]. Furthermore, despite significant inhibition of ALDH+ BCSCs in BT-474R, all treatments imposed showed little inhibition on the migration and invasiveness of both cell lines (p > 0.05). Despite the importance of EMT in metastasis, epithelial (ALDH+) BCSCs are not the only cells responsible for migration and invasion [Citation81]. Mesenchymal stem cells also showed enhanced metastatic potency [Citation82]; round and deformable ameboid cells could squeeze through small pores and migrate [Citation81]; and multiple cells can retain the intercellular connection and migrate collectively [Citation81].
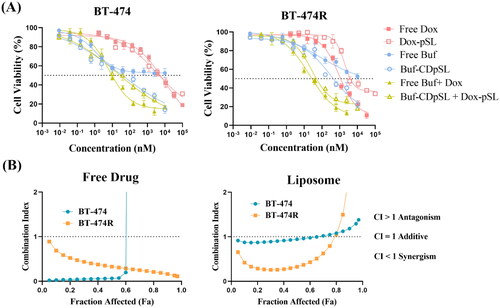
3.6. Buf-CDpSL enhanced cytotoxicity of free Buf, and the combination demonstrated synergism against non-BCSCs
Buf-CDpSL was shown to reduce the cell viability of BT-474 and BT474R to 22.1 ± 3.3 and 14.0 ± 4.0%, respectively, whereas, free Buf could only reduce the viability to ∼52% in both cells (). The enhanced cytotoxicity is likely due to the improved solubility of Buf by the formulation. Similar to the free drug combination, the combined liposomal formulation (Buf-CDpSL + Dox-pSL) showed a lower IC50 than either drug alone in both cell lines, and the CI further confirmed strong synergism between the pair in both cell lines (). However, IC50 of Dox-pSL was comparable to that of free Dox in BT-474 and significantly higher in BT-474R (t-test, p = 0.035); although there was no statistical difference was observed between the free drug combination and liposomal combination in both cells (p > 0.05). The free drugs had better access to the cells in vitro, and the benefits of using a nanocarrier could be better realized in vivo in future studies [Citation74]. Previous research from our group showed that although gemcitabine-loaded pSL did not improve the cytotoxicity of the drug against pancreatic cancer cells in vitro, the pSL formulation demonstrated significant anti-tumor effect in vivo through enhanced cellular uptake and tumor targeting [Citation34].
Figure 9. In vitro anti-proliferation effect of Buf and Dox alone or in combination (as free drug or in liposomes) to BT-474 and BT-474R cells. (A) Cell viability after treatment of 24 h (mean ± SD, n = 3 experiments, four wells for each concentration in each experiment). Concentrations of the combined therapy were expressed based on Buf. (B) CI showing synergism of Buf and Dox in BT-474 and BT-474R as both free drug and liposomal formulation.
4. Conclusion
In this study, a trastuzumab-resistant HER2+ cell line BT-474R was developed in which the ALDH+ BCSCs were found to be elevated while CD44+/CD24− BCSCs remained low. Among the three BCSC inhibitors, Buf was identified to have the strongest anti-BCSCs action and synergism with Dox against both BT-474 and BT-474R.
Buf and Dox were successfully loaded in pSL for improved cytoplasmic drug delivery. Compared with traditional Buf-loaded pSL, HP-β-CD assisted Buf loading had significantly improved the drug loading, exhibited pH-sensitive drug release, and showed better stability. The pSL formulations as well as the liposomal combination were more effective in suppressing the ALDH+ BCSCs in BT-474R than free Buf or free Dox. Furthermore, the liposomal combination also significantly enhanced the cytotoxicity against bulk cancer cells in both cell lines, superior to free drugs or the individual pSL formulation. However, little effect on migration and invasion was observed with any treatment on either cell line.
In summary, Buf and Dox combination loaded pSL systems simultaneously targeting BCSCs and non-BCSCs is a promising strategy to address the trastuzumab-resistance in HER2+ breast cancer. Further translational animal model is needed to assess the clinical benefits of the liposomal combination in vivo.
Supplemental Material
Download MS Word (2.1 MB)Disclosure statement
No potential conflict of interest was reported by the author(s).
Additional information
Funding
References
- Ferlay J, Ervik M, Colombet M, et al. 2020. Global cancer observatory: cancer today. [online]. Lyon: International Agency for Research on Cancer. Available from: https://gco.iarc.fr/today
- Ullah M. Breast cancer: current perspectives on the disease status. Adv Exp Med Biol. 2019;1152:51–64.
- Palomeras S, Ruiz-Martínez S, Puig T. Targeting breast cancer stem cells to overcome treatment resistance. Molecules. 2018;23(9):2193. doi: 10.3390/molecules23092193.
- Al-Hajj M, Wicha MS, Benito-Hernandez A, et al. Prospective identification of tumorigenic breast cancer cells. Proc Natl Acad Sci USA. 2003;100(7):3983–3988. doi: 10.1073/pnas.0530291100.
- Zeng X, Liu C, Yao J, et al. Breast cancer stem cells, heterogeneity, targeting therapies and therapeutic implications. Pharmacol Res. 2021;163:105320. doi: 10.1016/j.phrs.2020.105320.
- Dittmer J. Breast cancer stem cells: Features, key drivers and treatment options. Semin Cancer Biol. 2018;53:59–74. doi: 10.1016/j.semcancer.2018.07.007.
- Li W, Ma H, Zhang J, et al. Unraveling the roles of CD44/CD24 and ALDH1 as cancer stem cell markers in tumorigenesis and metastasis. Sci Rep. 2017;7(1):13856. doi: 10.1038/s41598-017-14364-2.
- Qiu Y, Yang L, Liu H, et al. Cancer stem cell-targeted therapeutic approaches for overcoming trastuzumab resistance in HER2-positive breast cancer. Stem Cells. 2021;39(9):1125–1136. doi: 10.1002/stem.3381.
- Gao Y, Tang M, Leung E, et al. Dual or multiple drug loaded nanoparticles to target breast cancer stem cells. RSC Adv. 2020;10(32):19089–19105. doi: 10.1039/d0ra02801k.
- Krause M, Dubrovska A, Linge A, et al. Cancer stem cells: radioresistance, prediction of radiotherapy outcome and specific targets for combined treatments. Adv Drug Deliv Rev. 2017;109:63–73. doi: 10.1016/j.addr.2016.02.002.
- Zhou Q, Sun Y, Lu Y-Y, et al. Curcumin reduces mitomycin C resistance in breast cancer stem cells by regulating bcl-2 family-mediated apoptosis. Cancer Cell Int. 2017;17(1):84. doi: 10.1186/s12935-017-0453-3.
- Samson AAS, Park S, Kim SY, et al. Liposomal co-delivery-based quantitative evaluation of chemosensitivity enhancement in breast cancer stem cells by knockdown of GRP78/CLU. J Liposome Res. 2019;29(1):44–52. doi: 10.1080/08982104.2017.1420081.
- Yang Z, Sun N, Cheng R, et al. Hybrid nanoparticles coated with hyaluronic acid lipoid for targeted co-delivery of paclitaxel and curcumin to synergistically eliminate breast cancer stem cells. J Mater Chem B. 2017;5(33):6762–6775. doi: 10.1039/c7tb01510k.
- Zhang N, Liang X, Gao C, et al. Loading lovastatin into camptothecin-floxuridine conjugate nanocapsules for enhancing anti-metastatic efficacy of cocktail chemotherapy on triple-negative breast cancer. ACS Appl Mater Interfaces. 2018;10(35):29385–29397. doi: 10.1021/acsami.8b11723.
- Zhang Y, Liu L, Li F, et al. Salinomycin exerts anticancer effects on PC-3 cells and PC-3-derived cancer stem cells in vitro and in vivo. Biomed Res Int. 2017;2017:4101653. doi: 10.1155/2017/4101653.
- Gao J, Liu J, Xie F, et al. Co-delivery of docetaxel and salinomycin to target both breast cancer cells and stem cells by plga/tpgs nanoparticles. Int J Nanomedicine. 2019;14:9199–9216. doi: 10.2147/IJN.S230376.
- Sulaiman A, McGarry S, El-Sahli S, et al. Co-targeting bulk tumor and CSCs in clinically translatable TNBC patient-derived xenografts via combination nanotherapy. Mol Cancer Ther. 2019;18(10):1755–1764. doi: 10.1158/1535-7163.MCT-18-0873.
- Saleh T, Bloukh S, Carpenter VJ, et al. Therapy-induced senescence: an “old” friend becomes the enemy. Cancers. 2020;12(4):822. doi: 10.3390/cancers12040822.
- Tang M, Lozano Hernandez L, Reginald-Opara JN, et al. Zebularine suppressed gemcitabine-induced senescence and improved the cellular and plasma pharmacokinetics of gemcitabine, augmented by liposomal co-delivery. Int J Pharm. 2021;602:120659. doi: 10.1016/j.ijpharm.2021.120659.
- Rommasi F, Esfandiari N. Liposomal nanomedicine: applications for drug delivery in cancer therapy. Nanoscale Res Lett. 2021;16(1):95.
- Golombek SK, May JN, Theek B, et al. Tumor targeting via EPR: strategies to enhance patient responses. Adv Drug Deliv Rev. 2018;130:17–38. doi: 10.1016/j.addr.2018.07.007.
- Kanamala M, Wilson WR, Yang M, et al. Mechanisms and biomaterials in pH-responsive tumour targeted drug delivery: a review. Biomaterials. 2016;85:152–167. doi: 10.1016/j.biomaterials.2016.01.061.
- Maadi H, Soheilifar MH, Choi WS, et al. Trastuzumab mechanism of action; 20 years of research to unravel a dilemma. Cancers. 2021;13(14):3540. doi: 10.3390/cancers13143540.
- Rodríguez CE, Berardi DE, Abrigo M, et al. Breast cancer stem cells are involved in trastuzumab resistance through the HER2 modulation in 3D culture. J Cell Biochem. 2018;119(2):1381–1391. doi: 10.1002/jcb.26298.
- Li R-J, Ying X, Zhang Y, et al. All-trans retinoic acid stealth liposomes prevent the relapse of breast cancer arising from the cancer stem cells. J Control Release. 2011;149(3):281–291. doi: 10.1016/j.jconrel.2010.10.019.
- Wang H, Zhang H, Zhu Y, et al. Anticancer mechanisms of salinomycin in breast cancer and its clinical applications. Front Oncol. 2021;11:654428. doi: 10.3389/fonc.2021.654428.
- Qi D, Liu Y, Li J, et al. Salinomycin as a potent anticancer stem cell agent: state of the art and future directions. Med Res Rev. 2022;42(3):1037–1063. doi: 10.1002/med.21870.
- Wang J, Xia Y, Zuo Q, et al. Molecular mechanisms underlying the antimetastatic activity of bufalin. Mol Clin Oncol. 2018;8(5):631–636. doi: 10.3892/mco.2018.1591.
- Chen F, Li ZHU, Junyan HU, et al. Bufalin attenuates triple‑negative breast cancer cell stemness by inhibiting the expression of SOX2/OCT4. Oncol Lett. 2020;20(5):171–171. doi: 10.3892/ol.2020.12028.
- Soumoy L, Ghanem GE, Saussez S, et al. Bufalin for an innovative therapeutic approach against cancer. Pharmacol Res. 2022;184:106442. doi: 10.1016/j.phrs.2022.106442.
- Gao Y, Shelling AN, Porter D, et al. Stability of trastuzumab during nanomedicine formulation using SEC-HPLC coupled with polyacrylamide gel electrophoresis. Pharm Dev Technol. 2023;28(3–4):288–298. doi: 10.1080/10837450.2023.2191277.
- Gonzalez-Alonso P, Cristobal I, Zazo S, et al. Recent insights into the development of preclinical trastuzumab-resistant HER2+ breast cancer models. Curr Med Chem. 2018;25(17):1976–1998. doi: 10.2174/0929867323666161216144659.
- Zazo S, González-Alonso P, Martín-Aparicio E, et al. Generation, characterization, and maintenance of trastuzumab-resistant HER2+ breast cancer cell lines. Am J Cancer Res. 2016;6(11):2661–2678.
- Tang M, Svirskis D, Leung E, et al. Can intracellular drug delivery using hyaluronic acid functionalised pH-sensitive liposomes overcome gemcitabine resistance in pancreatic cancer? J Control Release. 2019;305:89–100. doi: 10.1016/j.jconrel.2019.05.018.
- O’Brien NA, Browne BC, Chow L, et al. Activated phosphoinositide 3-kinase/AKT signaling confers resistance to trastuzumab but not lapatinib. Mol Cancer Ther. 2010;9(6):1489–1502. doi: 10.1158/1535-7163.MCT-09-1171.
- Lombardo Y, de Giorgio A, Coombes CR, et al. Mammosphere formation assay from human breast cancer tissues and cell lines. J Vis Exp. 2015;97:52671. doi: 10.3791/52671.
- Chou T-C. Drug combination studies and their synergy quantification using the Chou-Talalay method. Cancer Res. 2010;70(2):440–446. doi: 10.1158/0008-5472.CAN-09-1947.
- Chou T. Theoretical basis, experimental design, and computerized simulation of synergism and antagonism in drug combination studies. Pharmacol Rev. 2006;58(3):621–681. doi: 10.1124/pr.58.3.10.
- Wang F, Dai W, Wang Y, et al. The synergistic in vitro and in vivo antitumor effect of combination therapy with salinomycin and 5-Fluorouracil against hepatocellular carcinoma. PLOS One. 2014;9(5):e97414. doi: 10.1371/journal.pone.0097414.
- Zhang R, Yang J, Sima M, et al. Sequential combination therapy of ovarian cancer with degradable N-(2-hydroxypropyl)methacrylamide copolymer paclitaxel and gemcitabine conjugates. Proc Natl Acad Sci USA. 2014;111(33):12181–12186. doi: 10.1073/pnas.1406233111.
- Ishida T, Okada Y, Kobayashi T, et al. Development of pH-sensitive liposomes that efficiently retain encapsulated doxorubicin (DXR) in blood. Int J Pharm. 2006;309(1–2):94–100. doi: 10.1016/j.ijpharm.2005.11.010.
- Zhang W, Wang G, Falconer JR, et al. Strategies to maximize liposomal drug loading for a poorly water-soluble anticancer drug. Pharm Res. 2015;32(4):1451–1461. doi: 10.1007/s11095-014-1551-8.
- Wang Y, Shen SY, Liu L, et al. Jolkinolide B inhibits proliferation or migration and promotes apoptosis of MCF-7 or BT-474 breast cancer cells by downregulating the PI3K-Akt pathway. J Ethnopharmacol. 2022;282:114581. doi: 10.1016/j.jep.2021.114581.
- Clynes RA, Towers TL, Presta LG, and, al, et. Inhibitory Fc receptors modulate in vivo cytoxicity against tumor targets. Nat Med. 2000;6(4):443–446. doi: 10.1038/74704.
- Valabrega G, Montemurro F, Aglietta M. Transtuzumab: mechanism of action, resistance and future perspectives in HER2-overexpressing breast cancer. Ann Oncol. 2007;18(6):977–984. doi: 10.1093/annonc/mdl475.
- Mittendorf E, Wu Y, Scaltriti M, et al. Loss of HER2 amplification following trastuzumab-based neoadjuvant systemic therapy and survival outcomes. Clin Cancer Res. 2009;15(23):7381–7388. doi: 10.1158/1078-0432.CCR-09-1735.
- Jin J, Krishnamachary B, Mironchik Y, et al. Phototheranostics of CD44-positive cell populations in triple negative breast cancer. Sci Rep. 2016;6(1):27871. doi: 10.1038/srep27871.
- Boulbes DR, Chauhan GB, Jin Q, et al. CD44 expression contributes to trastuzumab resistance in HER2-positive breast cancer cells. Breast Cancer Res Treat. 2015;151(3):501–513. doi: 10.1007/s10549-015-3414-3.
- Dhillon J, Astanehe A, Lee C, et al. The expression of activated Y-box binding protein-1 serine 102 mediates trastuzumab resistance in breast cancer cells by increasing CD44+ cells. Oncogene. 2010;29(47):6294–6300. doi: 10.1038/onc.2010.365.
- Nami B, Wang Z. HER2 in breast cancer stemness: a negative feedback loop towards trastuzumab resistance. Cancers. 2017;9(5):40. doi: 10.3390/cancers9050040.
- Oliveras-Ferraros C, Corominas-Faja B, Cufí S, et al. Epithelial-to-mesenchymal transition (EMT) confers primary resistance to trastuzumab (herceptin). Cell Cycle. 2012;11(21):4020–4032. doi: 10.4161/cc.22225.
- Korkaya H, Paulson A, Iovino F, et al. HER2 regulates the mammary stem/progenitor cell population driving tumorigenesis and invasion. Oncogene. 2008;27(47):6120–6130. doi: 10.1038/onc.2008.207.
- Ottewell D, Theillet C, Vivekanandhan S, et al. Resistance to trastuzumab. Cancers. 2022;14(20):5115. doi: 10.3390/cancers14205115.
- McDermott MSJ, Conlon N, Browne BC, et al. HER2-targeted tyrosine kinase inhibitors cause therapy-induced-senescence in breast cancer cells. Cancers. 2019;11(2):197. doi: 10.3390/cancers11020197.
- Tari AM, Lim SJ, Hung MC, et al. Her2/neu induces all-trans retinoic acid (ATRA) resistance in breast cancer cells. Oncogene. 2002;21(34):5224–5232. doi: 10.1038/sj.onc.1205660.
- Liu y, Yu F, Dai S, et al. All-trans retinoic acid and doxorubicin delivery by folic acid modified polymeric micelles for the modulation of Pin1-mediated dox-induced breast cancer stemness and metastasis. Mol Pharm. 2021;18(11):3966–3978. doi: 10.1021/acs.molpharmaceut.1c00220.
- Sun R, Liu Y, Li SY, et al. Co-delivery of all-trans-retinoic acid and doxorubicin for cancer therapy with synergistic inhibition of cancer stem cells. Biomaterials. 2015;37:405–414. doi: 10.1016/j.biomaterials.2014.10.018.
- Li J, Xu WQ, Yuan XL, et al. Polymer-lipid hybrid anti-HER2 nanoparticles for targeted salinomycin delivery to HER2-positive breast cancer stem cells and cancer cells. Int J Nanomedicine. 2017;12:6909–6921. doi: 10.2147/IJN.S144184.
- Li Y, Tian X, Liu X, et al. Bufalin inhibits human breast cancer tumorigenesis by inducing cell death through the ROS-mediated RIP1/RIP3/PARP-1 pathways. Carcinogenesis. 2018;39(5):700–707. doi: 10.1093/carcin/bgy039.
- Yuan ZT, Shi XJ, Yuan YX, et al. Bufalin reverses ABCB1-mediated drug resistance in colorectal cancer. Oncotarget. 2017;8(29):48012–48026. doi: 10.18632/oncotarget.18225.
- Zhang C, Fu L. Effects of bufalin combined with doxorubicin on the proliferation and apoptosis of human lung cancer cell line A549 in vitro. Zhong Nan Da Xue Xue Bao Yi Xue Ban. 2017;42(7):762–768. doi: 10.11817/j.issn.1672-7347.2017.07.004.
- Chen J, Lu WL, Gu W, et al. Drug-in-cyclodextrin-in-liposomes: a promising delivery system for hydrophobic drugs. Expert Opin Drug Deliv. 2014;11(4):565–577. doi: 10.1517/17425247.2014.884557.
- Lin E-Y, Chen Y-S, Li Y-S, et al. Liposome consolidated with cyclodextrin provides prolonged drug retention resulting in increased drug bioavailability in brain. Int J Mol Sci. 2020;21(12):4408. doi: 10.3390/ijms21124408.
- Wu J. The enhanced permeability and retention (EPR) effect: the significance of the concept and methods to enhance its application. J Pers Med. 2021;11(8):771. doi: 10.3390/jpm11080771.
- Di J, Gao X, Du Y, et al. Size, shape, charge and “stealthy” surface: Carrier properties affect the drug circulation time in vivo. Asian J Pharm Sci. 2021;16(4):444–458. doi: 10.1016/j.ajps.2020.07.005.
- Zhang Y, Tian Z, Zhao X, et al. Dual-modified bufalin loaded liposomes for enhanced tumor targeting. Colloids Surf A. 2019;571:72–79. doi: 10.1016/j.colsurfa.2019.03.060.
- Alyane M, Barratt G, Lahouel M. Remote loading of doxorubicin into liposomes by transmembrane pH gradient to reduce toxicity toward H9c2 cells. Saudi Pharm J. 2016;24(2):165–175. doi: 10.1016/j.jsps.2015.02.014.
- Bolotin EM, Cohen R, Bar LK, et al. Ammonium sulfate gradients for efficient and stable remote loading of amphipathic weak bases into liposomes and ligandoliposomes. J Liposome Res. 1994;4(1):455–479. doi: 10.3109/08982109409037057.
- Chen H, Gao J, Wang F, et al. Preparation, characterization and pharmacokinetics of liposomes-encapsulated cyclodextrins inclusion complexes for hydrophobic drugs. Drug Deliv. 2007;14(4):201–208. doi: 10.1080/10717540601036880.
- Rehman A, Omran Z, Anton H, et al. Development of doxorubicin hydrochloride loaded pH-sensitive liposomes: investigation on the impact of chemical nature of lipids and liposome composition on pH-sensitivity. Eur J Pharm Biopharm. 2018;133:331–338. doi: 10.1016/j.ejpb.2018.11.001.
- Zhang W, Wang G, See E, et al. Post-insertion of poloxamer 188 strengthened liposomal membrane and reduced drug irritancy and in vivo precipitation, superior to PEGylation. J Control Release. 2015;203:161–169. doi: 10.1016/j.jconrel.2015.02.026.
- Ding L, Yang Y, Lu Q, et al. Bufalin inhibits tumorigenesis, stemness, and epithelial–mesenchymal transition in colorectal cancer through a C-kit/slug signaling axis. Int J Mol Sci. 2022;23(21):13354. doi: 10.3390/ijms232113354.
- Irene B, Claudio M. Doxorubicin and α-Mangostin oppositely affect luminal breast cancer cell stemness evaluated by a new retinaldehyde-dependent ALDH assay in MCF-7 tumor spheroids. Biomed Pharmacother. 2020;124:109927.
- Geng T, Tang M, Yee Paek S, et al. A simple approach to re-engineering small extracellular vesicles to circumvent endosome entrapment. Int J Pharm. 2022;626:122153. doi: 10.1016/j.ijpharm.2022.122153.
- Fulton M, Najahi-Missaoui W. Liposomes in cancer therapy: how did we start and where are we now. Int J Mol Sci. 2023;24(7):6615. doi: 10.3390/ijms24076615.
- Rossi F, Noren H, Jove R, et al. Differences and similarities between cancer and somatic stem cells: therapeutic implications. Stem Cell Res Ther. 2020;11(1):489. doi: 10.1186/s13287-020-02018-6.
- Qian L, Su H, Wang G, et al. Anti-tumor activity of bufalin by inhibiting c-MET mediated MEK/ERK and PI3K/AKT signaling pathways in gallbladder cancer. J Cancer. 2020;11(11):3114–3123. doi: 10.7150/jca.38393.
- Bandyopadhyay A, Wang L, Agyin J, et al. Doxorubicin in combination with a small TGFβ inhibitor: a potential novel therapy for metastatic breast cancer in mouse models. PLOS One. 2010;5(4):e10365. doi: 10.1371/journal.pone.0010365.
- Novikov N, Zolotaryova S, Gautreau A, et al. Mutational drivers of cancer cell migration and invasion. Br J Cancer. 2021;124(1):102–114. doi: 10.1038/s41416-020-01149-0.
- Rodriguez-Torres M, Allan AL. Aldehyde dehydrogenase as a marker and functional mediator of metastasis in solid tumors. Clin Exp Metastasis. 2016;33(1):97–113. doi: 10.1007/s10585-015-9755-9.
- Wu J. S, Jiang J, Chen B. J, et al. Plasticity of cancer cell invasion: patterns and mechanisms. Transl Oncol. 2021;14(1):100899. doi: 10.1016/j.tranon.2020.100899.
- Karnoub A, Dash A, Vo A, et al. Mesenchymal stem cells within tumour stroma promote breast cancer metastasis. Nature. 2007;449(7162):557–563. doi: 10.1038/nature06188.