
ABSTRACT
Implementation of the Shewhart, CUSUM, and EWMA charts requires estimates of the in-control process parameters. Many researchers have shown that estimation error strongly influences the performance of these charts. However, a given amount of estimation error may differ in effect across charts. Therefore, we perform a pairwise comparison of the effect of estimation error across these charts. We conclude that the Shewhart chart is more strongly affected by estimation error than the CUSUM and EWMA charts. Furthermore, we show that the general belief that the CUSUM and EWMA charts have similar performance no longer holds under estimated parameters.
Introduction
The Shewhart chart is known for its ease of implementation and its ability to detect large process shifts. A major disadvantage of a Shewhart chart is that it is relatively insensitive to small process shifts. Two well-known and effective alternatives to the Shewhart chart for detecting small sustained shifts are the cumulative sum (CUSUM) chart and the exponentially weighted moving average (EWMA) chart (Montgomery Citation2013). Recently, Hawkins and Wu (Citation2014) compared these two charts and concluded that depending on the shift size either the CUSUM chart or the EWMA chart can provide quicker detection. The general consensus seems to be that the performance of the CUSUM and the EWMA charts is quite similar.
Most comparison studies, as the ones by Lucas and Saccucci (Citation1990) and Hawkins and Wu (Citation2014), are based on the assumption of known in-control process parameters. However, the implementation of control charts requires the estimates of in-control process parameters, obtained from an initial Phase I sample. The performance of a control chart based on Phase I estimates will be conditional on the Phase I sample obtained. Hence, control charts will show varying performance in Phase II, depending on the obtained Phase I sample.
We study the effect of baseline (Phase I) data on the ongoing monitoring performed in Phase II. We assume that the Phase I data come from a stable process. We do not discount in any way, however, the importance of Phase I. In fact, Phase I investigations can be more informative and more likely to lead to process improvement than the monitoring done in Phase II. Jones-Farmer et al. (Citation2014) and Woodall (Citation2016) discussed some of the issues and methods associated with Phase I data collection and analysis. It is interesting to note that the focus of Shewhart (Citation1939) was on Phase I analysis, not Phase II.
The effect of Phase I estimation on the performance of control charts has received a great deal of attention in the literature. For two reviews on this topic, see Jensen et al. (Citation2006) and Psarakis, Vyniou, and Castagliola (Citation2014). The general conclusion is that the use of parameter estimates results in control charts with less predictable performance than those with known parameters. For the effect of estimation error on the Shewhart chart see, for example, Saleh et al. (Citation2015b). For the effect of estimation error on the CUSUM chart see, for example, Gandy and Kvaløy (Citation2013) or Saleh et al. (Citation2016). For the effect of estimation error on the EWMA chart see, for example, Jones, Champ, and Rigdon (Citation2001) or Saleh et al. (Citation2015a). Although many studies have been conducted to evaluate the effect of estimation error on a specific control chart, none have compared the effect of estimation error across these three types of charts.
In this article, we compare the effect of estimation error across the Shewhart, CUSUM, and EWMA control charts. It is well known that estimation error strongly influences the performance of these control charts individually. However, the question that we address is how the effect of a given amount of estimation error differs across the Shewhart, CUSUM, and EWMA control charts. We study this question by considering both the overall (marginal) as well as the conditional ARL performance. We study the in-control conditional average run length (ARL) performance of control charts in Phase II, conditioning on the Phase I in-control parameter estimates. This metric should be distinguished from the conditional expected delay (CED) metric for which the conditioning is on a process shift occurring at a particular time in Phase II. For more information on the CED, see Fraker, Woodall, and Mousavi (Citation2008) or Kenett and Pollack (Citation2012). In our article we consider only in-control Phase II performance.
In this article, we show that the similarity in in-control Phase II performance of the CUSUM and EWMA chart under known parameters does not hold under estimated parameters.
Defining the Shewhart, CUSUM, and EWMA control charts
Throughout, we assume the process observations to be independent and normally distributed with in-control mean μ0 and in-control standard deviation σ0. We observe the process in samples of size n ⩾ 1 and denote the sample mean at time i by . For ease of comparison, we denote the information from the process at time i of Phase II by the standardized value
[1] where
and
are the estimates of the in-control process parameters μ0 and σ0, respectively. These estimates are computed from a Phase I sample of m subgroups of n observations. Considerable work has been published on appropriate estimators for Phase I. In the case of Shewhart charts, see for example, Schoonhoven et al. (Citation2011); for the CUSUM chart, see Nazir et al. (Citation2013); and for the EWMA chart, see Zwetsloot, Schoonhoven, and Does (Citation2014). Furthermore, Mahmoud et al. (Citation2010) provided an overview and comparison of estimators for the standard deviation. Here we use, as estimator for μ0, the overall sample mean based on the Phase I data defined by
[2]
As an estimator for σ0 we use the moving range estimator if n = 1
[3] while if n > 1, we use the pooled sample standard deviation as estimator for σ0:
[4] Here, S2i is the i-th Phase I sample variance and c4(.) is a control charting constant which can be found in Montgomery (Citation2013) and elsewhere. In our simulation study, we assume in-control Phase I samples so we do not have to consider robustness issues.
To monitor the process mean, first consider the Shewhart chart, which is set up by plotting Yi together with upper control limit C and lower control limit − C. Here, C > 0 is a constant set such that the chart yields a pre-specified in-control performance when the in-control process parameter values are assumed to be known. Whenever Yi > C or Yi < − C the chart signals an out-of-control sample.
An alternative for monitoring the mean is the two-sided CUSUM chart. This chart, for detecting both increases and decreases in the process mean, consists of plotting two statistics simultaneously: C+i = max (0, Ci − 1+ + Yi − K) and C−i = max (0, Ci − 1− + Yi + K). As starting values we set C+0 = C0− = 0. The reference value, K, is often set equal to one-half the size of the smallest mean shift, measured in units of the standard error, required to be detected quickly (Hawkins and Wu Citation2014). An out-of-control condition is signalled if C+i > H or C−i < −H.
The EWMA chart consists of plotting the exponentially weighted moving average at sampling stage i defined as Zi = (1 − λ) Zi − 1 + λYi, where 0 < λ ⩽ 1 is a smoothing constant and depends on the shift size required to be detected quickly. The starting value Z0 is set equal to 0 in our paper. The EWMA chart gives a signal whenever Zi falls outside of the control limits . These are the so-called asymptotic control limits. For the difference in performance with the limits based on the exact standard error, the reader is referred to Steiner (Citation1999).
Before these charts can be implemented several design decisions have to be made. First, the CUSUM and EWMA charts should be tuned, by setting K and λ, to detect a specific shift size. We tune the CUSUM and EWMA to detect shifts of one standard error quickly. For the CUSUM chart this implies that K = 0.5. For the EWMA chart, if a shift of one standard error needs to be detected, λ = 0.1 is a commonly used value.
The in-control average run length, ARL0, was set at 200, a widely used choice. Assuming known process parameters implies that for the Shewhart chart , where Φ− 1(.) is the inverse of the cumulative distribution function of the standard normal distribution. For the CUSUM chart we obtain H = 4.17 and for the EWMA chart we set L = 2.454. Both values were obtained with the package spc in R, see Knoth (Citation2014), using the functions “xcusum.crit(0.5, 200, sided = “two”)” and “xewma.crit(0.1,200, sided = “two”)”.
Performance measures
In this article we are interested in the difference in performance of the Shewhart, CUSUM, and EWMA chart when the charts are set up based on estimated parameters. We compare the charts when they are employed to monitor a stable process. Hence, we are interested in the frequency of false alarms, i.e., in the performance under in-control data. For control charts based on known process parameters this in-control performance can be controlled and remains constant. However for charts based on estimated parameters the in-control performance becomes a random variable dependent on the Phase I sample. Therefore, we are also interested in how the performance depends on the Phase I estimates obtained.
Throughout this article we evaluate performance with the commonly used average run length (ARL). The in-control ARL equals the average number of plotted statistics before the chart signals (a false alarm). We distinguish between the conditional ARL and the marginal or average ARL, as the ARL is a random variable.
The conditional ARL is defined as the average run length conditional on a specific Phase I sample. From this sample, parameter estimates are obtained according to Eqs. [Equation2[2] ]–[Equation4
[4] ]. Based on these estimates the control charts can be set up and their performance can be evaluated. This conditional ARL level will be different for each Phase I sample. Recently, many researchers have referred to this estimation error due to sampling error as practitioner-to-practitioner variability. To obtain an overall performance measure, independent of the Phase I sample used, we will use the average of the conditional ARLs, the AARL, averaging across the Phase I sampling error. In order to also capture the variability in the conditional ARL levels we also estimate the standard deviation of the conditional ARL values, the SDARL.
Of course, different metrics can be used to operationalize the performance of control charts. Various performance metrics, such as the ARL and the conditional expected delay, have been proposed in the literature. One distinction that is made is the difference between active and passive monitoring. Active monitoring implies taking action on the process and resetting the monitoring statistic after a signal and hence ARL is a relevant metric. In passive monitoring actions to affect the process are less immediate and effective and the monitoring statistic is not reset after a signal (see, e.g., in public health surveillance). For an elaborate discussion see Frisén (Citation2003) or Kenett and Pollak (Citation2012). Throughout this article, we focus on the time until the first false alarm under the assumption of a stable process. We do not consider what happens after an alarm. Hence, the average time until a false alarm, as measured by the in-control ARL, is a suitable metric to evaluate performance.
Simulation method
In order to compute the conditional ARL, the AARL, and the SDARL, it is helpful to rewrite EquationEq. [1][1] as in Jones, Champ, and Rigdon (Citation2001), i.e.,
[5] where
, is the standardized Phase II sample mean at time i. The random variable
is the ratio of the estimated in-control standard deviation, as defined in Eqs. [Equation3
[3] ] and [Equation4
[4] ], to the actual in-control standard deviation. The random variable
is the standardized difference between the estimated in-control mean, as defined in EquationEq. [2]
[2] , and the actual in-control mean. The random variables Z and Q reflect the precision of the Phase I estimates of the mean and standard deviation, respectively.
Computation of the conditional ARL for the Shewhart chart is straightforward; it is equal to the reciprocal of the probability of a signal given the realizations of Z and Q. For the CUSUM and EWMA charts the conditional ARL values are computed with a Markov chain approximation, for details see Saleh et al. (Citation2016, Appendix A) and Saleh et al. (Citation2015a, Appendix A). We used 201 states for each Markov chain. Conditional ARL values were obtained for 50,000 Phase I estimates each based on m = 50 and 100 subgroups of size n = 1 and n = 5 from N(μ0, σ0), where we set μ0 = 0 and σ0 = 1 without loss of generality. To obtain the AARL and SDARL metrics, integral equations were set up and approximated using numerical integration. The functional forms of these equations can be found in Saleh et al. (Citation2015b, Appendix A), Saleh et al. (Citation2016, Appendix B), and Saleh et al. (Citation2015a, Appendix A) for the Shewhart, CUSUM, and EWMA charts, respectively. Furthermore, the functional form for the probability density function of EquationEq. [3][3] was obtained from Goedhart, Schoonhoven, and Does (Citation2016). The results were validated with a Monte Carlo simulation study. We recommend the reader, however, to use the package SPC in R of Knoth (Citation2014) to perform similar ARL analysis when that is applicable.
Overall and conditional performance comparison
shows the AARL and SDARL values for the three charts for ARL0 = 200, for m = 50 and m = 100, and for n = 1 and n = 5. Furthermore, shows boxplots of the conditional in-control ARL values for the three charts based on Phase I estimates for m = 50 samples of size n = 1 and 5.
Table 1. In-control AARL and SDARL values for the three charts based on estimated parameters when m subgroups of size n are used in Phase I.
Figure 1. Conditional in-control ARL distribution for the three control charts based on estimated parameters when m = 50 subgroups of size n are used. The boxplots show 5th, 10th, 25th, 50th, 75th, 90th, and 95th percentiles.
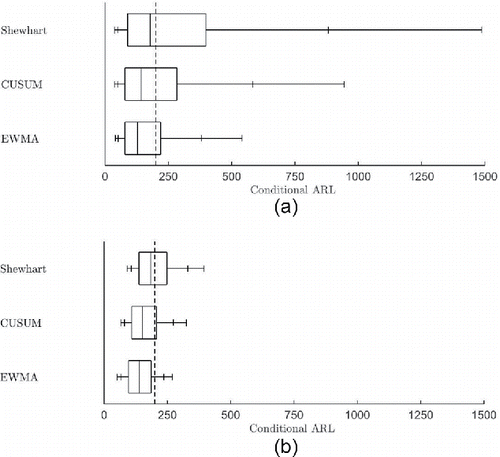
First consider the Shewhart chart. In , the AARL values are above the pre-specified ARL0 value of 200, although, as expected, the difference is smaller for n = 5 than for n = 1. This shows that more data in Phase I implies better estimates which leads to performance closer to the desired in-control ARL value. The SDARL values for the Shewhart chart show that the effect of sampling variability is large. Especially for n = 1 the SDARL values are very large; ranging from 66 for m = 100 and n = 5 to 1362 for m = 50 and n = 1. This difference is confirmed by the boxplots in ; for n = 1 the boxplot is a lot wider than for n = 5. From and it is clear that more data in Phase I decreases the sampling variability; the SDARL value is a lot larger for n = 1 than for n = 5.
Next, consider the CUSUM chart. In , the AARL values are larger than the desired value for n = 1. However, they are smaller for n = 5. This surprising result was also discussed in Saleh et al. (Citation2016). The SDARL values are smaller for the CUSUM chart than for the Shewhart chart. Hence there is less variability in the conditional performance of the CUSUM chart than for the Shewhart chart. This is confirmed in where the boxplot for the CUSUM chart is more narrow than for the Shewhart chart.
Finally, consider the EWMA chart. It has the lowest AARL values compared to the other two charts. It also has the smallest variability in the in-control performance as the SDARL values are the smallest and the corresponding boxplots in are the most narrow compared to the Shewhart and CUSUM charts.
Comparing the CUSUM and EWMA charts, shows that these two charts have quite different conditional ARL distributions. The variability for the CUSUM chart is larger than for the EWMA chart, especially when n = 1. This is also reflected in the AARL and SDARL metrics as presented in . Note that this difference in SDARL values is partly explained by the increase in AARL values.
The CUSUM and EWMA charts have been compared, with most researchers concluding that these charts have similar performance. See, for example, Hawkins and Wu (Citation2014). Although this is true for known process parameters, we have shown that this conclusion does not translate to charts based on estimated parameters when small sample sizes are used in Phase I.
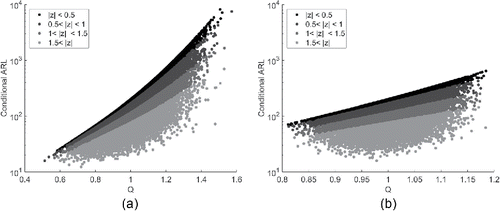
To obtain a better understanding of the difference in the AARL and SDARL metrics, we studied the conditional performance of the three charts. –show the conditional ARL values vs. the standardized Phase I value Q for each of the three charts. We show the case of n = 1 in panels (a) and n = 5 in panels (b). For readability the y-axis is on a logarithmic scale. Furthermore, panels are categorized by the error in the mean estimate (Z).
Figure 2. Conditional in-control ARL of the Shewhart chart vs. Q based on m = 50 samples of size n. Chart is designed to have ARL0 = 200 under known parameters.
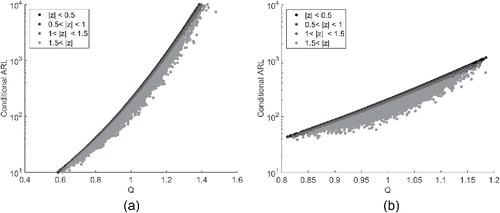
Unsurprisingly, the higher the value of Q the larger the in-control ARL value will be for each of the three charts. Note that the x-axis has a different scale for n = 5 than for n = 1 because the value for Q will lie closer to 1 as more data are available in Phase I.
Perhaps more surprising, the Shewhart chart's conditional ARL is primarily determined by the value of Q; the value of Z has nearly no influence on the conditional in-control ARL. Contrarily, for the CUSUM and EWMA chart the value of Z does have an influence on the conditional ARL. The larger the error in the mean estimate, the lower the conditional ARL will be. Intuitively, as the CUSUM and EWMA charts are designed to detect small changes in the location parameter, a small error in the estimate of the mean will have a greater impact in lowering the in-control ARL value.
Pairwise comparison of the conditional performance
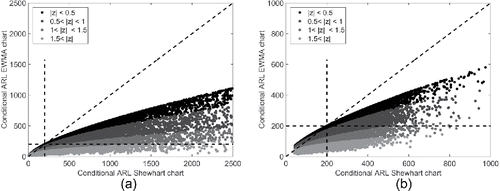
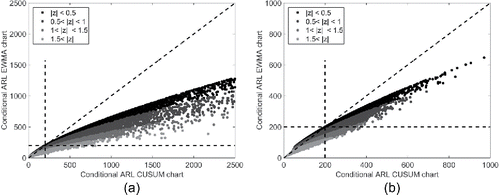
In order to compare the conditional performance head-to-head across the three charts, we plotted conditional ARL results pairwise. – show these results. Each figure is a pair-wise comparison of two control charts, categorized by the error in the mean estimate (Z). The dotted lines show the diagonal for reference as well as the ARL0 = 200 line. If the effect of estimation error were the same for two charts, all values would lie along the diagonal. Note that the x-axis has a different scale for n = 1 and n = 5.
shows the conditional ARL values of the Shewhart chart vs. the conditional ARL values of the CUSUM chart. Each dot in the scatter plot represents a Phase I sample (i.e., combination of Z and Q). The first apparent feature of is that nearly all Phase I samples result in a Shewhart control chart which has a higher ARL value than the corresponding CUSUM chart, even though both are based on the same Phase I estimates. Furthermore, shows a smooth edge on the top of the point cloud. This represents the case where the mean is estimated most precisely (Z = 0). That this line runs from the left bottom to the top right shows that both the Shewhart and CUSUM chart have very variable ARL values. Therefore, a large part of the variability in the ARL values must be caused by the value Q (the error of the standard deviation estimator). This was already evident in and . Furthermore, the difference in performance between the Shewhart and CUSUM chart is caused to a larger extent by the value of Z. For Z = 0 the two charts have nearly equivalent conditional ARL values. For Z > 0 the conditional ARL of the CUSUM chart decreases compared to the conditional ARL of the Shewhart chart. This is unsurprising as the CUSUM chart is designed to detect small sustained changes in the mean, and an error in the estimate of the in-control mean value will be detected as a shift in the mean.
Figure 3. Conditional in-control ARL of the CUSUM chart vs. Q based on m = 50 samples of size n. Chart is designed to have ARL0 = 200 under known parameters.
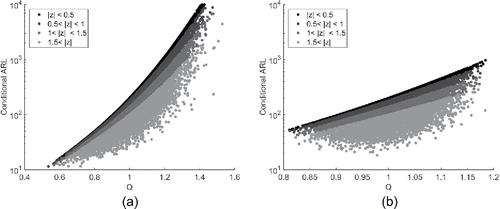
Figure 4. Conditional in-control ARL of the EWMA chart vs. Q based on m = 50 samples of size n. Chart is designed to have ARL0 = 200 under known parameters.
shows the conditional ARL performance of the Shewhart chart vs. the EWMA chart. This comparison shows a similar pattern to . An apparent difference is that the conditional ARL of the EWMA chart stays a little lower; it only runs up to 1,000 for n = 1 and 700 for n = 5. While the Shewhart chart in-control ARL values go up to 2,500 and 1,000, respectively. As the desired value is ARL0 = 200, the EWMA chart shows performance which lies closer to this pre-specified value.
Figure 5. Conditional in-control ARL of the CUSUM chart vs. the Shewhart chart. Both charts are based on estimated parameters when m = 50 subgroups of size n are used.
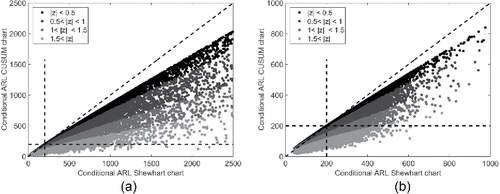
Figure 6. Conditional in-control ARL of the EWMA chart vs. the Shewhart chart. Both charts are based on estimated parameters when m = 50 subgroups of size n are used.
Perhaps more surprising are the results displayed in . This figure shows that the CUSUM charts have ARL values which are nearly always substantially higher than those of the corresponding EWMA charts. The EWMA chart ARL values therefore tend to be closer to the desired value of ARL0 than the CUSUM chart. For n = 5 this effect is a little smaller than for n = 1.
Figure 7. Conditional in-control ARL of the EWMA chart vs. the CUSUM chart. Both charts are based on estimated parameters when m = 50 subgroups of size n are used.
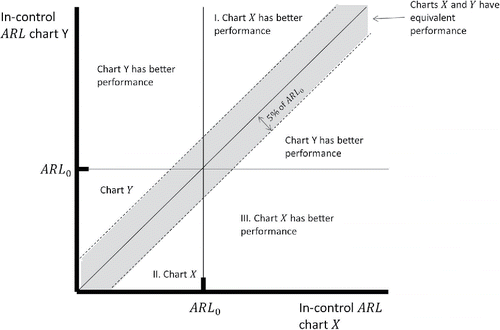
To determine that the conditional in-control ARL performance of the one type of chart is better than the other type of chart, we first need a definition of what we mean by “better performance”. As starting point we take that in-control performance should be close to the desired level ARL0. Hence, a control chart with an in-control ARL = 300 performance is better than a chart with an in-control ARL = 400, given that the desired value is ARL0 = 200. A chart with an ARL = 150 shows better performance than a chart with an ARL = 100. Furthermore, given that one chart has an ARL above the desired level ARL0 and the other is below ARL0, the former shows better performance in order to avoid an unacceptable rate of false alarms. Apart from defining better and worse, it is also important to consider equivalent performance. Obviously two charts have (near) equivalent performance whenever their conditional ARL values lie very close together. To operationalize ‘close together’ we set a somewhat arbitrarily selected difference of 5%*ARL0 as a neglectable difference. This leads to the definition featured next.
Definition 1: Better conditional performance
Denote by ARLX(z, q) the conditional in-control ARL of control chart X based on Phase I estimates (z, q) and by ARLY(z, q) the conditional in-control ARL of control chart Y based on Phase I estimates (z, q). We define the performance of chart X as equivalent to the performance of chart Y, iff
Otherwise, we define the performance of chart X as better than the performance of chart Y, iff
| I. | ARLX(z, q) < ARLY(z, q) when ARLX(z, q) > ARL0 and ARLY(z, q) > ARL0 | ||||
| II. | ARLX(z, q) > ARLY(z, q) when ARLX(z, q) < ARL0 and ARLY(z, q) < ARL0 | ||||
| III. | ARLX(z, q) > ARL0 and ARLY(z, q) < ARL0 | ||||
illustrates this definition by showing the in-control ARL of chart X on the horizontal axis and the in-control ARL of chart Y on the vertical axis. In the graph all regions are marked according to the above definition.
Figure 8. Illustration of Definition 1.
Using this definition it is possible to qualify a chart's performance as better, equivalent, or worse than another chart's performance. Tables and show the percentages of charts (from the 50,000 simulation runs) that fall into the regions as indicated in , i.e., giving the percentage of charts with performance equivalent, better, or worse, compared to the chart in the columns. From it is clear that the Shewhart chart shows equivalent performance to the CUSUM chart for 37.6% of the obtained Phase I estimates when PhaseI consists of m = 50 samples of size n = 1. Generally, the CUSUM and EWMA charts have better overall performance than the Shewhart chart when n = 1 and worse when n = 5. The CUSUM chart has better performance than the EWMA chart when n = 1 and worse performance when n = 5.
Percentage of Shewhart charts according to the conditional ARL performance compared to CUSUM and EWMA chart.
Table 3. Percentage of CUSUM charts according to the conditional ARL performance compared to the EWMA chart.
Previous comparison studies of the EWMA and CUSUM charts based on the assumption of known parameters have all shown near equivalent performance for the two charts. and show that this is a strong assumption and that under estimated parameters the CUSUM chart often has ARL values that are considerably larger than the pre-specified ARL compared to the ARL values of the EWMA chart, for the same Phase I data. The percentage of CUSUM charts with a worse performance than the EWMA chart is 45.3% for n = 1 and decreases to 23.7% for n = 5. The sample size n in Phase I influences considerately the effect of estimation error on the relative Phase II performance.
Discussion
The choice of λ and K influences the effect of estimation error on the in-control performance. The smaller the shift size for which the charts are tuned, the more likely the chart is to react to estimation error in the mean. Generally, the EWMA chart has lower ARL values than the CUSUM chart for shift sizes smaller than the shift size for which both are designed to detect quickly (Lucas and Saccucci Citation1990). Furthermore, as we have set λ = 0.1 it is tuned to detect a slightly smaller shift that the CUSUM chart with K = 0.5 (Hawkins and Wu Citation2014). Therefore, the difference in effect of estimation error could be influenced to some extent by this choice.
In this study we have only considered single estimators for μ0 and for σ0. For other estimators the patterns in conditional ARLs could be somewhat different, although we have no reason to suspect that this choice influences the general conclusions. Furthermore, the effect of estimation will become smaller as more data become available in Phase I.
Conclusion
The effect of Phase I parameter estimation on control charts is known to be significant. Generally it can lead to more frequent false alarms and a loss in the ability to detect shifts quickly. This is well documented in the literature for the Shewhart, CUSUM, and EWMA control charts separately. Our work has evaluated and compared the effect of estimation across these three charts by evaluating the conditional in-control performance for all charts pairwise for a specific set of Phase I estimates.
Our simulation study showed that the effect of estimated parameters on performance variation is a lot larger for the Shewhart chart than for the CUSUM or EWMA charts. However, somewhat unexpectedly, it also shows that the EWMA and CUSUM charts behave quite differently. The conditional in-control ARL of the CUSUM chart is generally higher than the conditional in-control ARL of the EWMA chart. Furthermore, the relative performance depends on the sample size in Phase I. We believe that in comparing control charts and control chart performance, it is advisable to consider the conditional performance.
About the authors
Inez M. Zwetsloot is a consultant in statistics and Lean Six Sigma at IBIS UvA and assistant professor at the Department of Operations Management. Her research focusses on statistical process monitoring.
William H. Woodall is a Professor in the Department of Statistics at Virginia Tech. He is a former editor of the Journal of Quality Technology (2001–2003) and associate editor of Technometrics (1987–1995). He is the recipient of the Box Medal (2012), Shewhart Medal (2002), Jack Youden Prize (1995, 2003), and Brumbaugh Award (2000, 2006). He is a Fellow of the American Statistical Association, a Fellow of the American Society for Quality, and an elected member of the International Statistical Institute.
Acknowledgments
The authors are grateful to the editor and the reviewers for their constructive comments and suggestions. These have significantly improved the final paper.
Funding
The work of William H. Woodall was partially supported by National Science Foundation Grant # CMMI-1436365.
References
- Fraker, S. E., W. H. Woodall, and S. Mousavi. 2008. Performance metrics for surveillance schemes. Quality Engineering 20 (4):451–464.
- Frisén, M. 2003. Statistical surveillance. Optimality and methods. International Statistical Review 71 (2):403–334.
- Gandy, A., and J. T. Kvaløy. 2013. Guaranteed conditional performance of control charts via bootstrap methods. Scandinavian Journal of Statistics 40 (4):647–668.
- Goedhart, R., M. Schoonhoven, and R. J. M. M. Does. 2016. Guaranteed in-control performance for the Shewhart X and control charts. Journal of Quality Technology, to appear.
- Hawkins, D. M., and Q. Wu. 2014. The CUSUM and the EWMA Head-to-Head. Quality Engineering 26 (2):215–222.
- Jensen, W. A., L. A. Jones-Farmer, C. W. Champ, and W. H. Woodall. 2006. Effects of parameter estimation on control chart properties: A literature review. Journal of Quality Technology 38 (4):349–364.
- Jones, L. A., C. W. Champ, and S. E. Rigdon. 2001. The performance of exponentially weighted moving average charts with estimated parameters. Technometrics 43 (2):156–167.
- Jones-Farmer, L. A., W. H. Woodall, S. H. Steiner, and C. W. Champ. 2014. An overview of phase I analysis for process improvement and monitoring. Journal of Quality Technology 46 (3): 265–280.
- Kenett, R. S., and M. Pollak. 2012 On assessing the performance of sequential procedures for detecting a change. Quality and Reliability Engineering 28 (5):500–507
- Knoth, S. 2014. SPC: Statistical process control—collection of some useful functions. R package version 3.2.2.
- Lucas, J. M., and M. S. Saccucci. 1990. Exponentially weighted moving average control schemes: Properties and enhancements. Technometrics 32 (1):1–12.
- Mahmoud, M. A., G. R. Henderson, E. K. Epprecht, and W. H. Woodall. 2010. Estimating the standard deviation in quality-control applications. Journal of Quality Technology 42 (4):348–357.
- Montgomery, D. C. 2013. Introduction to statistical quality control. 7th ed. Hoboken, NJ: John Wiley & Sons.
- Nazir, H. Z., M. Riaz, R. J. M. M. Does, and N. Abbas. 2013. Robust CUSUM control charting. Quality Engineering 25 (3):211–224.
- Psarakis, S., A. K. Vyniou, and P. Castagliola. 2014. Some recent developments on the effects of parameter estimation on control charts. Quality and Reliability Engineering International 30 (8):1113–1129.
- Saleh, N. A., M. A. Mahmoud, L. A. Jones-Farmer, I. M. Zwetsloot, and W. H. Woodall. 2015a. Another look at the EWMA control chart with estimated parameters. Journal of Quality Technology 47 (4):363–382.
- Saleh, N. A., M. A. Mahmoud, M. J. Keefe, and W. H. Woodall. 2015b. The difficulty in designing Shewhart and X control charts with estimated parameters. Journal of Quality Technology 47 (2):127–138.
- Saleh, N. A., I. M. Zwetsloot, M. A. Mahmoud, and W. H. Woodall. 2016. CUSUM charts with controlled conditional performance under estimated parameters. Quality Engineering 48 (4):402–415.
- Schoonhoven, M., H. Z. Nazir, M. Riaz, and R. J. M. M. Does. 2011. Robust location estimators for the control chart. Journal of Quality Technology 43 (4):363–379.
- Shewhart, W. A. 1939. Statistical method from the viewpoint of quality control. Washington, D. C.: Graduate School of the Department of Agriculture (Republished in 1986 by Dover Publications, Inc., Mineola, NY.)
- Steiner, S. H. 1999. Exponentially weighted moving average control charts with time-varying control limits and fast initial response. Journal of Quality Technology 31 (1):75–86.
- Woodall, W. H. 2016. Bridging the gap between theory and practice in basic statistical process monitoring. To appear in Quality Engineering.
- Zwetsloot, I. M., M. Schoonhoven, and R. J. M. M. Does. 2014. A robust estimator of location in phase I based on an EWMA chart. Journal of Quality Technology 46 (4):302–316.