ABSTRACT
Shewhart control charts are among the most popular control charts used to monitor process dispersion. To base these control charts on the assumption of known in-control process parameters is often unrealistic. In practice, estimates are used to construct the control charts and this has substantial consequences for the in-control and out-of-control chart performance. The effects are especially severe when the number of Phase I subgroups used to estimate the unknown process dispersion is small. Typically, recommendations are to use around 30 subgroups of size 5 each.
We derive and tabulate new corrected charting constants that should be used to construct the estimated probability limits of the Phase II Shewhart dispersion (e.g., range and standard deviation) control charts for a given number of Phase I subgroups, subgroup size and nominal in-control average run-length (ICARL). These control limits account for the effects of parameter estimation. Two approaches are used to find the new charting constants, a numerical and an analytic approach, which give similar results. It is seen that the corrected probability limits based charts achieve the desired nominal ICARL performance, but the out-of-control average run-length performance deteriorate when both the size of the shift and the number of Phase I subgroups are small. This is the price one must pay while accounting for the effects of parameter estimation so that the in-control performance is as advertised. An illustration using real-life data is provided along with a summary and recommendations.
Introduction and motivation
The two-sided Shewhart R (sample range) and S (sample standard deviation) control charts are widely used to monitor the process dispersion. In practice, the in-control standard deviation value is usually not known. Then these charts are applied with estimated control limits, where the parameter estimates are obtained from Phase I reference data. When applying these charts, it is common to use the 3-sigma limits, given in most textbooks (Montgomery Citation2013), where a tabulation of the necessary chart constants can be found. The use of the standard 3-sigma limits is justified on the basis that the distribution of the charting statistic is normal or approximately normal. However, the charting statistics of the R and S charts are highly skewed. As a result, the performance of these charts can be quite questionable, particularly for smaller sample sizes typical in practice. To the best of our knowledge the performances of these charts have not been fully examined in the literature. But, these charts are critical in practical SPC applications since they are the most popular dispersion charts that are used in Phase II for keeping the process dispersion under control, before the location charts are constructed (which need an estimate of the process dispersion) and meaningfully interpreted.
To look more closely into the issues we derive the expressions for the unconditional in-control average run-length (ICARL) of the R and S charts (Montgomery Citation2013), which are based on 3-sigma limits and the assumption of a normal distribution, using the conditioning-unconditioning method (Chen Citation1998 and Chakraborti Citation2000), and evaluate them using the statistical software R. The evaluations are done for various values of the number of reference subgroups m, subgroup size n = 5,10, and nominal in-control average run-length (ICARL0) equal to 370. The results are shown in , where denotes the relative percentage difference between the ICARL and the nominal in-control average run-length (ICARL0), which is equal to 370.
Table 1. The ICARL and PD values for the estimated 3-sigma limits of the two-sided Phase II dispersion charts; for n = 5,10; ICARL0 = 370, and various values of m.
Let us consider first the R chart. This chart uses the average range estimator for the unknown in-control standard deviation (σ0), where d2(n) is the unbiasing constant assuming the normal distribution (Montgomery Citation2013) and
is calculated from the m independent Phase I subgroup ranges R1, R2, …, Rm. For n = 5, in , it can be seen that the ICARL values differ substantially from the nominal value, as the absolute PD values range from 10 (for m = 30) to 1161 (for m = 5). Note that a PD value greater (or smaller) than zero indicates that the ICARL value is greater (or smaller) than the nominal value 370. Both cases are undesirable. It can also be observed that for m ⩾ 30, the PD values are negative, which means that increasing the number of reference subgroups m exacerbates the false alarm rate (FAR). Similar results are found for the S chart that uses the Phase I estimator
, where c4(n) is the unbiasing constant assuming the normal distribution (Montgomery Citation2013) and the S chart that uses the “pooled” estimator
, respectively, where S1, S2, …, Sm denote the standard deviations of the m Phase I reference subgroups. Note that the “pooled” estimator is not an unbiased estimator of σ0. We use this estimator because the unbiasing constant c4(m(n − 1) + 1) is already 0.9876 when m, n = 5, and it gets even closer to 1 as m and or n increase (0.9975 for m = 25 and n = 5). Therefore, for all practical purposes this constant is indistinguishable from 1 and hence it is sufficient to use the estimator Sp. The reader is also referred to Mahmoud et al. (Citation2010), where Sp and Sp/c4(m(n − 1) + 1) are compared and shown to be practically equal in terms of their probability distributions and mean squared error (MSE). For n = 10, in , the PD values are somewhat better than their counterparts for n = 5, but they are still unacceptable.
Based on these results, the standard estimated 3-sigma charts for dispersion cannot be recommended to monitor the dispersion in practice. This is an issue for anyone who uses these control limits available in most textbooks (Montgomery Citation2013). In fact, most of the commercial software seem to use these same (incorrect) limits. An alternative approach is to use probability limits instead of the classical 3-sigma limits (Diko, Chakraborti, and Graham Citation2016). This mitigates this issue, but does not solve it entirely. Indeed, Montgomery (Citation2013) mentions the use of probability limits and refers to some tables in Grant and Leavenworth (Citation1986), but it is not clear whether or not these probability limits are commonly used in practice. Woodall (Citation2017) advocates the use of probability limits for the dispersion control charts. For a specified nominal FAR (denoted by α = α0) such as 0.0027 or ICARL0 = 370, the probability limits may be constructed using the exact distribution of the charting statistic. This will be discussed in more detail later. As an example, shows the ICARL and the PD values for the two sided R and the S charts with the estimated probability limits, for various values of m, n = 5, 10 and ICARL0 = 370.
Table 2. The ICARL and PD values for the two-sided Phase II R and S charts with estimated probability limits for various values of m; n = 5, 10; and ICARL0 = 370.
It can be seen that now the PD values range from −29 to 0 and −32 to −1 for n = 5 and n = 10, respectively, and they approach zero as m increases, as one might expect (Chen Citation1998). This means that the difference between the ICARL values and the nominal ICARL0 = 370 value is not as bad as what was observed in . It also means that even though the situation has improved over using the 3-sigma limits, unless m is very large, the estimated probability limits may not lead to the desired ICARL0. The other thing to note is that the PD values are remarkably similar for all three estimators.
Thus, from a practical point of view, an important problem still persists. If the number of Phase I subgroups at hand m is small to moderate, even the estimated probability limits of the R and S charts do not quite maintain an advertised nominal in-control average run-length. Hence, for a given nominal ICARL0 and a given amount of Phase I data, this article derives and tabulates new (correct) charting constants, which account for the effects of parameter estimation. We achieve this by setting the ICARL expression equal to some specified nominal value ICARL0 and then evaluating the resulting equation for α = α(m, n). The in-control (IC) and out-of-control (OOC) average run-length performance of the corrected probability limits charts are calculated and compared to the IC and OOC average run-length performance of the uncorrected probability limits.
This article is organized as follows. We begin by describing the classical (uncorrected) 3-sigma limits and probability limits Shewhart control charts for dispersion. Next, we derive new (corrected) control limits based on a numerical and an analytic method. Next, a data set from Montgomery (2013) is used to illustrate and discuss the differences between the corrected and uncorrected control limits. Following this, we evaluate the OOC behavior of the newly proposed probability limits. Finally, a summary and recommendations are provided in the last section.
Classical model for probability limits for the dispersion control charts
Suppose that m subgroups (samples) each of size n are available after a successful Phase I analysis to estimate the unknown parameters and set up the control limits that are to be used in prospective Phase II monitoring. Suppose that the data are from normal distributions and as before, let R1, R2, …, Rm denote the ranges and S1, S2, …., Sm denote the standard deviations of the m Phase I subgroups. As noted earlier, the three commonly used estimators of the unknown in-control process standard deviation σ0 are (i) , based on the average range, (ii)
, based on the average standard deviation, and (iii)
, the pooled estimator.
Thus, using each of the three Phase I estimators above, the three most popular Phase II Shewhart standard deviation charts are (Equation1[1] ) the R chart using the charting statistic Ti1 = Ri with the unbiased estimator
, (Equation2
[2] ) the S chart using the charting statistic Ti2 = Si with the unbiased estimator
and (Equation3
[3] ) the S chart using the charting statistic Ti3 = Si with the estimator
, respectively. Note that for all three of the charts, we let i = m + 1, m + 2, … to emphasize that these are Phase II charts, where prospective monitoring starts from the (m + 1)th sample having collected m Phase I samples. The subscript j = 1, 2, 3 is used to distinguish between the 3 charts. For chart j, we also write the unbiased Phase I estimator
as
, where wj is a biased Phase I estimator based on the charting statistic (i.e.,
, and Sp) and ϵ0j is its corresponding unbiasing constant (with ϵ01 = d2(n), ϵ02 = c4(n), ϵ03 = c4 (m(n − 1) + 1) ≈ 1 shown in Appendix A). Note also that even though Mahmoud et al. (Citation2010) recommended the estimator Sp, we consider all three estimators here for completeness. It also allows us to contrast our results with those that are found in the current literature.
In general, the control limits of the jth Phase II Shewhart chart for the process dispersion, with a charting statistic Tij, can be written as
[1] where Un, α, j and Ln, α, j are charting constants. These charting constants are based on the 100*{1 − α/2}th and the 100*{α/2}th percentiles of the in-control distribution of the Phase II charting statistic Tij, respectively, and are given in Appendix A. Note that for convenience, the constant ϵ0j, that divides wj to form the unbiased estimator, is taken to be a part of each of the charting constants U and L.
Probability limits are based on the in-control distribution of the charting statistic Tij. To this end, note that (i) the in-control distribution of Ti1 = Ri is that of the random variable Wσ, where W is the sample relative range, which has a well-known distribution for a normal population (see for example, Gibbons and Chakraborti, 2010) (ii) the in-control distribution of Ti2 and Ti3 are both that of the random variable , where χ2n − 1 is a chi-square variable with n-1 degrees of freedom.
In the Introduction, we argued that to overcome some of the issues associated with using the R and S charts with the estimated 3-sigma limits, the R and S charts with the estimated probability limits are recommended. In this case, the charting constants, Un, α, j and Ln, α, j are based on the percentiles of the exact distributions of Ri or Si. For the R chart, the charting constants are given by and
, where
and
denote the 100*{1 − α/2}th and the 100*{α/2}th percentiles of the in-control distribution of the sample relative range W, respectively. Given these charting constants plus
, we can find the control limits by substituting them into Ed. [Equation1
[1] ]. Similarly, the estimated probability limits for the S charts (i.e., S2 and S3) are obtained by substituting
and
for S2 and S3, respectively, in Eq. [Equation1
[1] ]. However, these charting constants were originally intended for use with the σ0 known probability limits, and are thus incorporated using the nominal FAR α = α0. Furthermore, they only depend on the Phase II charting statistic, and not on the Phase I estimator or the Phase I sample size. Hence, they are not the appropriate constants in the case that σ0 is unknown. Since these charting constants do not depend on m, they do not properly account for the effect of parameter estimation. In the next section we will correct these charting constants and so their control limits.
The R and S charts with estimated probability limits and corrected for the effects of parameter estimation
To properly account for the effects of parameter estimation while using the Phase II charts, that is, to account for the effects of using m Phase I samples each of size n to estimate the in-control standard deviation σ0, we propose to use the following probability limits
[2]
Note that the above control limits are similar in form to those in Eq. [Equation1[1] ] except that here we denote α as α(m, n) to emphasize that this probability should be a function of both m and n, to make the correct charting constants L and U depend on both of m and n, and thus account for parameter estimation.
In order to find the charting constants, we need to derive an expression for the unconditional in-control average run-length (ICARL). This ICARL depends on the in-control distributions of both the Phase I estimator (wj) and the Phase II charting statistic (Tij). In our derivations, we assume that wj/σ follows a scaled chi-square distribution , where X0j denotes a chi-square random variable with b0j degrees of freedom. Formulae and or values for the constants a0j, b0j and ϵ0j are given in Appendix A, and are based on the well-known Patnaik (Citation1950) approximation (see Chen (Citation1998) for the explicit expressions). Note that conditional on the observed value of the Phase I estimator wj (or equivalently, on the realization of X0j), the conditional in-control (σ = σ0 ) Phase II run-length distribution is geometric. The success probability of this distribution is equal to the conditional false alarm rate (denoted CFAR), which is defined as
[3]
Next, using the conditioning-unconditioning method in Chakraborti (Citation2000), where we integrate over all possible values of X0j, the unconditional ICARL of the jth Phase II Shewhart dispersion chart can be obtained as
[4] where
denotes the probability density function (pdf) of X0j.
We start with the numerical approach, which solves the equation ICARLj(m, n, α(m, n)) = ICARL0 numerically for α(m, n).
The numerical approach
The numerical approach finds α(m, n) numerically and uses it to correct the uncorrected constants in Montgomery (Citation2013) as follows:
| (i) | specifies the values of m, n at hand and the desired nominal ICARL0; | ||||
| (ii) | uses the exact in control distributions of the charting statistics to (Equation1 | ||||
| (iii) | numerically solves the equation | ||||
| (iv) | uses α(m, n) to correct the uncorrected charting constants in Montgomery (Citation2013). | ||||
For example, for the R chart, recall that and
. Consequently, CFAR1 becomes
where
represents the cumulative distribution function (CDF) of the sample relative range. Using this equation to solve
[5] will result in the required corrected charting constants. For example, with m = 5, n = 5, and ICARL0 = 370, the value α(m, n) that satisfies the above equation is 0.001949. This value is then used to correct the uncorrected charting constants for the estimated probability limits Phase II Shewhart R chart. The corrected charting constants for the Phase II R chart with
as Phase I estimator, are given by
and
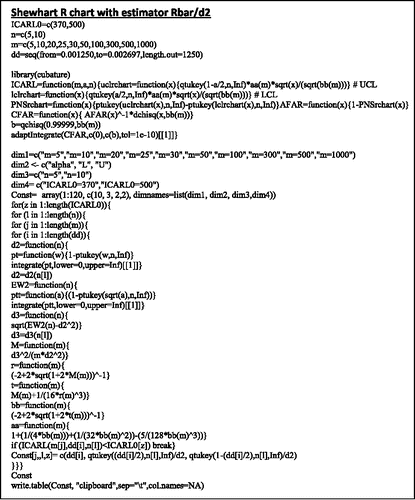
respectively. For other values of n, m and ICARL0, the values of α(m, n), Un, α(m, n), 1 and Ln, α(m, n), 1 are given in . The R codes for finding all these values are given in Appendix B as an example for the other codes used in this article.
Table 3. New corrected charting constants for the Shewhart R and S charts when parameters are estimated from m Phase I subgroups, m = 5, 10, 20, 25, 30, 50, 100, 300, 500 and 1000 each of subgroup size n = 5, 10 for a nominal in-control ARL = 370 and 500.
Similarly, recall that for j = 2 we have and
, and that
. This can be used to calculate CFAR2 as
which can in turn be used to determine the required charting constants. For example, for j = 2, m = 5, n = 5, and ICARL0 = 370, the value of α(m, n) that satisfies Eq. [Equation5
[5] ] is 0.001954. Thus, the corrected charting constants for the Phase II S chart with
as Phase I estimator, are calculated as
And
respectively. For other values of n, m and ICARL0, the values of α(m, n), Un, α(m, n), 2 and Ln, α(m, n), 2 are given in .
Finally, for j = 3 we have and
, and that
. This can be used to calculate CFAR3 as
which can be used to determine the required charting constants for this case. For example, for j = 3, m = 5, n = 5, and ICARL0 = 370, the value α(m, n) that satisfies Eq. [Equation5
[5] ] is 0.001908 Therefore, the corrected charting constants for the Phase II S chart, with
as Phase I estimator, are
and
respectively. Again, gives other values of α(m, n), Un, α(m, n), 3 and Ln, α(m, n), 3 for different combinations of n, m and ICARL0.
From , it is interesting to see that when m increases, as one might expect, the α(m, n), Un, α(m, n), j, and Ln, α(m, n), j values converge to their σ0 known counterparts and
, respectively.
The analytical approach
While the numerical solutions outlined above are useful, it is interesting to consider an approximation to the charting constants based on the recent work of Goedhart, Schoonhoven, and Does (Citation2016) and Goedhart et al. (Citation2017), which is based on a first-order Taylor approximation of the ICARL. The numerical approach of finding α(m, n) involves numerical integration and solving some nonlinear equations. However, it is also possible to find α(m, n) using a more easily implementable but approximate method. Our approach is to:
| (i) | specify the values of m, n at hand and the desired nominal ICARL0; | ||||
| (ii) | unify the control charts for dispersion under one chi-square framework, which assumes that the charting statistic Tij is either exactly or approximately distributed as a scaled chi-square random variable | ||||
| (iii) | use the above chi-square framework to (Equation1 | ||||
| (iv) | obtain an analytical expression for α(m, n); and | ||||
| (v) | use the resulting value of α(m, n) to adjust the uncorrected charting constants. | ||||
Using the approximations in step (ii), we can write CFARj more explicitly as
[6] where
represents the CDF of a chi-square variable with bj degrees of freedom. Consequently, the approximated ICARLj can be calculated as
[7] where
represents the probability density function (PDF) of a chi-square variable with b0j degrees of freedom.
The next step is to determine an analytical expression for α(m, n). In order to do this, we consider a first order Taylor approximation of ICARLj(m, n, α(m, n)), around α0 = 1/ICARL0, where α0 is the nominal FAR as before. This gives the approximation
[8]
Since we want ICARLj(m, n, α(m, n)) = ICARL0, which equals , we solve
[9] for α(m, n). This yields the approximation
[10]
The next step is to determine .
From the obtained equation for ICARLj(m, n, α) it follows that, in order to find its derivative, we need the results
These are obtained using the fact that [G− 1]′ (x) = [G′(G− 1(x))]− 1 , where G and G′ denote the CDF of a continuous random variable and its derivative (the PDF), respectively; G− 1 denotes the inverse of the CDF G and [G− 1]′ denotes the first derivative of G− 1 (see for example, Gibbons and Chakraborti, 2010). Thus, we find
[11]
Where
With this result we have all the pieces required to calculate an approximation to α(m, n) from Eq. [Equation10[10] ]. Once α(m, n) is found, we can again use it to correct the charting constants for the Montgomery probability limits given earlier. The approximate values of α(m, n), Un, α(m, n), j, and Ln, α(m, n), j, for each chart (j = 1,2,3), for different combinations of values of m, n and ICARL0 = 370 and 500 values are tabulated in .
Note that this approximate result is more general than the provided numerical solutions. In fact, it can be generalized to any combination of Phase I and Phase II estimators. This can be done by determining the required constants a, b, a0, and b0 based on the Patnaik (Citation1950) approximation, as described in steps (i) and (ii) of our approach. Moreover, any monotonic increasing function g(σ) of σ can be considered, since in that case P(LCL < Tj < UCL) is equivalent to P(g(LCL) < g(Tj) < g(UCL)). Hence, our approach can also be applied to S2 and log(S) charts.
Comparing the analytical solutions with the numerical solutions it is seen that the approximations from the analytical method are quite accurate and the accuracy increases for higher values of m, as is desirable.
In order to compare the charting constants obtained by the numerical and the analytical methods, we calculated the ICARLj(m, n, α(m, n)) values for each chart, and ICARL0 = 370; n = 5 and for various values of m. shows the results including the PD values relative to 370. As expected, for the numerically calculated probability limits, the ICARL values are exactly equal to the nominal value 370. On the other hand, it can be seen that for the analytically calculated probability limits, except for m = 5, the ICARL values are not more than 6% above the nominal value 370. It can also be seen that as m increases, the ICARL values corresponding to the analytical constants converge quickly to 370. This shows that the behavior of the numerically and analytically corrected probability limits is similar.
Table 4. The ICARL and the PD values for the R and S charts with the charting constants calculated analytically (ANA) and numerical (NUM) for n = 5, ICARL0 = 370 and various values of m.
A numerical illustration
Inthis section, we illustrate the R and S charts with the estimated 3-sigma limits, the uncorrected probability limits and the corrected probability limits given in this article. We use a data set from Montgomery (Citation2013) on the measurements of the flow width of a hard bake process. This is a popular data set used in the literature. It contains m = 25 Phase I subgroups, each of size n = 5 where , and Sp = 0.1390. All the Phase II control limits were constructed to achieve the nominal ICARL0 = 370. , and show the calculated limits of the Phase II R and S charts together with their corresponding charting constants L and U. To examine the effect of the number of Phase I subgroups, these tables also include the case m = 5. The charting constants for the corrected limits have been taken from , while the charting constants for the 3-sigma limits and the uncorrected probability limits have been calculated using their formulas in Appendix A.
Table 5. Charting constants and control limits for the R chart when n = 5; m = 5,25; ICARL0 = 370 and .
Table 6. Charting constants and control limits for the S chart when n = 5; m = 5,25; ICARL0 = 370 and .
Table 7. Charting constants and control limits for the S chart when n = 5; m = 5,25; ICARL0 = 370 and Sp = 0.1390.
For m = 25, it can be seen that the difference, in width, between the uncorrected and the corrected probability limits, is small. This is as expected, since the number of subgroups m = 25 is moderately large, and so it improves the performance of the uncorrected probability limits. In addition to this, it can also be seen that the corrected probability limits are a little wider than the uncorrected probability limits. This can be seen even more clearly from the tables constructed assuming m = 5. Since the problem with uncorrected probability limits is their high unconditional false alarm rate, widening these control limits helps alleviate the problem.
To summarize, the classical estimated 3-sigma limits should not be used in practice, because the normal approximation to the distribution of the sample range and sample standard deviation is poor. Consequently, as seen from , the classical estimated 3-sigma limits cannot detect process improvements (only deterioration; since the lower control limit is set to be equal to 0 for subgroup sizes n ⩽ 6). The uncorrected estimated probability limits can still be used if m is large (say m > 20). However, it is better to use the corrected charting constants proposed in this article, because they guarantee the expected nominal ICARL performance for the value of m and n that one may have. Finally, the analytical method of finding the corrected charting constants is a good approximation to the numerical method.
Out of control performance
The numerical control limits provided here guarantee that the in-control average run-length of the charts is equal to the nominal value of 370 or 500. However, since the corrected limits are wider than the uncorrected probability limits, it is of interest to see whether the correction impacts the out-of-control performance. It may be noted at the outset that such a comparison is not really fair since the in-control performance of the uncorrected limits can be far worse than the nominal.
In order to make this comparison, we compute the ARL for the considered dispersion charts with n = 5, for a number of values of the ratio (λ) between the Phase II standard deviation (σ) and the in-control process standard deviation (σ0), that is, for λ = σ/σ0. In other words, we compute points of the ARL profiles of the charts in different cases, where λ = 1 corresponds to the ICARL, and λ ≠ 1 corresponds to the out-of-control ARL (OOCARL). This is done for several values of m. The results are given in .
Table 8. The ARL and PD values associated with the uncorrected and corrected probability limits based R and S charts for n = 5, 10 and various values of λ and m.
Table 8. (Continued)
Table 8. (Continued)
The ARLs with the uncorrected and the corrected limits could be easily computed from Eq. [Equation3[3] ] by just replacing CFARj by the general conditional probability of an alarm, CPAj. Next, using λ = σ/σ0, and keeping in mind that α = α (m, n), we calculate CPAj for the corrected limits as
Using the known distributions of Tij/σ this gives
and
These values can in turn be used as described in the numerical approach, to determine the unconditional ARL as
where againx is the value of the random variable X0j. Formulae for the CPAj and ARLj of the uncorrected limits are the same as above, except that α0 is used instead of α(m, n).
shows the ICARL (λ = 1), the OOCARL (λ ≠ 1) and the PD values associated with the uncorrected and the corrected estimated probability limits based R and S charts, for n = 5, 10 and various values of λ and m. The PD values measure the percentage difference between the unconditional ARL values for the estimated σ0 case and the nominal unconditional ARL values. Note that the results for the uncorrected estimated probability limits have been thoroughly discussed by Chen (Citation1998). From it can be seen that when the process is IC and σ0 is estimated, using the uncorrected charting constants to construct the uncorrected probability limits gives unconditional ARL values that are up to 29% lower than the nominal 370 (corresponding to the σ0 known case) for n = 5 and 32% lower than the nominal 370 (corresponding to the σ0 known case) for n = 10, respectively. This means a lot of false alarms. Using the corrected (new) charting constants to construct the probability limits yields the nominal value 370, which is desirable. However, this also leads to larger unconditional ARL values for the corrected charts compared to the uncorrected charts when the process is OOC. Interestingly, this difference is smaller for decreases in variability (λ < 1) than for increases (λ > 1). In general, both the corrected and uncorrected charts have more difficulty in detecting decreases in variability than increases. It can also be seen that the effect of using either the corrected or uncorrected estimated probability limits is a function of m. In general, increasing m diminishes the effects of parameter estimation on both the IC and OOC unconditional ARL performance for both uncorrected and corrected probability limits, as expected.
To summarize, the corrected estimated probability limits provide a much better IC performance than the uncorrected limits, as it yields the nominally specified ICARL performance. However, this generally comes with a deterioration of the OOCARL performance relative to the uncorrected limits. Note that this tradeoff between IC and OOC performance can be altered by adjusting the value of ICARL0.
Summary and conclusions
Shewhart control charts are often used to monitor process dispersion. However, the standard versions of these charts assume known in-control parameters, which is typically not the case in practice. When the parameters are estimated to set up the control limits, both the IC and OOC performance of the control charts are affected (Chen Citation1998). In this article, we have provided corrected control limit constants based on the ICARL performance of the probability limits based R and S charts, to account for the effects of parameter estimation. Two methods are used to find the corrected charting constants. The first method, the numerical approach, involves numerical integration and solving nonlinear equations. The second method, the analytical approach is based on a first-order Taylor approximation to the ICARL. Differences in the values obtained with these two methods are small, indicating that the analytical approximations are quite accurate. However, the analytical approach is more general in the sense that it can be applied to any desired estimator. Extensions to other functions of S, such as S2 or log-S are straightforward.
The tabulated constants provided here ensure that the unconditional ICARL is equal to a pre-specified desired value, taking into account the estimators that are used, the number of Phase I subgroups (m) and the subgroup size (n). However, this IC robustness is achieved at the price of a deterioration (increase) in the unconditional OOCARL. This deterioration, due to the use of the corrected limits, is negligible for large values of m or large changes of variability.
In conclusion, this article provides the correct charting constants for the popular dispersion charts, for i.i.d. data from a normal distribution, properly accounting for the effects of parameter estimation, in terms of a specified nominal value of the unconditional in-control average run-length. A similar study, for the important case when n = 1, is required. Finally, note that in practice, it is possible that the data do not follow a normal distribution. How these corrected limits perform for other distributions and their required modifications require further investigation, which will be considered elsewhere.
About the authors
Mandla D. Diko obtained his M.Sc. in Statistics from the University of Pretoria. He is currently working as a Ph.D. student in the Department of Operations Management of the University of Amsterdam, the Netherlands. His research interests are in Statistical Process Quality Control.
Rob Goedhart obtained his M.Sc. in econometrics in 2014 at the University of Amsterdam, the Netherlands. He is a Ph.D. student in the Department of Operations Management and consultant at the Institute for Business and Industrial Statistics of the University of Amsterdam, the Netherlands. His current research topic is control charting techniques with estimated parameters.
Subha Chakraborti is a professor of Statistics in the Department of Information Systems, Statistics and Management Science, University of Alabama, USA. He is a Fellow of the ASA and an elected member of the ISI. His research interests are in Nonparametric and Robust Statistical Inference, including applications in Statistical Process Quality Control.
Ronald J. M. M. Does is Professor of Industrial Statistics at the University of Amsterdam, Director of the Institute for Business and Industrial Statistics, Head of the Department of Operations Management, and Director of the Institute of Executive Programmes at the Amsterdam Business School. He is a Fellow of the ASQ and ASA, an elected member of the ISI, and an Academician of the International Academy for Quality. His current research activities include the design of control charts for nonstandard situations, healthcare engineering and operational management methods.
Eugenio K. Epprecht is Professor in the Department of Industrial Engineering at the Pontifical Catholic University of Rio de Janeiro. He is a member of ASQ. His current research activities include the design of control charts with estimated parameters, and industrial engineering.
Acknowledgments
The authors are grateful to the anonymous referees for their comments that have improved the article.
Funding
Part of the work of the third author was supported by the CNPq, Brazil, through a Science Without Borders Special Visiting Professor grant (project no. 401523 2014-4). Also, part of the work of the last author was supported by the CNPq, Brazil, through a research fellowship grant (project no. 308677 2015-3).
References
- Chakraborti, S. (2000). Run length, average run length and false alarm rate of shewhart X-bar chart: Exact derivations by conditioning. Communications in Statistics – Simulation and Computation 29:61–81.
- Chen, G. (1998). The run length distributions of the R, S and S2 Control Charts when σ is Estimated. The Canadian Journal of Statistics 26 (2):311–322.
- Diko, M. D., S. Chakraborti, and M. A. Graham. (2016). Monitoring the process mean when standards are unknown: A classic problem revisited. Quality Reliability Engineering International 32 (2):609–622.
- Gibbons, J. D., and S. Chakraborti. (2010). Nonparametric statistical inference, 5th ed. Boca Raton, FL: Chapman & Hall.
- Goedhart, R., M. Schoonhoven, and R. J. M. M. Does. (2016). Correction factors for shewhart and control charts to achieve desired unconditional ARL. International Journal of Production Research 54 (24):7464–79.
- Goedhart, R., M. M. D. Silva, M. Schoonhoven, E. K. Epprecht, S. Chakraborti, R. J. M. M. Does, and A. L. Veiga Filho. (2017). Shewhart control charts for dispersion adjusted for parameter estimation. IISE Transactions, submitted.
- Grant, E. L., and R. S. Leavenworth (1986). Statistical quality control, 5th ed. New York: McGraw-Hill.
- Mahmoud, A. M., G. R. Henderson, E. K. Epprecht, and W. H. Woodall. (2010). Estimating the standard deviation in quality-control applications. Journal of Quality Technology 42 (4):348–357.
- Montgomery, D. C. (2013). Statistical quality control: A modern introduction, 7th ed. John Wiley & Sons, Inc.
- Patnaik, P. B. (1950). The use of mean range as an estimator of variance in statistical tests. Biometrika 37 (1):78–87.
- Woodall, W. H. (2017). Bridging the gap between theory and practice in basic statistical process monitoring. Quality Engineering 29 (1):2–15.
Appendix A
Table A1. Formulae for the various constants that are associated with the three spread charts that are considered in this article.
Let and
denote the sample relative range and its distribution function, respectively, then
Appendix B
Figure B1. R codes for (numerical approach).