
 ?Mathematical formulae have been encoded as MathML and are displayed in this HTML version using MathJax in order to improve their display. Uncheck the box to turn MathJax off. This feature requires Javascript. Click on a formula to zoom.
Article title: Response surfaces, blocking, and split-plots: A predictive distribution case study
Authors: Peterson, J. J.
Journal: Quality Engineering
DOI: 10.1080/08982112.2022.2102427
An error was noted in R programming that caused a modest overestimation of variance component values associated with the oven and batch (block) random effects. This led to posterior predictive distributions for that were slightly too dispersed for the diameter and strength responses. This error came from inadvertently treating the posterior Stan scale parameter variables, SO_1, SO_2, SB_1, SBx2_1, SB_2, and SBx2_2 (shown in the Appendix), as variance (for normal) and variance-related (for student t) parameters, rather than as standard deviation (for normal) and standard-deviation-related (for student t) parameters. (Stan represents the scale-variation parameter for the normal distribution as standard deviation parameter, not a variance parameter. A similar result holds proportionately for the student t distribution in Stan.). The author has corrected this programing error and recomputed , , , and and . These are shown below. The other figures and tables were not affected. As a high-level validation, a separate, parallel calculation was done using Stan’s generated quantities feature to sample the posterior random effects directly from Stan. This produced results very similar to the original approach (but not the same due to Monte Carlo random variation).
The results below indicate that the corrected posterior predictive distributions are associated with somewhat higher probabilities of conformance. In addition, the corrected minimum probability of conformance for the conservative (overlapping means) “sweet spot” in Figure 5 is 0.87 (at time = 140, temperature = 242). The overall conclusions of the paper remain the same.
This article was originally published with errors, which have now been corrected in the online version.
Figure 3. Actual and posterior-prediction point overlay plots, one for each (time, temperature) experimental design point. For each panel scatter plot, the solid points are the actual responses and the open points are thirty posterior predicted responses.
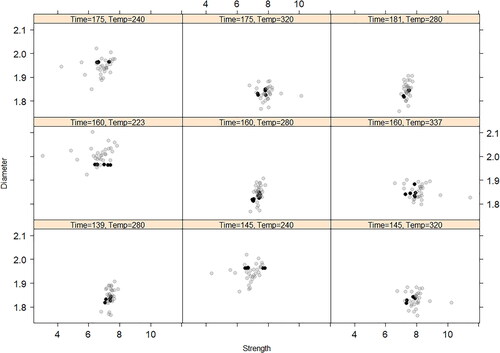
Figure 4. Contour plot of the probability of conformance to specifications, where x = (time, temperature).
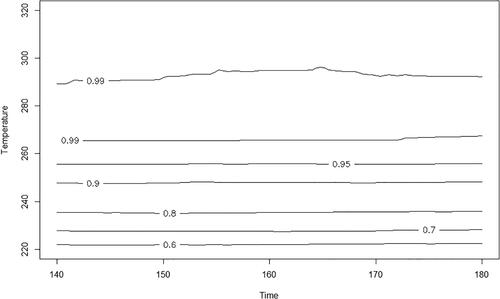
Figure 6. The (time, temperature) posterior predictive distribution (200 points) associated with the lowest probability of conformance within the more conservative (white) “sweet spot” in Figure 5. The white region is the (time, temperature) specification region.
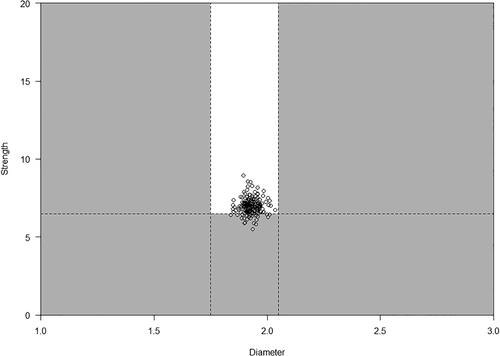
Figure 7. Contour plot of the probability of conformance to specifications, where x = (time, temperature), and time & temperature are subject to random noise disturbances that have a normal distribution with mean 0 and standard deviation of 5 units (sec. and °F, respectively).
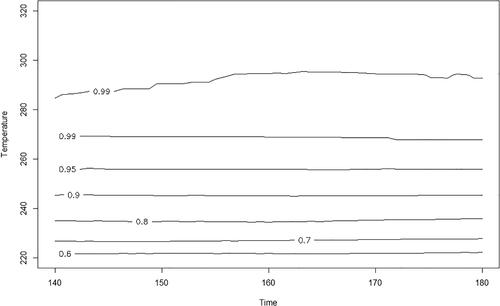
Table 3. Prior and random effect distribution sensitivity analysis for probabilities of conformance.