
Abstract
Background: Although hand motor cortex (HMC) has been constantly used for identification of primary motor cortex in magnetic resonance spectroscopy (MRS) studies of amyotrophic lateral sclerosis (ALS), neurochemical profiles of HMC have never been assessed independently. As HMC has a constant location and the clinic–anatomic correlation between hand motor function and HMC has been established, we hypothesize that HMC may serve as a promising region of interest in diagnosing ALS.
Patients and methods: Fourteen ALS patients and 14 age- and gender-matched healthy controls (HC) were recruited in this study. An optimized magnetic resonance spectroscopic imaging (MRSI) method was developed and for each subject bilateral HMC areas were scanned separately (two-dimensional multi-voxel MRSI, voxel size 0.56 cm3). N-acetyl aspartate (NAA)–creatine (Cr) ratio was measured from HMC and the adjacent postcentral gyrus.
Results: Compared with HC, NAA/Cr ratios from HMC and the postcentral gyrus were significantly reduced in ALS. However, in each group the difference of NAA/Cr ratios between HMC and the postcentral gyrus was not significant. Limb predominance of HMC was not found in either ALS or HC. In ALS, there was a significant difference in NAA/Cr ratio between the most affected HMC and the less affected HMC. A positive relationship between NAA/Cr ratio of HMC and the severity of hand strength (assessed by finger tapping speed) was demonstrated.
Conclusion: Neuronal dysfunction of HMC can differentiate ALS patients from HC when represented as reduced NAA/Cr ratio. Postcentral gyrus could not serve as normal internal reference tissue in diagnosing ALS. Asymmetrical NAA/Cr ratios from bilateral HMC may serve as a promising diagnostic biomarker of ALS at the individual level.
Introduction
Amyotrophic lateral sclerosis (ALS) is a heterogeneous neurodegenerative disease affecting both upper and lower motor neurons. Proton magnetic resonance spectroscopy (MRS) studies have consistently shown evidence of neuronal dysfunction in the primary motor cortex (PMC) of ALS (Filippi et al. Citation2010). However, no consensus has been reached on the standard protocols for performing MRS scans in ALS. Specifically, the location and volume of the region of interest (ROI) varies from study to study, making it difficult to reconcile results from different groups. Besides, the relationship between neuroimaging findings and clinical measures is also inconsistent (Foerster et al. Citation2013). Hand motor cortex (HMC), a landmark for PMC (Yousry et al. Citation1997), has been constantly used for identification of PMC in these studies. However, neurochemical profiles of HMC have never been assessed independently. As the location of HMC is constant and easy to identify, and the clinic–anatomic correlation between hand motor function and HMC has been established (Back and Mrowka Citation2001; Hall and Flint Citation2008), we propose that HMC may serve as a promising ROI for ALS detection. To test the feasibility of using HMC as a ROI for ALS, we performed a magnetic resonance spectroscopic imaging (MRSI) study in a group of ALS patients and healthy controls. A localized MRSI protocol was developed to detect neuronal dysfunction in the HMC area. The nearest postcentral gyrus was also included in the ROI as potential internal reference tissue. The correlation between clinical severity and the N-acetyl aspartate–creatine (NAA/Cr) ratio of HMC was also tested.
Methods
Subjects
Fourteen patients (8 male, 6 female) diagnosed of definite or probable sporadic ALS according to the revised El Escorial criteria (Brooks et al. Citation2000) were enrolled over a 1-year period. Their score on the revised ALS functional rating scale (ALSFRS-R) (Cedarbaum et al. Citation1999) was recorded. ALSFRS-R progression rate per month was calculated as follows: (48 − ALSFRS-R score)/time from symptom onset. As an indication of the severity of hand motor function impairment, finger tapping speed was measured for three 15-s epochs and averaged for each hand. In this study, the contralateral hemisphere of the initially involved upper limb was defined as the most affected hemisphere. Fourteen age- and gender-matched healthy adults (7 male, 7 female) were recruited as normal controls. Neither patients nor controls had a history of cerebrovascular disease, intracranial pathology, or any other neurological diseases. No patients had received riluzole treatment prior to the study. Patients with respiratory insufficiency were also excluded because they could not tolerate the long acquisition time of magnetic resonance (MR) scans. All subjects were right handed. The study was approved by the institutional ethics committee. All subjects or their next of kin provided written informed consent prior to MRSI examination.
Image acquisition
MRSI studies were conducted on a 3 T MR system (Signa HDxt; General Electric, Waukesha, Wiscosin, USA) using a standard 8-channel head coil. Following a sagittal T1-weighted localizer imaging series, an axial T2-weighted axial MRSI localizer imaging series (TR/TE = 4480/120 ms, slice thickness = 2 mm, gap = 0 mm, total 40–45 slices) was acquired to cover the whole supratentorial brain. The center of the “ASSET Calibration” sequence was located in the unilateral central sulcus, just between the HMC and the postcentral gyrus. Single slice two-dimensional MRSI was acquired using a PROBE-SI sequence (TR = 1000 ms, TE = 144 ms, NEX = 1, 10 mm section thickness) with automated shim and water suppression. Each ROI encompassed unilateral HMC and postcentral gyrus, including a total of 4–6 voxels. Six outer volume saturation slabs were placed outside the ROI to suppress lipid signals from the scalp. Acquisition time was approximately 6 min for each scan. The resulting nominal MRSI voxel size was 0.75 cm ×0.75 cm ×1.0 cm = 0.56 cm3. Off-line spectral post-processing was carried out using semi-automated software (Functool, Version 9.4.05; GE Medical Systems, Waukesha, Wiscosin, USA). MRSI results were reviewed by two neuroradiologists who were blind to the diagnosis. Compared with routine MRSI protocols, this localized MRSI method resulted in a better spectrum with higher signal-to-noise ratio (SNR) (). A detailed illustration of this method is shown in .
Figure 1. Illustrations of two different magnetic resonance spectroscopy imaging (MRSI) methods and their resulting spectra. (A, F) Coronal view of calibration scan in a routine MRSI method (upper row) and the localized MRSI method (lower row). (B, G) Positioning of the region of interest and the position of the target voxel. (C, F) N-acetyl aspartate (NAA) concentration map automatically generated by the Functool software. Voxels from the blue area (Shown as gray area in the Print version) have higher NAA concentration. Note that the target voxel is fully included in the blue area (Shown as gray area in the Print version) by the localized MRSI method (F). (D, I) Signal-to-noise ratio (SNR) distribution map automatically generated by the Functool software. Voxels from the red area (Shown as dark area in the Print version) have better SNR. Target voxel is not included in the red area (Shown as dark area in the Print version) by the routine MRSI method (D). (E, J) Spectra of the same target voxel from two MRSI methods. The resulting SNR is 1.42 and the NAA concentration is 129 528 arbitrary MR units with routine MRSI method (E), while the SNR is elevated to 2.04 and NAA concentration is elevated to 172 872 arbitrary MR units with the localized MRSI method (J).
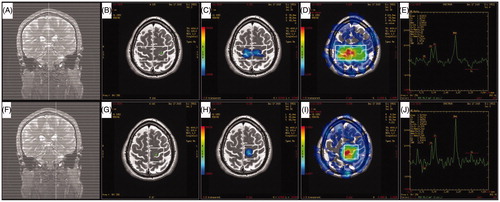
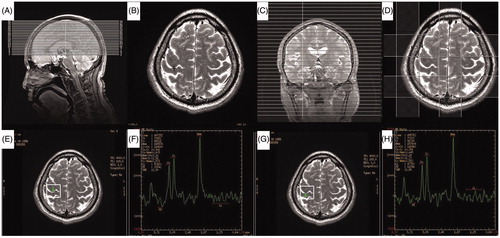
Figure 2. Illustration of the optimized magnetic resonance spectroscopy imaging (MRSI) protocol and resulting spectrum from right hand motor cortex and postcentral gyrus of a normal subject. (A) Saggital view of axial T2-weighted localizer imaging series. (B) Axial T2-weighted image. Black cross indicates the center of the ASSET Calibration sequence. (C) Coronal view of the calibration sequence. (D) Right hand motor cortex and corresponding postcentral gyrus are included in the region of interest. Four outer volume saturation slabs are shown. (E–H) Representative spectrum from right hand motor cortex (E, F) and postcentral gyrus (G, H) of a normal subject.
Statistics
The Shapiro–Wilk test was used to assess the normality of data. For comparison of demographic and clinical data between two groups, independent samples t-test or Mann–Whitney U-test was used as appropriate. For comparison of the group level difference in NAA/Cr ratios between ALS and HC, and between HMC and postcentral gyrus, data from the left and right hemispheres was pooled together and two independent samples t-tests were used. Intra-group comparison of NAA/Cr ratio was carried out using paired t-test. Correlations with clinical measures lacking lateral bias (age, disease duration, ALSFRS-R, and disease rate) were tested with mean NAA/Cr ratio or NAA/Cr ratios from the most affected hemispheres. Unilateral tapping speeds were tested for associations with contralateral NAA/Cr ratios.
Results
Demographic and clinical features of the subjects
Mean age of patients and healthy controls (HC) were 54 ± 8 (range 42–69) years and 54 ± 9 (range 39–66) years, respectively (p = 0.932). In ALS patients, the mean disease duration was 23 ± 11 months (range 8–42 months) and the mean ALSFRS-R score was 36 ± 5 (range 27–44). Among them 9 patients were upper limb onset, 2 patients were lower limb onset, and the remaining 3 patients were bulbar onset. Pyramidal signs of upper limbs were observed in only 6 patients while in 10 patients hand small muscles demonstrated neurogenic damage on electromyography (EMG). The disease progression rate was 0.64 ± 0.45 (range 0.25–1.6). Finger tapping speed was significantly lower in ALS patients (p < 0.001) ().
Table 1. Demographic and clinical data from healthy controls and patients with amyotrophic lateral sclerosis (ALS).
MRSI results
A total of 56 scans were performed for all subjects. In all cases spectra with good quality were obtained. The full width at half maximum ranged from 5 to 7 Hz, with a mean of 6.0 ± 0.2 Hz in patients and 6.0 ± 0.4 Hz in HC (p > 0.05), indicating that the spectra had good quality and results from both groups were comparable. Representative spectra from the HMC and postcentral gyrus of HC are shown in . When we compared the mean NAA/Cr ratios of ALS patients with HC, we observed a reduction of 22.4% in the HMC (p < 0.001) and a reduction of 17.0% (p < 0.001) in the postcentral gyrus. In the ALS group and HC group no difference was revealed between HMC and postcentral gyrus in pooled NAA/Cr ratios (p = 0.500 and 0.870, respectively). No statistical significance was detected between bilateral HMC (p = 0.422) or bilateral postcentral gyrus (p = 0.635) in NAA/Cr ratio of HC. In the NAA/Cr ratio of ALS patients there is no significant difference between bilateral HMC (p = 0.666) or between bilateral postcentral gyrus (p = 0.577) either. However, the difference between the most affected HMC and less affected HMC was found to be significant (p < 0.001) (). In a total of 14 patients, 12 had a lower value of the NAA/Cr ratio in the most affected HMC (sensitivity of 85.7%) ().
Figure 3. Magnetic resonance spectroscopy imaging (MRSI) spectrum from a patient presented with predominantly left upper limb weakness. A 35-year-old man developed progressive weakness of the left arm for 10 months. Neurological examinations revealed profound weakness and atrophy in the left arm, mild weakness with spasticity in the right arm and the tongue, and increased tendon reflexes with abnormal plantar extensor responses in bilateral lower limbs. Electrophysiological examinations demonstrated widespread denervation and reinnervation consistent with a clinical diagnosis of definite amyotrophic lateral sclerosis (ALS). MRSI scan revealed an N-acetyl aspartate–creatine (NAA/Cr) ratio of 2.36 (region of interest 5, upper row) in the left hand motor cortex (the less affected hemisphere) and an NAA/Cr ratio of 1.23 (region of interest 3, lower row) in the right side (the most affected hemisphere), which was in accordance with clinical findings.
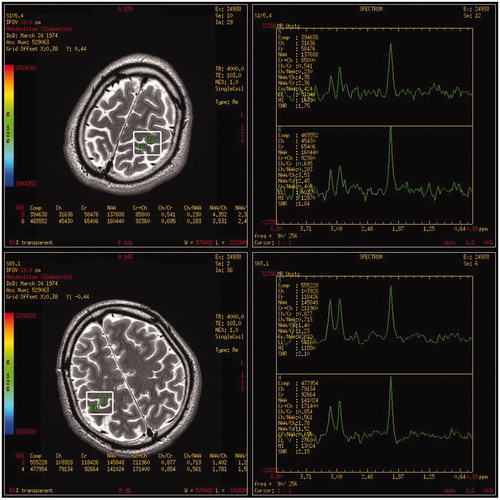
Table 2. Inter-group and inter-group comparisons of N-acetyl aspartate–creatine ratios between different groups, different hemispheres, and different regions of interest.
Correlation analysis
When all hemispheres of patients were combined, a moderate but statistically significant correlation, as determined with Pearson correlation analysis, was found between NAA/Cr ratios of HMC and the finger tapping speed (r = 0.585, p = 0.001). Neither mean NAA/Cr ratio of bilateral HMC nor NAA/Cr ratio from the most affected HMC correlates with the ALSFRS-R score (p = 0.583 and 0.213, respectively). They also have no correlation with the progression rate of ALSFRS-R score (p = 0.852 and 0.205, respectively). However, NAA/Cr ratio from the most affected HMC was found to correlate with disease duration (r = 0.561, p = 0.037).
Discussion
ALS is a rare disease with a median incidence rate of 1.9 per 100 000 person-years (Chio et al. Citation2013). Evidence of upper motor neuron involvement is crucial for the diagnosis of ALS. In this study we confirmed previous findings that a decreased NAA/Cr ratio was found in both precentral and postcentral gyrus (Pioro et al. Citation1994; Sanjay et al. Citation2003), which was in accordance with the pathology of ALS (Martin and Swash Citation1995). The difference between the most affected hemisphere and the less affected hemisphere of HMC was also significant (p < 0.001) and the unilateral NAA/Cr ratio of HMC correlated well with hand tapping speed in ALS patients, allowing us to further differentiate ALS patients from HC.
Currently it is difficult to confirm or exclude the diagnosis of ALS at the individual level. Technically there are at least three strategies to overcome this problem. The first one is the most commonly used strategy, which is to compare the neurochemical profiles of the patient with that from normal control subjects. If the reduced NAA/Cr ratio of the patient is found to be below the lower limit of HC (e.g., below 2 standard deviations from the average level if the NAA/Cr ratio of PMC has a normal distribution in the healthy population), then the diagnosis of ALS will be established. However, sensitivity and specificity of this strategy for ALS diagnosis is relatively limited (sensitivity: 50–70%; specificity: 40–90%) (Turner and Modo Citation2010). Reduction of the NAA/Cr ratio was only mild to moderate (Foerster et al. Citation2013) and there was considerable overlap in metabolite ratios of PMC between ALS patients and normal controls (Ellis et al. Citation1998; Kalra et al. Citation2006b). Such overlapping is probably a combined result of the physical feature of cerebral cortex and limitation of MRS scanning. While a typical ROI in single-voxel spectroscopy (SVS) studies has a size of 8 cm3 (2 cm × 2 cm × 2 cm), the undulating and folded appearance of cerebral cortex causes difficulty in defining the pathological area accurately. The focality of motor neuron degeneration further complicates the picture (Ravits and La Spada Citation2009). Therefore, it is inevitable to have signal contamination from surrounding areas including the unaffected region of PMC, adjacent normal parenchyma, and even cerebral spinal fluid. As a result, neurochemical differences between patients and controls might be underestimated. Because larger ROI gives rise to a better spectrum, reducing the volume of ROI at the expense of SNR ratio will not improve detection sensitivity. Therefore, the inherent deficit of SVS limits its clinical application in this disease. These issues have been addressed by Mitsumoto et al. (Citation2007). However, they still failed to find improved performance in MSRI study even with increased spatial resolution and reduced motor cortex voxel tissue heterogeneity (Mitsumoto et al. Citation2007). It appears that spectrum quality and reproducibility may degrade when voxels are located away from the magnet isocenter or near the tissue–bone interface. Positioning of voxel becomes even more critical when the motor cortex is sampled, which may have contributed to relatively lower reproducibility of NAA measurement in this region (Suhy et al. Citation2002). Previously we found that the voxels localized in the central part of the ROI have higher SNR ratios and better spectral quality (see illustrations in ). Based on these findings, we developed a localized MRSI method to scan the bilateral HMC area separately. Therefore, in this study we used HMC as a ROI and its neurochemical change as biomarker for ALS detection. As far as we know, no similar study design has been reported.
The second strategy is to compare the neurochemical profiles from HMC with that from an internal reference tissue of the brain, such as, the postcentral gyrus or premotor cortex. However, in previous studies widespread degeneration of the brain was reported (Turner and Modo Citation2010), and it is not known if the postcentral gyrus could serve as an internal reference tissue to facilitate the interpretation of the spectrum obtained from PMC. In this study the difference of the NAA/Cr ratio between precentral and postcentral gyrus was not significant either in patients or in HC, making the postcentral gyrus not suitable to serve as a normal internal reference tissue for clinical diagnosis of ALS.
The third strategy is to compare the neurochemical profiles from the most affected hemisphere of the patient with that from the less affected hemisphere. Asymmetrical symptoms (Ravits et al. Citation2007) and brain pathology (Mochizuki et al. Citation1995) are established features of early stage ALS. When asymmetrical metabolic ratios of motor cortex correlate with laterality of clinical symptoms (Pohl et al. Citation2001), the diagnosis of ALS may be more certain. However, asymmetrical neuroimaging findings from ALS should be interpreted with precise knowledge of limb predominance in the human brain (Turner et al. Citation2011). Previously, Nagae-Poetscher et al. (Citation2004) did not find asymmetric metabolite concentrations or ratios in the sensorimotor region of normal adults. Devine et al. (Citation2015) used a voxel-based morphometry method to explore gray matter asymmetry in ALS and HC. They found leftward predominance in the normal population while in the ALS patients, limb predominance was absent and interpreted as pathological change. It seems that limb dominance is not only a significant factor underlying the onset and progression of ALS (Devine et al. Citation2014), but also an important confounding factor when interpreting asymmetrical MRSI findings from ALS. In this study we tested the limb predominance effect in a group of healthy adults and we only found a marginal difference (p = 0.422) between bilateral HMC, which contradicts a previous study (Devine et al. Citation2015). In a total of 14 patients, 12 had a lower value of the NAA/Cr ratio in the most affected HMC, with a sensitivity of 85.7%. It should be stressed these data are preliminary. It is important to define a cut-off value for the asymmetry of the metabolic ratios before this tool can be suggested for clinical routine. In the future, defining the upper limit for physiological difference between bilateral HMC will be a critical step.
Previous studies have shown a moderate correlation between NAA concentration (and its ratios) in the motor cortex and clinical severity (Kalra et al. Citation2006a), extent of upper motor neuron signs (Wang et al. Citation2006), and maximum finger tapping rate (Rooney et al. Citation1998). Although a close clinic–anatomic correlation between hand motor function and HMC has been established, we didn’t find a strong relationship between the hand tapping speed and NAA/Cr ratios of the HMC. This may partly be due to the heterogeneity of the patient group and the limited patient number of the study. We suggest that in future studies other clinical measures like grip strength or Medical Research Council scale should be included and their relationships with neurochemical profiles of HMC should also be tested.
Conclusion
Neuronal dysfunction of HMC detected by this optimized MRSI method can differentiate ALS patients from HC when represented as reduced NAA/Cr ratio. In the future longitudinal studies with a larger sample size are needed to confirm these findings and to establish the importance of HMC in MRSI study of ALS.
Disclosure statement
The authors report no conflicts of interest. The authors declare that the work described was original research that has not been published previously, and not under consideration for publication elsewhere, in whole or in part. All the authors listed have approved the paper. The authors declare that they have no financial or personal relationships with other people or organizations that can inappropriately influence their work. There is no professional or other personal interest of any nature or kind in any product, service, and/or company that could be construed as influencing the position presented in this paper.
References
- Back T, Mrowka M. 2001. Infarction of the "hand knob" area. Neurology 57:1143.
- Brooks BR, Miller RG, Swash M, Munsat TL. 2000. El Escorial revisited: revised criteria for the diagnosis of amyotrophic lateral sclerosis. Amyotroph Lateral Scler Other Motor Neuron Disord 1:293–299.
- Cedarbaum JM, Stambler N, Malta E, Fuller C, Hilt D, Thurmond B, Nakanishi A, BDNF ALS Study Group (Phase III). 1999. The ALSFRS-R: a revised ALS functional rating scale that incorporates assessments of respiratory function. J Neurol Sci 169:13–21.
- Chio A, Logroscino G, Traynor BJ, Collins J, Simeone JC, Goldstein LA, White LA. 2013. Global epidemiology of amyotrophic lateral sclerosis: a systematic review of the published literature. Neuroepidemiology 41:118–130.
- Devine MS, Kiernan MC, Heggie S, McCombe PA, Henderson RD. 2014. Study of motor asymmetry in ALS indicates an effect of limb dominance on onset and spread of weakness, and an important role for upper motor neurons. Amyotroph Lateral Scler Frontotemporal Degener 15:481–487.
- Devine MS, Pannek K, Coulthard A, McCombe PA, Rose SE, Henderson RD. 2015. Exposing asymmetric gray matter vulnerability in amyotrophic lateral sclerosis. Neuroimage Clin 7:782–787.
- Ellis CM, Simmons A, Andrews C, Dawson JM, Williams SC, Leigh PN. 1998. A proton magnetic resonance spectroscopic study in ALS: correlation with clinical findings. Neurology 51:1104–1109.
- Filippi M, Agosta F, Abrahams S, Fazekas F, Grosskreutz J, Kalra S, Kassubek J, Silani V, Turner MR, Masdeu JC. 2010. EFNS guidelines on the use of neuroimaging in the management of motor neuron diseases. Eur J Neurol 17:526–e20.
- Foerster BR, Welsh RC, Feldman EL. 2013. 25 years of neuroimaging in amyotrophic lateral sclerosis. Nat Rev Neurol 9:513–524.
- Hall J, Flint AC. 2008. Neurological picture. "Hand knob" infarction. J Neurol Neurosurg Psychiatry 79:406.
- Kalra S, Hanstock CC, Martin WR, Allen PS, Johnston WS. 2006a. Detection of cerebral degeneration in amyotrophic lateral sclerosis using high-field magnetic resonance spectroscopy. Arch Neurol 63:1144–1148.
- Kalra S, Vitale A, Cashman NR, Genge A, Arnold DL. 2006b. Cerebral degeneration predicts survival in amyotrophic lateral sclerosis. J Neurol Neurosurg Psychiatry 77:1253–1255.
- Martin JE, Swash M. 1995. The pathology of motor neuron disease. In: Leigh PN, Swash M, editors. Motor neuron disease. London: Springer. pp. 93–118.
- Mitsumoto H, Ulug AM, Pullman SL, Gooch CL, Chan S, Tang MX, Mao X, Hays AP, Floyd AG, Battista V, et al. 2007. Quantitative objective markers for upper and lower motor neuron dysfunction in ALS. Neurology 68:1402–1410.
- Mochizuki Y, Mizutani T, Takasu T. 1995. Amyotrophic lateral sclerosis with marked neurological asymmetry: Clinicopathological study. Acta Neuropathol 90:44–50.
- Nagae-Poetscher LM, Bonekamp D, Barker PB, Brant LJ, Kaufmann WE, Horska A. 2004. Asymmetry and gender effect in functionally lateralized cortical regions: a proton MRS imaging study. J Magn Reson Imaging 19:27–33.
- Pioro EP, Antel JP, Cashman NR, Arnold DL. 1994. Detection of cortical neuron loss in motor neuron disease by proton magnetic resonance spectroscopic imaging in vivo. Neurology 44:1933–1938.
- Pohl C, Block W, Karitzky J, Traber F, Schmidt S, Grothe C, Lamerichs R, Schild H, Klockgether T. 2001. Proton magnetic resonance spectroscopy of the motor cortex in 70 patients with amyotrophic lateral sclerosis. Arch Neurol 58:729–735.
- Ravits J, Paul P, Jorg C. 2007. Focality of upper and lower motor neuron degeneration at the clinical onset of ALS. Neurology 68:1571–1575.
- Ravits JM, La Spada AR. 2009. ALS motor phenotype heterogeneity, focality, and spread: deconstructing motor neuron degeneration. Neurology 73:805–811.
- Rooney WD, Miller RG, Gelinas D, Schuff N, Maudsley AA, Weiner MW. 1998. Decreased N-acetylaspartate in motor cortex and corticospinal tract in ALS. Neurology 50:1800–1805.
- Sanjay K, Cashman NR, Zografos C, Genge A, Arnold DL. 2003. Gabapentin therapy for amyotrophic lateral sclerosis: lack of improvement in neuronal integrity shown by MR spectroscopy. AJNR Am J Neuroradiol 24:476–480.
- Suhy J, Miller RG, Rule R, Schuff N, Licht J, Dronsky V, Gelinas D, Maudsley AA, Weiner MW. 2002. Early detection and longitudinal changes in amyotrophic lateral sclerosis by (1)H MRSI. Neurology 58:773–779.
- Turner MR, Modo M. 2010. Advances in the application of MRI to amyotrophic lateral sclerosis. Expert Opin Med Diagn 4:483–496.
- Turner MR, Wicks P, Brownstein CA, Massagli MP, Toronjo M, Talbot K, Al-Chalabi A. 2011. Concordance between site of onset and limb dominance in amyotrophic lateral sclerosis. J Neurol Neurosurg Psychiatry 82:853–854.
- Wang S, Poptani H, Woo JH, Desiderio LM, Elman LB, McCluskey LF, Krejza J, Melhem ER. 2006. Amyotrophic lateral sclerosis: diffusion-tensor and chemical shift MR imaging at 3.0 T. Radiology 239:831–838.
- Yousry TA, Schmid UD, Alkadhi H, Schmidt D, Peraud A, Buettner A, Winkler P. 1997. Localization of the motor hand area to a knob on the precentral gyrus. A new landmark. Brain 120:141–157.