
ABSTRACT
This study compared use of byproduct-based concentrates and a control feed based on cereal grains and soybean meal in dairy cow diets and evaluated effects on the environment and feed costs. To achieve a nutrient-dense feed ration to dairy cows byproducts are commonly combined with cereal grains and protein-rich feeds such as soybean meal. The present analysis was based on experimental data for high-yielding dairy cows showing that feeding concentrate based on byproducts gives similar milk yield as feeding concentrate based on cereal grains and soybean meal. Evaluation of the different concentrates using life cycle assessment showed that using byproducts required less cropland (−35%), reduced carbon footprint (−20%) and lowered eutrophication potential (−20%) compared with the control. Energy use was higher (+30%), due to the need for drying wet byproducts. Feed costs per kg energy-corrected milk did not differ between the feeds, which is beneficial from a sustainability perspective.
Introduction
Agriculture currently occupies around 38% of global land area (Flysjö et al., Citation2011) and accounts for 23% of total net anthropogenic greenhouse gas emissions (IPCC, Citation2019). The demand for food is projected to increase by 25–70% from recent levels by 2050 (Huhtanen et al., Citation2017), and this will be achieved by increasing the resilience of the food system, for example, closing yield gaps, reduce waste and by dietary changes (see, e.g. Bajželj et al., Citation2014; Davis et al., Citation2016). Of the farmland currently used, nearly 60% is devoted to livestock feed production, either as crops (33% of land) or grassland used for grazing (26% of land) (FAO, Citation2010). However, most livestock diets do not currently compete with human food supply, since they consist of roughages, crop residues and agricultural byproducts (Mottet et al., Citation2017). Globally, a wide range of byproducts are used for feeding livestock, for example, wheat bran, distillers grain, beet pulp, molasses, rapeseed cake, corn gluten, cottonseed meal, citrus pulp and rice bran. Sweden accounts for 1.3% of all compound feed for livestock produced in EU-28 per year and 37% of the feed consists of byproducts, mainly oil cakes/meal and byproducts from food and biofuel industries (FEFAC, Citation2021).
When evaluating resource utilisation for crop production or the environmental impact of production, the burden is distributed over more than one crop in the case of byproducts. Byproducts are also known to be advantageous regarding competition between feed and food production as they do not compete for land, which is important in improving the land-use efficiency of livestock systems (Eisler et al., Citation2014; van Zanten et al., Citation2016). Use of byproducts has the additional benefits that it may reduce the cost of feed for the farmer and provide an additional income stream for the food and biofuel industry (Eggleston & Lima, Citation2015). Feed is the largest cost in dairy farming and economic sustainability in the food chain is crucial for the resilience of the food system. Hence, changes in a production system should not reduce farm profitability (Darnhofer, Citation2014). Previous life cycle assessments (LCA) on milk production have not included economic evaluations (e.g. Flysjö et al., Citation2011; Henriksson et al., Citation2014). However, a scenario analysis by Hessle et al. (Citation2017) showed that increased production efficiency was the most important factor to reduce negative environmental impact and improve profitability in Swedish dairy production.
Roughage and byproducts from processing food for humans and from the biofuel industry have long been used to feed ruminants. In diets for high-producing dairy cows, it is common practice to combine byproducts with cereal and legume grains in concentrate feeds, to achieve a nutrient-dense feed ration that covers the animals’ nutritional requirements. However, using cereal grains and protein-rich legumes such as soybean meal in livestock diets may have a negative impact on food security since these products can be used directly as human food and are grown on cropland where human food can be produced (Muscat et al., Citation2020). The soybean meal used for livestock in Sweden is mainly imported from Brazil, where its cultivation is associated with high greenhouse gas emissions, due to land-use change, and with loss of biodiversity (Castanheira and Freire, Citation2013; Lathuillière et al., Citation2017).
An experimental study by Karlsson et al. (Citation2018) showed that feeding concentrate based entirely on non-human-edible byproducts (sugar beet pulp, distillers grain and rapeseed meal) to high – producing dairy cows can result in similar milk yield as feeding concentrate based on cereal grains and soybean meal. The study also showed promising results in terms of net food production, that is, human-edible output in milk and meat minus human-edible input in animal feeds. However, the study identified a need for further investigations on effects on the environment to assess whether increased use of byproducts in dairy cow diets can reduce the negative impact from cattle production. The aim of the present study was therefore to compare use of byproduct-based concentrates and a control feed, in combination with grass-clover silage, in the diet of lactating dairy cows and to evaluate different environmental impacts and the feed costs as a measure of economic sustainability.
Previous LCAs on milk production have relied on information from surveys with farmers, databases or other large records of compiled data (Poore & Nemecek, Citation2018). In these studies, simple equations or more refined models are used to calculate, for example, manure production and methane emissions from enteric fermentation. In addition, feed intake may be estimated based on milk production, growth, etc., instead of actual measured consumption due to lack of data (see e.g. Oishi et al., Citation2011). A novel feature of this study is that it complements previous work by using data from actual feeding trials, using measured individual data on feed intake and thereby improved data input for calculations of emissions and provides additional information on farm profitability when using these different feeds.
Material and methods
Assessment of the environmental impact
Data from a previous dairy cow feeding experiment that included different types of concentrate mixtures (Karlsson et al., Citation2018) were used to estimate environmental impact and profitability of the feed rations. The environmental impact was calculated using LCA based on guidelines from the International Dairy Federation (IDF, Citation2015) and two Product Environmental Footprint Category Rules (EDA, Citation2018; PEFCR, Citation2018). Attributional LCA was performed, that is, each product’s total environmental impact was calculated and all environmentally relevant flows to and from the product’s entire life cycle were accounted for. Economic allocation was used for the concentrate ingredients. The system boundary was set to farm-gate (see for system boundaries and processes included). The functional unit (FU) was 1 kg ECM delivered from the farm, which is a common FU in LCA of milk production (Poore & Nemecek, Citation2018). The IDF guidelines states 1 kg of Fat – and protein-corrected milk (FPCM) as the FU, but energy-corrected milk (ECM) yield (Sjaunja et al., Citation1990) is the common unit in Sweden. The results were expressed both with and without allocation of environmental burdens to meat according to IDF (Citation2015). Environmental categories considered in the analysis were carbon footprint (Global Warming Potential; GWP100 excl. climate-carbon feedback) (Myhre et al., Citation2013) (kg CO2e), land requirement (m2), potential eutrophication (CML 2; re-calculated to g NO3e) and use of non-renewable energy (MJ). These categories are considered among the most relevant for dairy production according to PEFCR Dairy (EDA, Citation2018) and LEAP (FAO, Citation2016). Greenhouse gas emissions from the foreground system were calculated as (1) Enteric fermentation: feed intake in the animal trials and methane emissions calculated according to NorFor (Tier 3 method used in Sweden’s national inventory report). (2) Manure management: feed intake based on the animal trials, N and organic matter in excreted manure calculated according to NorFor. Methane and N2O emissions calculated with emission factors according to Sweden’s national inventory report (Volden, Citation2011; SEPA, Citation2019). The results are presented with and without direct land-use change (dLUC) for feedstuffs where this was considered relevant, that is, ingredients based on soybean from Brazil and palm oil from Malaysia. dLUC was calculated according to PAS 2050 (BSI, Citation2012). The LCA input data can be found in Table S2 in supplementary material (SM).
Figure 1. System description.
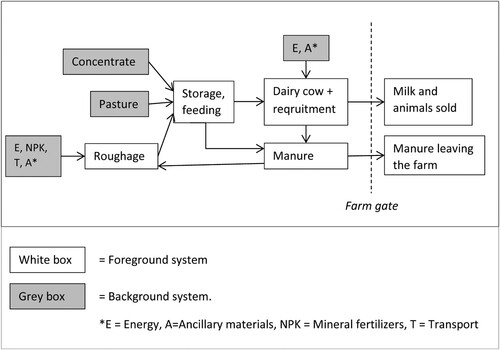
The calculations included the environmental impact of all inputs and activities until the milk left the farm and, for roughage production, until the silage was distributed on the feeding table. Regarding feedstuffs, the environmental impact of the silage was calculated specifically for this study. Silage was the single largest component in the dairy cow diets, so its environmental impact had a major influence on the total environmental impact from production. Emissions of nitrous oxide were calculated according to IPCC guidelines (Tier 1; Citation2006). A decision support tool ‘VERA’ developed by the Swedish Board of Agriculture (Citation2019) was used to calculate ammonia losses and nitrate leaching, that is, a higher tier than indicated by the PEF and IDF guidelines. Potential changes in soil carbon stock were not considered, that is, the stock was assumed to be in balance. Data for other feedstuffs were obtained from previous national and international LCAs. Primarily, Swedish data were taken from LCAs performed by the Research Institutes of Sweden AB (former Institute for Food and Biotechnology) (Flysjö et al., Citation2008; Berglund et al., Citation2013; RISE, Citation2013). When Swedish data was missing or considered old, Danish values were used (Mogensen et al., Citation2018) or values were derived from the LCA database Agri-footprint (Blonk Consultants, Citation2018). Infrastructure on-farm (capital goods, which includes material in tractors, buildings, etc.) was only included for tractors in this study, through a surcharge on the environmental footprint of diesel. Building infrastructure was not included, according to PEFCR Dairy (EDA, Citation2018).
For concentrate ingredients, economic allocation was used to distribute the environmental impact of crop cultivation and processing between the products obtained, for example, between rapeseed cake and rapeseed oil after pressing rapeseed (PEFCR, Citation2018). The same allocation factors as in the studies cited were used. Grass-clover crops are normally included in a crop rotation where certain interventions are made for the entire crop rotation, for example, liming. The inputs for liming were therefore spread over the four-year crop rotation (spring barley followed by three years of temporary grass-clover ley). Calculation of replacing natural gas with biogas in the drying of beet pulp were made using data from the Swedish Energy Agency (Citation2020) and Klackenberg (Citation2021).
Data from feeding experiment
The animal experiment was a mid-lactation change-over trial in which high producing dairy cows were fed a flat rate (11 kg per cow and day) of concentrates based on non-human-edible byproducts (sugar beet pulp in combination with heat-treated rapeseed meal and/or distillers grain) or a control concentrate based on cereal grain (wheat, oat and barley) and soybean meal (). All diets were formulated to be isoenergetic and isonitrogenous, that is, providing the same concentrations of metabolisable energy and crude protein, although the feedstuffs differed. In addition to the concentrate, grass-clover silage was fed for ad libitum intake. Data on daily feed intake and milk yield, milk fat and milk protein from the animal experiment were recalculated in this study to values of feed intake and milk yield over the lactation and for the dry period, according to the NorFor feed evaluation system (Volden, Citation2011). Data on milk yield and milk constituents (milk fat, milk protein and lactose) were used to calculate ECM yield (Sjaunja et al., Citation1990). The statistical analyses in the experimental study showed no differences between treatments in feed intake and milk yield. Enteric methane emissions were calculated according to Nielsen et al. (Citation2013).
Table 1. Dry matter intake (DMI), proportion of roughage, proportion of feed components in concentrate (% of DMI), and milk yield of dairy cows based on data from a feeding trial (Karlsson et al., Citation2018), recalculated to 305 days of lactation and 60 days of dry period. The treatments differed in type of concentrate
Adjustments to herd level
The calculations were adjusted to an assumed herd of 100 Holstein dairy cows plus recruitment heifers. During summer, the cows were assumed to be fed the complete ration indoors and the recruitment heifers were assumed to be kept on pasture for 210 days during the total rearing period of 27.3 months. Feed rations for the heifers were calculated according to NorFor using different concentrates: a commercial calf starter and concentrate for heifers with the addition of the same byproduct-based concentrate as for the dairy cows (). Optimisation limited the intake of only byproduct-based concentrate due to the maximum filling value in the rumen according to NorFor. Second-cut grass-clover silage (data on nutritional composition taken from the NorFor feed table; http://feedstuffs.NorFor.info/) was used in the feed rations for the heifers. Herd data were based on national statistics (Växa Sverige, Citation2017). Bull calves (51% of all calves born) were assumed to be sold at two months of age and all heifer calves were used for recruitment. Percentage of culled cows was 38%, while stillbirths were set to 5.2%, calf mortality 1–60 days to 3.8%, calf mortality 2–15 months to 3% and heifer mortality to 1%. It was assumed that first-lactation cows achieved 85% of the milk production level in older cows.
Table 2. Calculated feed intake of different feedstuffs by recruitment heifers, in total kg dry matter (DM), during the rearing period of 27.3 months
Silage production
On Swedish dairy farms today, it is common practice to include a three-year grass-clover ley in a four-year crop rotation fertilised with manure in combination with mineral fertilisers. Therefore we based our calculations of silage production on such a system. Calculation of the environmental impact and production cost for the silage was performed separately for each feed ration. The amount of nitrogen (N) and phosphorus (P) applied via manure differed between the scenarios due to variations in N and P excretion rate between feeding strategies, for example, high proportions of rapeseed meal or other feed ingredients rich in P led to higher concentrations of P in the manure. There were also differences due to the different needs for cropland for spreading manure, and hence less P mineral fertiliser was needed to supply crop P requirements (Table S1 in SM).
The temporary grassland was assumed to be a mix of 33% red clover and 66% grass. The final crop yield was set to 8200 kg dry matter (DM) per hectare (ha), which corresponds to approximately 8600 kg DM per ha before field losses. Feed losses of silage during storage in bunker silos to feed out were set to 15% of DM (Spörndly, Citationunpublished observations). The annual supply of N to grass-clover cultivation was set at 160 kg per ha. Crop requirement of P and potassium (K) was set to 17 and 120 kg per ha and year, respectively (Swedish Board of Agriculture, Citation2017). The annual amount of N, P and K excreted in manure was calculated as a balance calculation, that is, the amount of plant nutrients added to the cows via feed minus the requirement for milk production and for maintenance and growth. Additions were made for plant nutrients entering the manure via feed waste and bedding material, and deductions were made for losses of ammonia in animal houses and warehouses. The output of N, P and K in manure was calculated using the NorFor feed evaluation system (Volden, Citation2011) for each feed ration. Nitrogen losses in houses and during storage were deducted from the amount of excreted N. The area available for spreading manure was assumed to correspond to the area required for the grass-clover ley (see Table S1 in SM). This assumption was based on the fact that grass-clover silage was the only feedstuff cultivated on-farm, since concentrate was purchased. Since it was assumed that the grass-clover ley was included in a crop rotation, the calculations included spring barley as the nurse crop when established. The yield of barley was assumed to be 4.5 tonnes per ha, which is the national mean value (Swedish Board of Agriculture, Citation2017).
Feed costs
Economic calculations were performed on feed costs. Input data for feed calculations are presented in Tables S3 and S4 in SM. Concentrate prices were obtained from the manufacturer of the experimental feeds and the price of roughage was obtained from calculations of farm production costs aiming to make roughage comparable to the alternative of buying concentrate or cereals. The costs included production and silage withdrawals from the bunker silo. This was done to include the additional cost of handling roughage in comparison with handling concentrate, which is often simpler. Information on the price and amounts of inputs was taken from production calculations for the crops (Hushållningssällskapet, Citation2017). Machine costs were calculated so that all costs for the machine were taken into account (fuel, maintenance, depreciation and interest) and the cost for the driver (Maskinkalkylgruppen & HIR-Skåne, Citation2017). Costs for tillage and sowing were distributed with 50% on the nurse crop and 50% on the temporary grass-clover ley, the latter divided over three years. Information on the costs of storage, other work, general business costs and land costs was retrieved from Cederberg et al. (Citation2018).
Results and discussion
Environmental impact of the concentrate composition
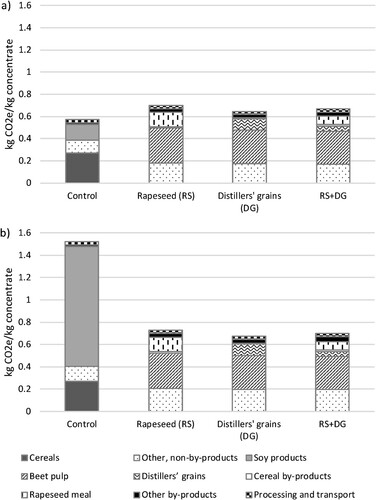
The environmental impact was highest for the control concentrate in all categories, except non-renewable energy use or when land-use change was excluded from calculations of carbon footprint. When emissions from dLUC were included, the control concentrate showed a large carbon footprint mainly due to the use of soybean meal (). Due to the large contribution of dLUC to carbon footprint, there has been a discussion on how to account for pressure on land, where deforestation actually takes place, or where land pressure is caused anywhere in the world where crop production takes place (Cederberg et al., Citation2013). Therefore it was considered interesting to show these differences with and without dLUC. The feed fat included in the concentrate was assumed to be based on palm oil from Malaysia and, therefore, to have a relatively large impact on the total emissions (Fargione et al., Citation2008).
Figure 2. Carbon footprint (kg CO2e) of feed composition per kg concentrate: (a) without direct land use change (dLUC) and (b) with dLUC included in the calculations.
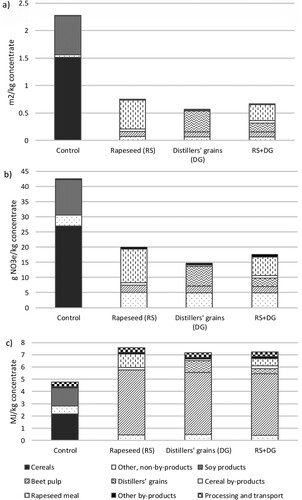
A larger area of arable land was required for the control dietary treatment (). This was because of cultivation of cereals and soybeans and because feed ingredients carried all or much of the environmental impact of cultivation of these crops. Land requirement was a minor item for byproducts, as the allocation placed a larger share on the primary products (sugar, cereal starch and rapeseed oil). This agrees with results reported by, for example, van Zanten et al. (Citation2014). However, the availability of byproducts is limited in terms of quantities produced and competition from other industries. Thus, if byproducts would be the sole source of concentrate feeds, dairy production would need to be reduced (van Zanten et al., Citation2018). The results for eutrophication impact showed the same pattern as land requirement, and the reason for this was also the link between land area and emissions. The level of N-fertiliser used in Swedish dairy farming varies widely, partly due to variation in the type of crops, soil and climate conditions, and Henriksson et al. (Citation2011) found no correlation between access to manure and purchase of synthetic fertiliser. Thus, there are possibilities to improve N use efficiency in feed production, which would affect both eutrophication and carbon footprint. For use of non-renewable energy, large amounts of energy were required to dry the byproducts, especially products with low dry matter content such as beet pulp and distillers grain. In the energy consumption values used for beet pulp in the calculations, a large proportion of the energy originated from natural gas, which contributed to high impacts. Beet pulp was the main feed ingredient in the byproduct-based concentrates (see ), and thus had a strong influence on the results. The lower use of non-renewable energy for drying distillers grain was due to use of a large proportion of renewable energy in the drying process (Mogensen et al., Citation2018). Some of the natural gas used for drying of the beet pulp could potentially be replaced by upgraded biogas that is injected to the natural gas grid. In Sweden, most of the upgraded biogas in is currently used as vehicle fuel. The average carbon footprint was 15.8 g CO2e per MJ gas of vehicle gas (95% biogas and 5% natural gas) distributed in Sweden in 2019 (Swedish Energy Agency, Citation2020; Klackenberg, Citation2021). If it can be assumed that there is the same carbon footprint for biogas for the sugar industry and that all-natural gas is replaced with this gas, carbon footprint and non-renewable energy for drying of beet pulp can be reduced by 58% and 75%, respectively.
Figure 3. Environmental impact of feed composition per kg concentrate in terms of (a) land requirement (m2), (b) potential eutrophication (g NO3e) and (c) use of non-renewable energy (MJ).
Environmental impact of dietary strategy
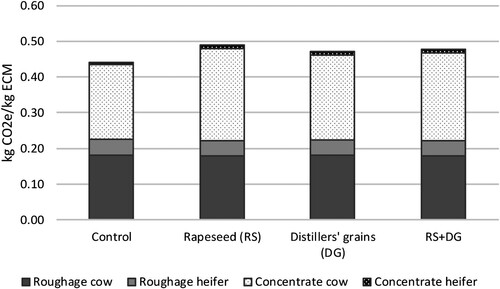
The cows consumed the same amount of silage in the different dietary strategies, but estimated methane production from enteric fermentation was higher in the control group than in the groups that received byproduct-based concentrates, where the levels were similar. This is probably due to the fat content in the concentrate being lower in the control feed, since in the calculation model for methane emissions the amount of fatty acids in the feed ration affects the amount of methane produced from fermentation (Nielsen et al., Citation2013). The environmental impacts of the complete diets based on total DM intake, including for recruitment heifers, are presented per kg ECM in .
Table 3. Environmental impact per kg ECM (recruitment heifers included), with and without allocation between milk (84%) and meat (16%), divided over different sources, for the environmental categories: (a) carbon footprint (kg CO2e), (b) eutrophication (g NO3e), (c) non-renewable energy use (MJ) and (d) land requirement (m2). For carbon footprint in (a), part I shows results without emissions from land use change and part II shows results with emissions from land use change (dLUC) from soybean and palm oil production. dLUC is calculated according to PAS 2050 (BSI, Citation2012)
Recruitment heifers make up a large part of a herd, especially if recruitment rates are high, and more or less all heifer calves are kept in the herd and consume feed for more than two years before first calving. When the calves start to consume feeds other than milk, they also produce methane. Since the age of heifers at first calving varies greatly between farms, this period has a major impact on the animal’s lifetime production of methane and total herd emissions (Garnsworthy, Citation2004; Hristov et al., Citation2013). However, in the present study, the composition of the heifers’ feed rations was quite similar and had limited influence on the total environmental impact of milk when added to the cows’ feed rations, accounting for on average 12% of the carbon footprint from feedstuffs (). In addition, the majority of the ration consisted of roughage, as silage and pasture made up more than 80% of the feed ration of young animals. For this reason, the heifers’ share of land requirement, especially for pasture, was slightly higher than for the carbon footprint (approximately 17%, data not shown).
Figure 4. Carbon footprint of the feed rations of dairy cows and recruitment heifers, divided into roughage and concentrate, expressed in CO2e per kg energy-corrected milk (ECM).
Silage production
Estimated environmental impact for the silage used in the different feed rations is shown in . There were small differences between the rations, due to varying content of N and P in the manure and in temporary grass-clover ley area required for spreading the manure. Differences in nutrient content in the manure resulted in different amounts of manure N being applied per hectare, and thus also the N supply from mineral fertilisers, with a maximum of 170 kg total N/ha according to the Nitrates Directive (EU, Citation1991) or a maximum of 22 kg P/ha (Swedish Board of Agriculture, Citation2004) (see Table S2 in SM). The reason for this is that, at a fixed yield of plant-available N per ha, more total N is added when applied in the form of manure than when applied as mineral fertiliser, since the manure contains a large proportion of organic N that is not directly available to the plants. The differences in the carbon footprint of the silage and its contribution to eutrophication () were due to the different amounts of manure N applied per hectare. The greater the proportion of mineral N in relation to total (plant-available) N supply, the lower the silage carbon footprint, eutrophication, and N leaching (Henriksson et al., Citation2011). The differences in energy use were a consequence of differences in manure quantities (diesel consumption) and in the mineral fertiliser N requirement (energy use in manufacturing) between different feeding strategies.
Table 4. Environmental impact of silage production per kg dry matter (DM)
Phosphorus and nitrogen in manure
Phosphorus
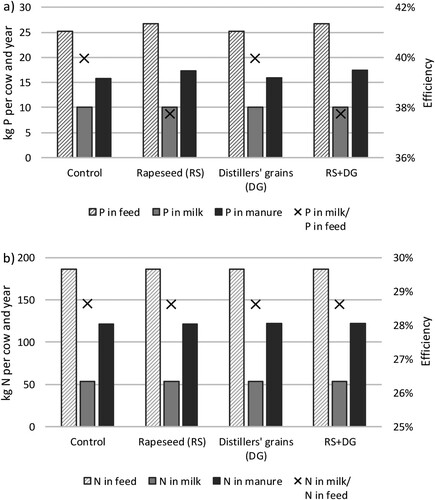
The amount of P in Swedish feed rations is generally not limiting for milk production, and in fact, it is more common for cows to be overfed with P (Nordqvist, Citation2012). Feed intake is limited by other factors, such as the digestibility of the organic matter, particularly the fibre fractions, and nutrient content, which in turn limits the amount of feed the cows can eat or the amount of milk they produce (see e.g., Volden, Citation2011). The P content of the feed directly determines the P content of the manure, because any P not deposited in milk, foetus or growth ends up in the manure. A relatively large proportion of P in dairy cow feed comes from the concentrate because it has a high P content compared with the roughage. A higher proportion of concentrates in the feed ration can therefore provide more P in the manure, that is, it reduces the P use efficiency. The P content in the concentrates used in animal experiments differs depending on the formulation and ingredients used. The P content is high in rapeseed products compared with soy products, distillers grain and cereals (Spörndly, Citation2003). A high proportion of rapeseed in the concentrate can thus be a contributing factor to high P level in the manure. This was seen for the experimental diets, where the concentrates containing rapeseed meal (RS and RS + DG) had somewhat higher P content than the control concentrate and the concentrate with distillers grain (DG) ((a)).
Figure 5. Amount of (a) phosphorus (P) and (b) nitrogen (N) in feed consumed, milk produced and manure excreted per cow and year (excl. heifers) (left axis), and nutrient use efficiency (amount of P and N in milk as % of P and N in feed) (right axis).
Nitrogen
The N in manure is derived from the protein in the feed (1 kg crude protein = 160 g N). On average, the higher the N concentration in the feed, the lower the N use efficiency, that is, the amount of N in milk in relation to N in feed consumed (Huhtanen et al., Citation2008). Excess N is excreted mainly in the urine, but also in faeces. The experimental diets showed approximately 30% efficiency for all diets ((b)). These results refer to the content of manure per cow and year if all manure ends up being excreted in the animal house. also shows an efficiency measure of P and N use expressed as a proportion of the P and N in the feed that ends up in the milk. The higher the value, the larger the proportions of plant nutrients that end up in the milk and the more efficient the use of N and P. The amount of P and N in the manure and the efficiency varied within the experimental treatments.
Feed costs
The economic evaluation showed no major differences in feed costs depending on the concentrate used (). The price of the concentrates was set to market price, and the byproducts used are common on the feed market today, so there is not an excess of products. The use of byproducts will therefore be in competition with other potential users. Thus, the price was balanced by the existing market for soy and cereals as alternatives, rather than related to the production cost of the byproducts. The same amount of silage was used in the different rations, so the cost of that did not differ. With the feed rations used in these calculations and with the assumptions made, the feed costs per kg ECM did not increase when using byproducts in the concentrate mixture. Differences seen in the feed costs were marginal and mostly depended on variations in feed utilisation that were not significant in the underlying feed trial (Karlsson et al., Citation2018). The byproducts used in the trial were all included in dry concentrate mixtures manufactured at the feed factory. This means that they can be used without changes to farm infrastructure or internal farm routines. If using wet byproducts, completely different needs may arise for investing in machinery and buildings for handling the feedstuffs on the farm.
Table 5. Annual cost of feed for dairy cows and heifers, in EUR (1 EUR = 9.633 SEK) per kg energy-corrected milk (ECM) delivered to the dairy plant, assuming silage production on-farm, summer pasture period and purchased concentrate.
Conclusions
The main advantage of using byproduct-based concentrate is that it requires less cropland compared with cereals and legumes. Overall, the environmental impact when using byproduct concentrates varies depending on type of environmental impact category. Carbon footprint (−20%), land requirement (−35%) and eutrophication potential (−20%) are lower when byproduct-based concentrates are used, whereas energy use is higher (+30%) due to the need for drying wet byproducts. If drying were not needed or if largely renewable energy sources were used in the future, the benefits of using byproduct-based concentrates would increase. The animal study on which these conclusions are based showed that cows could produce equally well on diets based on high-quality forage in combination with byproduct-based concentrate or concentrate based on cereals grains and soybean meal. The present analysis showed that, at current market prices, there are no large differences in feed costs per kg ECM when concentrates fed to dairy cows are based on byproducts rather than on cereals and soybean meal.
supplementary_material_.docx
Download MS Word (52.9 KB)Disclosure statement
No potential conflict of interest was reported by the author(s).
Correction Statement
This article has been corrected with minor changes. These changes do not impact the academic content of the article.
Additional information
Funding
References
- Bajželj, B., Richards, K. S., Allwood, J. M., Smith, P., Dennis, J. S., Curmi, E. & Gilligan, C. A. (2014). Importance of food-demand management for climate mitigation. Nature Climate Change 4, 924–929. doi:10.1038/nclimate2353
- BSI. (2012). PAS 2050-1:2012 Assessment of Life Cycle Greenhouse Gas Emissions from Horticultural Products. Supplementary Requirements for the Cradle to Gate Stages of GHG Assessments of Horticultural Products Undertaken in Accordance with PAS 2050 (London: British Standards Institution).
- Berglund, M., Clason, C., Bååth Jacobsson, S., Bergström Nilsson, S. & Sund, V. (2013). Klimatavtryck av insatsvaror i jordbruket – ungnöt, smågrisar, gyltor och strömedel. Climate footprint of agricultural inputs – young cattle, piglets, gilts and litter. Rapport från Hushållningssällskapet Halland, Eldsberga, Sweden.
- Blonk Consultants. (2018). Agri-footprint 4.0. http://www.agri-footprint.com/.
- Castanheira, E. G. & Freire, F. (2013). Greenhouse gas assessment of soybean production: implications of land use change and different cultivation systems. Journal of Cleaner Production 54, 49–60. doi:10.1016/j.jclepro.2013.05.026
- Cederberg, C., Henriksson, M. & Berglund, M. (2013). An LCA researcher’s wish list – data and emission models needed to improve LCA studies of animal production. Animal 7(s2), 212–219. doi:10.1017/S1751731113000785
- Cederberg, C., Henriksson, M. & Rosenqvist, H. (2018). Ekonomi och ekosystemtjänster i gräsbaserad mjölk- och nötköttsproduktion. Economy and Ecosystem Services in Grass-Based Dairy and Beef Production (Gothenburg: Chalmers University of Technology).
- Darnhofer, I. (2014). Resilience and why it matters for farm management. European Review of Agricultural Economics 41, 461–484. doi:10.1093/erae/jbu012
- Davis, K. F., Gephart, J. A., Emery, K. A., Leach, A. M., Galloway, J. N. & D’Odorico, P. (2016). Meeting future food demand with current agricultural resources. Global Environmental Change 39, 125–132. doi:10.1016/j.gloenvcha.2016.05.004
- EDA. (2018). Product Environmental Footprint Category Rules for Dairy Products. Version 1.0.25 April 2018. The European Dairy Assoc., Bruxelles, Belgium. http://ec.europa.eu/environment/eussd/smgp/pdf/PEFCR-DairyProducts_2018-04-25_V1.pdf.
- Eggleston, G. & Lima, I. (2015). Sustainability issues and opportunities in the sugar and sugar-bioproduct industries. Sustainability 7, 12209–12235. doi:10.3390/su70912209
- Eisler, M. C., Lee, M. R. F., Tarlton, J. F., Martin, G. B., Beddington, J., Dungait, J. A. J., Greathead, H., Liu, J. X., Mathew, S., Miller, H., Misselbrook, T., Murray, P., Vinod, V. K., Van Saun, R. & Winter, M. (2014). Agriculture: Steps to sustainable livestock. Nature 507, 32–34.
- EU. (1991). Council Directive of 12 December 1991 concerning the protection of waters against pollution caused by nitrates from agricultural sources (91/676/EEC), Brussels, Belgium https://eur-lex.europa.eu/legal-content/sv/TXT/?uri=celex%3A31991L0676.
- FAO. (2016). Environmental Performance of Large Ruminant Supply Chains: Guidelines for Assessment (Rome: FAO).
- FAO. (2010). Livestock in the Balance: The State of Food and Agriculture 2009 (Rome: FAO). https://doi.org/10.5860/CHOICE.46-5950).
- FAO. (2016). Environmental Performance of Large Ruminant Supply Chains: Guidelines for Assessment. Livestock Environmental Assessment and Performance Partnership (Rome: FAO).
- Fargione, J., Hill, J., Tilman, D., Polasky, S. & Hawthorne, P. (2008). Land clearing and the biofuel carbon debt. Science 319(5867), 1235–1238. doi:10.1126/science.1152747
- FEFAC. (2021). Feed & food 2020. https://fefac.eu/wp-content/uploads/2021/03/FF_2020_Final.pdf.
- Flysjö, A., Cederberg, C. & Strid, I. (2008). LCA-databas för konventionella fodermedel - miljöpåverkan i samband med produktion. LCA Database for Conventional Feeds - Environmental Impact in Connection with Production (Gothenburg: SIK).
- Flysjö, A., Henriksson, M., Cederberg, C., Ledgard, S. & Englund, J.-E. (2011). The impact of various parameters on the carbon footprint of milk production in New Zealand and Sweden. Agricultural Systems 104(6), 459–469.
- Foley, J. A., Ramankutty, N., Brauman, K. A., Cassidy, E. S., Gerber, J. S., Johnston, M., Mueller, N. D., O’Connell, C., Ray, D. K., West, P. C., Balzer, C., Bennett, E. M., Carpenter, S. R., Hill, J., Monfreda, C., Polasky, S., Rockström, J., Sheehan, J., Siebert, S., Tilman, D. & Zaks, D. P. M. (2011). Solutions for a cultivated planet. Nature 478, 337–342.
- Garnsworthy, P. C. (2004). The environmental impact of fertility in dairy cows: a modelling approach to predict methane and ammonia emissions. Animal Feed Science and Technology 112, 211–223. 10.1016/j.anifeedsci.2003.10.011
- Henriksson, M., Cederberg, C. & Swensson, C. (2014). Carbon footprint and land requirement for dairy herd rations: impacts of feed production practices and regional climate variations. Animal 8(8), 1329–1338.
- Henriksson, M., Flysjö, A., Cederberg, C. & Swensson, C. (2011). Variation in carbon footprint of milk due to management differences between Swedish dairy farms. Animal 5(9), 1474–1484. doi:10.1017/S1751731111000437
- Hessle, A., Bertilsson, J., Stenberg, B., Kumm, K.-I. & Sonesson, U. (2017). Combining environmentally and economically sustainable dairy and beef production in Sweden. Agricultural Systems 156, 105–114. doi:10.1016/j.agsy.2017.06.004
- Hristov, A. N., Ott, T., Tricarico, J., Rotz, A., Waghorn, G., Adesogan, A., Dijkstra, J., Montes, F., Oh, J., Kebreab, E., Oosting, S. J., Gerber, P. J., Henderson, B., Makkar, H. P. S. & Firkins, J. L. (2013). Special topics – mitigation of methane and nitrous oxide emissions from animal operations. III. A review of animal management mitigation options1. Journal of Animal Science 91(11), 5095–5113. 10.2527/jas.2013-6585
- Huhtanen, P., Nousiainen, J. I., Rinne, M., Kytölä, K. & Khalili, H. (2008). Utilization and partition of dietary nitrogen in dairy cows fed grass silage-based diets. Journal of Dairy Science 91, 3589–3599. doi:10.3168/jds.2008-1181
- Hunter, M. C., Smith, R. G., Schipanski, M. E., Atwood, L. W. & Mortensen, D. A. (2017). Agriculture in 2050: recalibrating targets for sustainable intensification. Bioscience 67, 386–391. doi:10.1093/biosci/bix010
- Hushållningssällskapet. (2017). Produktionsgrenskalkyler för Växtodling, Efterkalkyler för år 2016 – Södra Sverige. Production Calculations for Plant Cultivation, Post-Calculations for the Year 2016 – Southern Sweden (Uppsala: Hushållningssällskapet).
- IDF. (2015). A common carbon footprint approach for the dairy sector – The IDF guide to standard life cycle assessment methodology. Bulletin of the International Dairy Federation. Bruxelles. https://fil-idf.org/wp-content/uploads/2016/09/Bulletin479-2015_A-common-carbon-footprint-approach-for-the-dairy-sector.CAT.pdf.
- IPCC. (2006). Guidelines for National Greenhouse Gas Inventories, Chapter 11: N2O Emissions from Managed Soils and CO2 Emissions from Lime and Urea Application. Prepared by the National Greenhouse Gas Inventories Programme, Eggleston H.S., Buendia, L., Miwa K. IGES, Japan.
- IPCC. (2019). Summary for Policymakers. In: Climate Change and Land: an IPCC special report on climate change, desertification, land degradation, sustainable land management, food security, and greenhouse gas fluxes in terrestrial ecosystems. [P.R. Shukla, J. Skea, E. Calvo Buendia, V. Masson-Delmotte, H.-O. Pörtner, D. C. Roberts, P. Zhai, R. Slade, S. Connors, R. van Diemen, M. Ferrat, E. Haughey, S. Luz, S. Neogi, M. Pathak, J. Petzold, J. Portugal Pereira, P. Vyas, E. Huntley, K. Kissick, M. Belkacemi, J. Malley, (eds.)]. In press.
- Karlsson, J., Spörndly, R., Lindberg, M. & Holtenius, K. (2018). Replacing human-edible feed ingredients with by-products increases net food production efficiency in dairy cows. Journal of Dairy Science 101, 7146–7155. doi:10.3168/jds.2017-14209
- Klackenberg, L. (2021). Biomethane in Sweden – market overview and policies. Swedish Gas Association, pp. 8. https://www.energigas.se/media/boujhdr1/biomethane-in-sweden-210316-slutlig.pdf.
- Lathuillière, M. J., Miranda, E. J., Bulle, C., Couto, E. G. & Johnson, M. S. (2017). Land occupation and transformation impacts of soybean production in Southern Amazonia, Brazil. Journal of Cleaner Production 149, 680–689. doi:10.1016/j.jclepro.2017.02.120
- Maskinkalkylgruppen & HIR-Skåne. (2017). Maskinkostnader 2017, underlag och kalkylexempel för lantbruksmaskiner. Machine Costs 2017, Data and Examples for Agricultural Machines (Bjärred: Maskinkalkylgruppen).
- Mogensen, L., Knudsen, M. T., Dorca-Preda, T., Nielsen, N. I., Kristensen, I. S. & Kristensen, T. (2018). Bæredygtighedsparametre for konventionelle fodermidler til kvæg – metode og tabelværdier. Sustainability Parameters for Conventional Feeds for Cattle – Method and Table Values. DCA Rapport Nr. 116 (Aarhus: Aarhus University). https://dcapub.au.dk/djfpublikation/djfpdf/DCArapport116.pdf).
- Mottet, A., de Haan, C., Falcucci, A., Tempio, G., Opio, C. & Gerber, P. (2017). Livestock: On our plates or eating at our table? A new analysis of the feed/food debate. Global Food Security 14, 1–8. doi:10.1016/j.gfs.2017.01.001
- Muscat, A., de Olde, E. M., de Boer, I. J. M. & Ripoll-Bosch, R. (2020). The battle for biomass: A systematic review of food-feed-fuel competition. Global Food Security 25, 100330. doi:10.1016/j.gfs.2019.100330
- Myhre, G., Shindell, D., Bréon, F.-M., Collins, W., Fuglestvedt, J., Huang, J., Koch, D., Lamarque, J.-F., Lee, D., Mendoza, B., Nakajima, T., Robock, A., Stephens, G., Takemura, T. & Zhang, H. (2013). Anthropogenic and natural radiative forcing. In T. F. Stocker, D. Qin, G.-K. Plattner, M. Tignor, S. K. Allen, J. Boschung, A. Nauels, Y. Xia, V. Bex & P. M. Midgley (eds.) Climate Change 2013: The Physical Science Basis: Contribution of Working Group I to the Fifth Assessment Report of the Intergovernmental Panel on Climate Change (Cambridge: Cambridge University Press). pp. 659–740.
- Nielsen, N. I., Volden, H., Åkerlind, M., Brask, M., Hellwing, A. L. F., Storlien, T. & Bertilsson, J. (2013). A prediction equation for enteric methane emission from dairy cows for use in NorFor. Acta Agriculturae Scandinavica, Section A – Animal Science 63(3), 126–130.
- Nordqvist, M. (2012). Assessing phosphorus overfeeding in dairy cows. Licenciate Thesis. Report 279. Department of Animal Nutrition and Management. Swedish University of Agricultural Sciences.
- Oishi, K., Kumagai, H. & Hirooka, H. (2011). Application of the modified feed formulation to optimize economic and environmental criteria in beef cattle fattening systems with food by-products. Animal Feed Science and Technology 165, 38–50.
- PEFCR. (2018). Product Environmental Footprint Category Rules (PEFCR) Feed for food producing animals. First public version 4.1, April 2018. Bruxelles, Belgium. http://ec.europa.eu/environment/eussd/smgp/pdf/PEFCR_feed.pdf.
- Poore, J. & Nemecek, T. (2018). Reducing food's environmental impacts through producers and consumers. Science 360(6392), 987–992. doi:10.1126/science.aaq0216
- RISE. (2013). Livscykelanalys av foder med klimatavtryck. Life Cycle Analysis of Feed with Climate Footprint (Gothenburg: RISE). https://lcadatafoder.se/).
- SEPA. (2019). Swedish Environmental Protection Agency (SEPA). National Inventory Report Sweden 2019. Greenhouse Gas Emission Inventories 1990-2017. Submitted under the United Nations Framework. Convention on Climate Change and the Kyoto Protocol, Stockholm, Sweden.
- Sjaunja, L. O., Baevre, L., Junkkarinen, L., Pedersen, J. & Setälä, J. (1990). A Nordic proposal for an energy corrected milk (ECM) formula, in: Performance Recording of Animals: 27th Biennial Session of the International Committee for Animal Recording. Paris, France, 156–192.
- Spörndly, R. (2003). Fodertabeller för idisslare. Feed tables for ruminants. Rapport 257. Institutionen för husdjurens utfodring och vård (Uppsala: Swedish University of Agricultural Sciences).
- Spörndly, R. (unpublished observations). Mål för foderkvalitet. Skördeuppskattning. Ensilering. Measures for feed quality. Crop estimates. Ensiling. https://adm.greppa.nu/download/18.28b36abe16527b8975b3a861/1545315881879/mal-for-foderkvalitet-skordeuppskattning-ensilering-rolf-sporndly-160914-15.pdf
- Swedish Board of Agriculture. (2004). Statens jordbruksverks föreskrifter om miljöhänsyn i jordbruket vad avser växtnäring; SJVFS 2004:62. Regulations on environmental considerations in agriculture with regard to plant nutrition. Jönköping, Sweden.
- Swedish Board of Agriculture. (2017). Jordbruksverkets statistikdatabas. Statistics. Yield per hectar Total Prod. Reg. Differ. Crop. Yrly. data 1965–2019. https//www.statistikdatabasen.scb.se/pxweb/en/ssd/START__JO__JO0601/SkordarL/. http://statistik.sjv.se/PXWeb/pxweb/sv/Jordbruksverketsstatistikdatabas/
- Swedish Board of Agriculture. (2019). VERA beräkningsverktyg för gårdens resurser och miljöpåverkan. Calculation tool for farm resources and environmental impact. http://www.jordbruksverket.se/amnesomraden/odling/vaxtnaring/berakningsverktygetvera.
- Swedish Energy Agency. (2020). Drivmedel 2019. Redovisning av rapporterade uppgifter enligt drivmedelslagen, hållbarhetslagen och reduktionsplikten. Fuel 2019. Reported information in accordance with the fuels act, the sustainability act and the reduction obligation. ER 2020:26, pp. 18. https://energimyndigheten.a-w2m.se/Home.mvc?ResourceId=179961
- van Zanten, H. H. E., Herrero, M., van Hal, O., Röös, E., Muller, A., Garnett, T., Gerber, P. J., Schader, C. & de Boer, I. J. M. (2018). Defining a land boundary for sustainable livestock consumption. Global Change Biology 24(9), 4185–4194. doi:10.1111/gcb.14321
- van Zanten, H. H. E., Mollenhorst, H., de Vries, J. W., van Middelaar, C. E., van Kernebeek, H. R. J. & de Boer, I. J. M. (2014). Assessing environmental consequences of using co-products in animal feed. The International Journal of Life Cycle Assessment 19, 79–88. doi:10.1007/s11367-013-0633-x
- van Zanten, H. H. E., Mollenhorst, H., Klootwijk, C. W., van Middelaar, C. E. & de Boer, I. J. M. (2016). Global food supply: land use efficiency of livestock systems. The International Journal of Life Cycle Assessment 21, 747–758. doi:10.1007/s11367-015-0944-1
- Växa Sverige. (2017). Husdjursstatistik (Uppsala: Cattle Statistics).
- Volden, H. (2011). NorFor – The Nordic Feed Evaluation System. EAAP publication No 130. Volden (Ed.). Wageningen Academic Publishers, The Netherlands. doi:10.3920/978-90-8686-718-9.