Abstract
The ability of demand-driven fertilization, based on the growth potential provided by solar radiation and temperature, to regulate golf turf characteristics such as growth rate, leaf nitrogen (N) concentration, carbohydrate storage and playing quality was investigated in a 2-year field experiment at Landvik, Norway. Three N regimes (100, 60 and 40% of the estimated N requirement for maximum growth) were applied on a sand-based green with a turf cover consisting of creeping bentgrass, colonial bentgrass, velvet bentgrass, slender creeping red fescue or chewings fescue. In the 100% treatment, this corresponded to 3 (creeping bentgrass), 2.1 (colonial and velvet bentgrass) and 1.5 (chewings and slender creeping red fescue) kg N 100 m−2 yr−1. The weekly liquid fertilizer dose basically followed the potential growth curve provided by solar radiation and temperature from early April to late October. The turf was exposed to artificial wear and daily maintenance followed conventional standards. Growth, leaf N concentration, carbohydrate storage in clippings, green appearance and playing quality were determined once per month. The results indicated that solar radiation and temperature can successfully be used as driving variables when quantifying turf fertilizer requirements from early spring to late autumn. The desired leaf N concentration, i.e. growth rate, and the resulting effects on fructan content and playing quality can be achieved by raising or lowering the seasonal fertilizer curve. A leaf N level of 3.1–3.5% was indicated as the lower limit for producing healthy-looking turf with high playing quality.
Abbreviations
| Bco | = |
colonial bentgrass |
| Bcr | = |
creeping bentgrass |
| Bve | = |
velvet bentgrass |
| DM | = |
dry matter |
| Fcr | = |
slender creeping fescue |
| Fch | = |
chewings fescue |
| LSD | = |
least significant difference. |
Introduction
Fertilization strategies for golf courses have evolved from agriculture, where soil analysis is a highly recommended and frequently used tool to estimate additional nutrient requirements. However, modern greens constructed according to United States Golf Association (USGA) standards have few similarities with agricultural soils (United States Golf Association Citation1993). The high sand content reduces the nutrient-holding capacity and therefore makes USGA standard greens prone to leaching (Brown et al. Citation1977, Johnston and Golob Citation2002, Hull and Liu Citation2005). Storage fertilization of golf greens must therefore be avoided by adding nutrients in small and repeated doses. Weekly application of liquid fertilizer to golf greens is now common practice in Sweden. However, the shape of the nutrient supply curve varies between golf courses and there seems to be no consensus on how to best match the nutrient needs of the turf throughout the growing season.
Previous studies on agricultural crops and woody plant species have revealed a strong and positive relationship between light interception and plant growth (Monteith Citation1977, Linder Citation1985, Cannell et al. Citation1988). Thus available light energy during the growing season plays a central role in determining the growth potential of a plant and hence its nutrient needs. The prevailing temperature is also crucial, controlling the rate of carbohydrate production and utilization (Larcher Citation1995). In Scandinavia and areas with a similar climate, temperature is the major growth constraint in early spring, while shortage of light limits photosynthesis, and hence growth, in the autumn. As a consequence, the nutrient requirements of plants grown in a cold temperate climate increase progressively from early spring and reach a maximum around midsummer, before decreasing thereafter as a result of shortening daylength. In warmer climates, however, turf grass growth and nutrient requirements generally decrease during hot summer periods (Turgeon Citation2002). This is due to partial stomata closure, which affects CO2 uptake negatively and promotes photorespiration (Larcher Citation1995). The fertilizer requirement of turf grass is therefore a combined function of the growth capacity of the grass species and the light and temperature available at the site.
The information given in greenkeeping literature on different nutrient requirements is difficult to utilize when constructing a fertilizer curve. There are major discrepancies between studies with regard to adequate ranges of N and other nutrients for commonly used high-maintenance turf grasses (Jones Citation1980, Smith et al. Citation1985, Mills and Jones Citation1996). However, Ingestad and Lund (1986), Ingestad (1987, 1988), and Ingestad and Ågren (1988) have shown that the relative proportions of nutrients taken up during vegetative growth are surprisingly similar, irrespective of plant type (annual, perennial, herbaceous or woody). A literature survey carried out by Knecht and Göransson (Citation2004) comprising more than 300 plant species confirmed that nutrient ratios in terrestrial plants are strikingly similar. Thus there is no apparent reason why turf grasses should behave differently with regard to their nutrient requirements. When a balanced fertilizer containing all the essential nutrients (Ingestad and Lund Citation1986) is used for each fertilizer application from early spring to late autumn, the role of sand-based soil as a nutrient reservoir and supplier diminishes in importance, as does the need for soil analysis when constructing fertilizer programmes. By allowing the desired growth rate of the turf to control the nutrient supply to golf greens, nutrient leaching can be reduced to a minimum. Results from a 2-year pilot study with creeping bentgrass based on this fertilization approach showed that the weekly N additions to a sand-based green matched the N removal in clippings (Ericsson Citation2005).
Ingestad and co-workers have also shown that demand driven fertilization, i.e. matching nutrient supply to the requirements associated with the desired growth rate, makes it possible to control the N concentration of plants, a characteristic that has a strong impact on growth rate (Ingestad and Lund Citation1986, Ericsson et al. Citation1992), shoot:root ratio (Ingestad and Ågren Citation1988, Ericsson et al. Citation1996), leaf morphology (McDonald et al. Citation1992) and carbohydrate storage (McDonald et al. Citation1986), all important traits of turf grasses. Consequently, there are theories and techniques to control growth and other plant characteristics of turf grass in a predictable and desirable manner, but to our knowledge these have not been scientifically verified. Therefore, we conducted two studies, one in a growth chamber and one in the field, with creeping bentgrass, velvet bentgrass, colonial bentgrass, slender creeping red fescue and chewings fescue. The overall aim was to develop recommendations for demand-driven fertilization of turf and thereby create a more environmentally friendly and economical fertilization regime.
The growth chamber study confirmed that turf grasses do not deviate in any major respect from other plant species with regard to the influence of leaf N concentration on growth-related processes (Ericsson et al. Citation2012). Thus, irrespective of whether fast growth is desired in order to repair damage, or slower growth in order to improve playing quality, achieving the appropriate leaf N concentration and maintaining this N level throughout the growing season are crucial for turf development. The growth chamber study also showed that a leaf N concentration of 3.1–3.5% of DM is sufficient for achieving a healthy turf of fescues or bentgrasses, while the leaf N concentration at maximum growth is 5.1% for fescues and 5.9% for bentgrasses (Ericsson et al. Citation2012).
In the field study, which is described in this paper, we examined the possibility of using incoming solar radiation and temperature as driving variables for quantifying fertilizer requirement and hence achieving a stable leaf N concentration throughout the growing season. The following hypotheses were tested: (1) solar radiation and air temperature determine the shape of the fertilizer curve from early spring to late autumn; (2) leaf N concentration, a strong determinant of turf grass appearance, growth, carbohydrate storage and playing quality, can be continuously controlled by demand-driven fertilization; and (3) it is possible to grow healthy turf grass under growth-limiting N conditions if all nutrients are kept in a constant ratio to N.
Materials and methods
Experimental site and treatments
The experiment was carried out at the Bioforsk turf grass research station in Landvik, Grimstad, Norway (58° 19′ N; 8° 30′ E), on a sand-based green constructed in summer 2007 according to USGA recommendations and containing 1% organic material in the form of peat (United States Golf Association Citation1993). Five turf grass species were sown separately in triplicate 1.5 m×3 m plots in late August 2007. These were: creeping bentgrass (Bcr, Agrostis stolonifera L. var. ‘Independence’), velvet bentgrass (Bve, A. canina L. var. ‘Legendary’), colonial bentgrass (Bco, A. capillaris L. var. ‘Barking’), chewings fescue (Fch, Festuca rubra ssp. commutata L. var. ‘Center’) and slender creeping red fescue (Fcr, F. rubra ssp. trichophylla L. var. ‘Cezanne’). The experiment was laid out as split-block crossover design comprising the five grass species and three fertilization treatments, giving 45 plots in all. A total of 1.3 kg N 100 m−2 yr−1, together with macro and trace elements, was added during 2007.
The liquid fertilizer used on the experimental plots contained all essential nutrients in the proportions reported to be optimal for plants according to Ingestad and Lund (Citation1986) (). The fertilizer was given at weekly intervals from early April to late October in all years ().
Figure 1. Mean weekly temperature (°C; straight line) and mean weekly global radiation per day (MJ m−2 day−1; dashed line) during the experimental period in a) 2008 and b) 2009 at Bioforsk research station, Landvik, Norway, and the N fertilization curve at 100% level for creeping bentgrass (kg N 100 m−2 week−1; dotted line). The grey dotted line in (b) shows the planned fertilization curve, which was deviated from due to reduced plant growth. Dates above the triangles show the sampling dates.
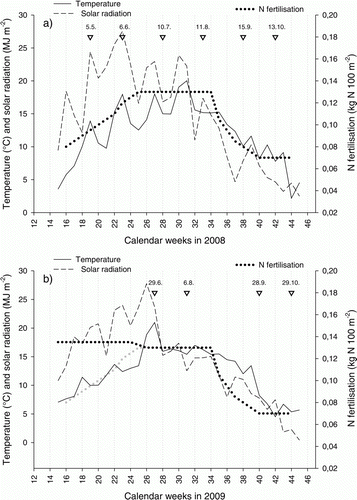
Table I. Nutrient proportions by weight (N = 100) in the liquid fertilizer (Wallco 51-10-43 + microa).
The N requirement of the five grass species was assumed to follow the growth performance ranking determined in the preceding growth chamber study (Ericsson et al. Citation2012, ) and in a pilot investigation (Agrostis stolonifera, unpublished data). A pilot experiment at Fullerö GK, Västerås, Sweden (59° 40′ N, 16° 30′ E) in 2003–2004 showed that creeping bentgrass ‘Penn A-4’ requires in the order of 2.7 kg N 100 m−2 yr−1 for maximum growth (Ericsson Citation2005). The corresponding value at Landvik was set to 3 kg N 100 m−2 yr−1 to compensate for the slightly milder climate compared with Fullerö. To test the effect of demand-driven fertilization, three levels of N supply were studied, 100%, 60% and 40% of the estimated N requirement at maximum growth rate (). Extra fertilizer comprising 0.82, 1.15 and 1.48 kg N 100 m−2 was supplied in the 100%, 60% and 40% treatments, respectively, regardless of species, in the period 4 April–17 June 2009 to compensate for unacceptably low N availability during 2008 ().
Table II. Ranking order with regard to nitrogen (N) requirement at maximum growth rate (Ericsson et al. Citation2012) and amount of N (kg N per 100 m−2 yr−1) supplied to the different turf grass species at the three intensity levels of N supply tested (100%, 60% and 40% of the N requirement at maximum growth).
The long-term (30-yr) daily mean temperature at Landvik exceeds 5 °C between April–October and a monthly mean maximum temperature of 16.2 °C is reached in July. April is the driest month, with mean precipitation of 58 mm. From May onwards, precipitation progressively increases and reaches a mean maximum of 162 mm in October. The temperature during the study period followed these long-term trends (). However, solar radiation and temperature at time of sampling in July 2008 were lower than in June. Precipitation deviated strongly in August 2008 (250 mm compared with the long-term monthly mean for August of 113 mm) and in July 2009 (244 mm compared with the long-term monthly mean for July of 92 mm). This was the result of a few, very intensive rain storms.
The experimental greens were managed according to the general golf course regime at Landvik, with irrigation, sand dressing, aeration and verticutting. The grass was mown three times a week to a height of 5–7 mm for the fescues and 3–5 mm for the bentgrasses, with the higher mowing heights in spring and autumn. Clippings were always collected. The experimental plots were exposed to artificial wear twice per week.
Measurements and chemical analyses
Turf colour, shoot density and overall impression were graded on a scale from 1 to 6 at monthly intervals (Horst et al. 1983). Turf cover and disease incidence were recorded as a percentage of plot area. Clippings were sampled once per month (5 May, 6 June, 10 July, 11 Aug., 15 Sept., 13 Oct. in 2008 and 29 June, 6 Aug., 28 Sept. and 29 Oct. in 2009) from a 1.25 m2 sub-area within each plot and used to determine daily growth (). The samples were dried at 70 °C for 3 days, sieved free from sand and weighed. The nitrogen concentration in clippings was determined with an elemental analyser (CN2000, LECO Corporation, USA). The macronutrients K, P, Ca, Mg and S were analysed in samples taken in August 2009 by inductively coupled plasma spectrometry (ICPS; Jobin Yvon JY-70 Plus, Longjumeau, France). Non-structural carbohydrates in clippings were determined in 2009 using the two-step extraction procedure described by Steen and Larsson (Citation1986). Glucose, fructose and sucrose were determined in the first extraction step and residual fructans in the second. Ball roll speed was measured three times in 2009 (4 Aug., 19 and 27 Sept.) using a 37.5 cm long modified USGA stimpmeter (Gaussoin Citation1995).
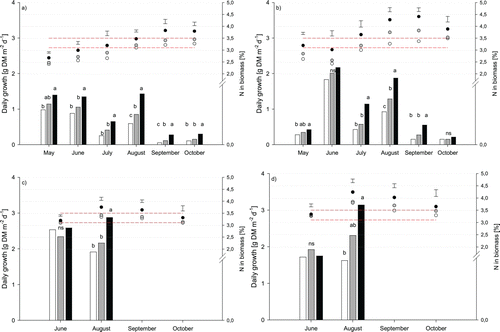
Figure 2. Daily growth (bars) and leaf N concentration (dots) in fescues (a, c, mean of chewings fescue and slender creeping red fescue) and bentgrasses (b, d, mean of colonial bentgrass, velvet bentgrass and creeping bentgrass) grown at three fertilization intensities (40% (white), 60% (grey) and 100% (black) of the N requirement at maximum growth) during 2008 and 2009. Dashed horizontal lines represent the lowest leaf N concentration range associated with healthy looking turf.
Statistical analysis
The general linear model procedure (GLM) of the statistical analysis system (SAS) was used to analyse the variance (Version 9.2, SAS Institute, Cary, NC). The significance of differences between different fertilization intensities and species was estimated using the Tukey test. Assumptions of normal distribution and variance homogeneity were tested graphically using residual plots. Regressions between leaf N concentration and leaf biomass were made using SigmaPlot (Version 12.0, Systat Software Inc., San Jose, CA).
Results
Turf appearance
The turf did not develop satisfactorily during the first half of 2008. Irrespective of turf grass species, colour, shoot density and overall impression did not reach the scores associated with high-quality turf (data not shown). All three bentgrasses were heavily infected by take-all patch (Gaeumannomyces graminis), with the severity of infection increasing with decreasing N supply. Turf appearance improved during the second half of 2008, but signs of fungal attack were still clearly visible, particularly for the 40% and 60% fertilizer treatments at the end of the growing season. The grasses did not fully recover from the fungal attacks even after the extra nutrients supplied in spring 2009. Low shoot density in the 40% treatment also negatively affected the overall appearance of the bentgrasses, while the 60 and 100% treatments were acceptable from August 2009 onwards. The overall appearance of the fescue greens was acceptable at all three rates of fertilization from August 2009 onwards.
Growth and leaf N concentration
In contrast to the expected growth curve, a bimodal growth pattern, with peaks in June and August, was observed in 2008, particularly among the bentgrasses (b). The fescues grew more vigorously in May than the bentgrasses (a) but, irrespective of species, the amount of clippings declined in July. In 2009, too many values were missing due to pronounced sand contamination to allow the growth pattern to be compared over the season.
Biomass growth reacted positively and mostly significantly to fertilization intensity (). However in June 2009, directly after application of the extra nutrients, there were no differences between the fertilization treatments. Leaf N concentration also reacted positively and significantly to fertilization intensity, but with a lower response than expected. The leaf N concentration of the fescues exceeded 3.5% for the 100% treatment four times during the experimental period (September and October 2008 and August and September 2009) (a and c). In early 2008, leaf N concentration of the fescues was below 3.1% for all fertilization treatments. Leaf N concentration of the bentgrasses during the experimental period was generally within or above the limit for healthy turf in all fertilization treatments (b and d), except in early 2008. The highest leaf N concentration recorded during 2008 occurred in the 100% treatment in September (3.8% for fescues and 4.4% for bentgrasses). The corresponding values measured in the 40% treatment were 3.2% and 3.4%, respectively. The highest leaf N concentrations in 2009 occurred in the 100% treatment in August (3.8% in fescues and 4.2% in bentgrasses). The corresponding values in the 40% treatment were 3.3% and 3.8%, respectively (c, d).
Despite the unsatisfactory appearance of the turf, shoot growth responded in the predicted manner to leaf N concentration. Fescue shoot growth and leaf N concentration in fescue clippings were significantly and positively correlated for all sampling dates in 2008 (). The bentgrasses deviated from this pattern in May and June, but thereafter growth and leaf N concentration were strongly correlated. In 2009, correlations could only be calculated for June and August due to missing biomass values in other months and were significant only in August (). The slope of the regression line between clipping quantity and N concentration in clippings, i.e. the N productivity of the species (growth per unit time and unit N in the leaves), decreased from early spring to late autumn in the fescues (). The N productivity values of the bentgrasses showed less variation throughout the growing season of 2008 ().
Table III. Nitrogen productivity, i.e. slope of the regression between quantity of clippings and the corresponding leaf N concentration in fescues (chewings fescue (Fch) and slender creeping red fescue (Fcr)) and bentgrasses (creeping bentgrass (Bcr), colonial bentgrass (Bco) and velvet bentgrass (Bve)) during 2008 and 2009.
Water-soluble carbohydrates and playing quality
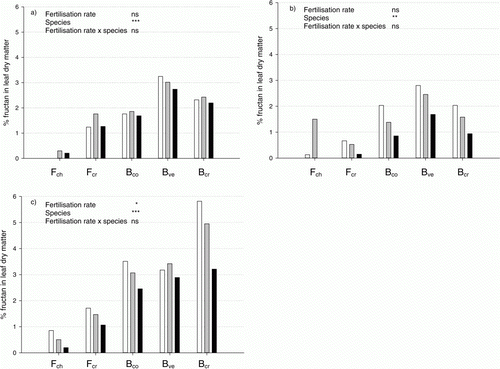
Fructans in clippings showed the strongest reaction to N supply of all water-soluble carbohydrates. Irrespective of species, the higher the rate of N supplied, the lower the fructan concentration in clippings (). This trend was observed for all three sampling dates in 2009 and was statistically significant in September (c). For the other carbohydrates (glucose, fructose and sucrose), no consistent relationship between concentration and N supply could be found. However, there were significant differences between species, with the fescues storing less fructans than the bentgrasses during the growing season ().
Figure 3. Content of fructans in dry matter of clippings in (a) June, (b) August and (c) September 2009 for chewings fescue (Fch), slender creeping red fescue (Fcr), colonial bentgrass (Bco), velvet bentgrass (Bve) and creeping bentgrass (Bcr) grown at three fertilization intensities (40% (white), 60% (grey) and 100% (black) of the N requirement at maximum growth). Significances (Tukey's test): *, **, *** at p < 0.05, 0.01 and 0.001 level, respectively; ns = not significant.
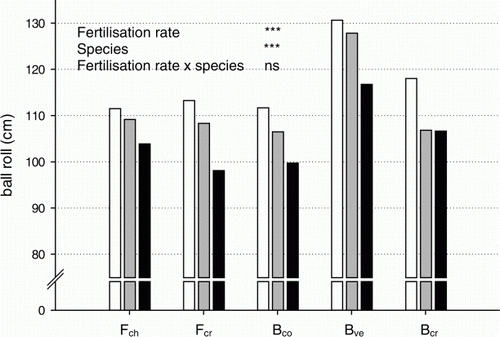
Ball roll was negatively correlated to N supply for all species (). Velvet bentgrass produced the significantly fastest turf (p < 0.0001), while differences in ball roll between the other species were not significant.
Figure 4. Ball roll in response to fertilization intensity (40% (white), 60% (grey) and 100% (black) of the N requirement at maximum growth) on a green with a turf cover consisting of chewings fescue (Fch), slender creeping red fescue (Fcr), colonial bentgrass (Bco), velvet bentgrass (Bve) and creeping bentgrass (Bcr). Mean of three measurements (4 Aug., 19 and 27 Sept.) in 2009. Significances (Tukey's test): *, **, *** at p < 0.05, 0.01 and 0.001 level, respectively; ns = not significant.
Nutrient proportions
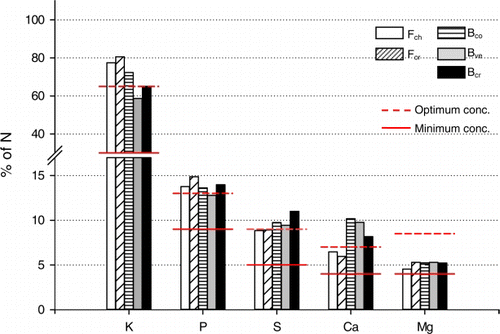
The relative proportions of macronutrients to N content (N = 100) were all within or above the range between minimum and optimum reported by Ingestad and Lund (Citation1986) (). The relative proportion of K to N was highest in fescue clippings, while bentgrasses tended to accumulate more Ca in leaf tissues. The corresponding proportions of P, S and Mg did not differ between species. Uptake of the macronutrients in excess of growth requirements was least pronounced for Mg.
Figure 5. Proportions by weight relative to nitrogen content (N = 100) of potassium (K), phosphorus (P), sulphur (S), calcium (Ca) and magnesium (Mg) in clippings from chewings fescue (Fch), slender creeping red fescue (Fcr), colonial bentgrass (Bco), velvet bentgrass (Bve) and creeping bentgrass (Bcr) collected in August 2009. Means of three fertilization regimes (40%, 60% and 100% of the N requirement at maximum growth). The upper dotted horizontal lines represent the leaf macronutrient proportions associated with non-limiting nutrient conditions. The lower solid lines represent the lowest possible proportion for achievement of maximum growth.
Discussion
Turf appearance
Turf appearance and N concentration in clippings () did not meet our expectations during the first half of 2008, irrespective of species and rate of N supply. Leaf N concentrations were mostly below the lowest acceptable range (3.1–3.5%) associated with healthy-looking turf according to our preceding growth chamber study (Ericsson et al. Citation2012). Leaf N concentration in the fescues and in the bentgrasses did not come close to the value associated with maximum growth (5.1 and 5.9%, respectively). Consequently, plant-available N in the beginning of 2008 was strongly growth-limiting, despite the fact that almost twice as much N was given in the 100% treatments as in the normal fertilization regime at Landvik turf grass research station (T. Aamlid, pers. comm. 2011). Immobilization of N and other plant nutrients by soil microorganisms is a plausible explanation for the N-deficient conditions (Pease et al. Citation2011). Significant leaching losses are also reported to occur during turf establishment (Bigelow et al. Citation2001). We conclude that the turf establishment period from late August to October 2007 was too short, and that the fertilizer supply of 1.31 kg N 100 m−2 yr−1 was not sufficient to create a well-established turf and functioning soil microbial flora.
The severe attack by take-all patch during 2008, particularly in the 40% and 60% treatments, was probably facilitated by the low levels of plant-available N, since this disease is favoured by N deficiency (Liu et al. Citation2008). The additional N supply in spring 2009 alleviated the fungal problem, but full recovery of the bentgrasses, particularly velvet bentgrass, was never achieved.
Solar radiation and temperature as determinants for growth and fertilization curve
In contrast to our expectations, growth in 2008, irrespective of turf grass species and fertilization treatment, did not peak in July () when incoming solar radiation is normally most abundant. However, the meteorological data showed a drop in both temperature and solar radiation at time of the July sampling (). Furthermore, the daily mean temperature 3–5 days prior to the July sampling stayed above 20 °C (data not shown). The latter incident may have negatively affected CO2 uptake in July and promoted photorespiration (Larcher Citation1995). This shows that measuring leaf growth only once a month is not sufficient to verify a pre-determined growth curve and can only yield short glimpses of the seasonal growth pattern. However, we chose to monitor growth in this way instead of concentrating our limited resources to a specific period of time.
For the present study, we used the same shape of growth curve and hence the same fertilization curve as in the pilot study in 2003–2004 at Fullerö golf course in Västerås, Sweden (Ericsson Citation2005), but with a total addition of 3.0 kg N 100 m−2 yr−1 instead of 2.7 kg N 100 m−2 yr−1. The only exception to the Fullerö curve was the extra nutrient applications in spring 2009 to adjust for the residual N stress in the turf from 2008. The precision of the fertilization regime could have been further improved by adjusting the shape of the curve to the general climate conditions at Landvik, and even further by adjusting the weekly nutrient addition to actual weather conditions by using clipping amounts as a calibrating tool. This type of adjustment is already being practised by greenkeepers in Sweden who have started to implement demand driven fertilization.
The difference between the generalized growth curve and actual climate-driven growth is what caused the variation in N concentration between samplings. During periods when actual growth was lower than the generalized curve, too much N was added and hence leaf N concentration increased, and vice versa. However, short-term weather fluctuations have only a minor effect on leaf N concentration when fertilizers are given at short intervals. The risk of exceeding the N uptake ability of the turf, and hence causing N leaching, is low as long as the growth capacity of the turf grass is not fully exploited.
Leaf N concentration as a determinant of growth, carbohydrate storage and playing quality
Despite the problems associated with turf appearance, it was possible to observe distinct differences in shoot growth, fructan storage and playing quality between treatments throughout both growing seasons (Figures ). Leaf N concentration and shoot growth were significantly correlated on most sampling occasions, irrespective of species (). By normalizing the N productivity values (slope of the regression curve; ), it was possible to compare the results from this study with those from the growth chamber study (Ericsson et al. Citation2012). In the latter, Bcr, Bve, Fch and Fcr scored 1, 0.67, 0.67 and 0.37 respectively with regard to their N productivity. This ranking formed the basis for constructing the fertilizer curves in the field study. However, the differences in growth between bentgrasses and fescues were small in the first year under field conditions and Bve instead of Fcr proved to be the least productive species. In August 2009, when the turf had satisfactorily recovered, the following ranking order was obtained: 1, 0.32, 0.44, 0.68 and 0.40 for Bcr, Bve, Bco, Fch and Fcr, respectively. The fungal attack on the bentgrasses, particularly on Bve, may offer a probable explanation for the change in ranking order and relative levels of N productivity, compared with the growth chamber study.
In the growth chamber study, N productivity values for the five turf grass species examined were calculated using average leaf N concentration over the entire study period and the sum of all clippings. In the field study, N productivity was determined for each sampling occasion separately and the data showed that N productivity was not constant over the growing period. Decreasing N productivity values can be expected after midsummer due to decreased light energy, as was seen for the fescues (). The absence of a clear trend for the bentgrasses was probably due to the growth disturbances caused by the fungal attacks.
High fructan levels have been shown to increase stress tolerance in plants. The increased fructan storage in clippings as a function of reduced N availability found in this study and the growth chamber study (Ericsson et al. Citation2012) followed the same pattern as shown for starch in other plant species (McDonald et al. Citation1986) (). Increased fructan storage throughout the growing season was also observed in a pilot field study with Bcr ‘Penn A-4’ in response to N limitation (Ericsson, Citation2005). Consequently, controlled suboptimal fertilization, i.e. demand-driven fertilization corresponding to a growth rate below the maximum, offers a tool to regulate the fructan concentrations of turf grass in a desirable manner. In addition, playing quality, in terms of ball roll, can be controlled by suboptimal demand-driven fertilization. Decreased leaf size, leaf width and leaf mass per unit leaf area (Specific Leaf Area, SLA) are typical plant reactions to N limitation (McDonald et al. Citation1992). A decrease in SLA means stiffer leaves, and thus faster ball roll. This effect was clearly seen in our study ().
Constant proportion of nutrients relative to N to meet turf requirements
The turf grasses showed no signs of deficiency of any macronutrient other than N, and nutrient proportions in clippings closely mirrored the composition of the fertilizer used ( and ). The measured macronutrient proportions corresponded to non-limiting nutrient conditions according to Ingestad and Lund (Citation1986) and none fell below the minimum proportion for achieving maximum growth according to Ericsson and Ingestad (Citation1988) and Ericsson and Kähr (Citation1993, Citation1995). These results show that fertilizers with a constant ratio of nutrients in relation to N can be used on turf grass throughout the growing season.
Field versus growth chamber studies
The growth chamber study showed that leaf N concentration between 3.1 and 3.5% DM was sufficient for achieving a healthy turf in both fescues and bentgrasses (Ericsson et al. Citation2012). In the field study, leaf N levels in the order of 3.5% seemed to be the lower limit to produce healthy-looking turf according to visual observations and playing quality tests (), although the turf never fully recovered from problems in the establishment phase and severe fungal attacks. Leaf N concentrations of 5–6%, as found at maximum growth rates in the growth chamber study, were never reached in the field study. This could possibly be attributed to too little N being applied during the establishment phase to support the simultaneous establishment of healthy grass and an associated microorganism pool in the soil.
Overall, our results show that short growth-chamber studies can be used to determine the N productivity of different turf grass species and that the values obtained can be transformed into recommendations for demand-driven fertilization under field conditions. The relative ranking of species was fairly consistent in the growth chamber and the field, although the productivity in absolute terms differed. Further field studies on established greens with controlled N immobilization are required to further test the response of turf grass species to different N intensities and thus develop more precise fertilization curves for demand-driven fertilization.
Validity of collected data
The appearance and quality of the turf have without doubt been affected by N-shortage, which was probably due to immobilization, and fungal attacks particularly throughout 2008. As a result increased rates of fertilizer were required to alleviate these problems and keep the leaf N concentrations at a suitable level. However, we see no reason to question the main message, that it is possible to control growth and playing conditions on golf greens by recognizing light and temperature as determining factors for nutrient demand, and hence determinants for realizing a suitable fertilizer curve for use during the growing season. We regard the presented values on leaf N and carbohydrate concentrations as valid since the samples used for analyses were mainly composed of clippings from the more healthy areas of the plots, i.e. the areas with only minor fungal infestations. Based on these assumptions, our hypothesis, that the growth rate, playing quality and ability of the turf to store carbohydrates can be controlled via the leaf N concentration, has been strengthened.
Conclusions
This field study verified that solar radiation and temperature can successfully be used as driving variables when quantifying the running fertilizer needs of turf grass from early spring to late autumn. The desired leaf N concentration, and hence growth rate, and the resulting effects on fructan content and playing quality, can be achieved by raising or lowering the seasonal fertilizer curve. As the nutrient composition of plant material appears to remain constant relative to N, nutrients can be added to turf grass in these fixed proportions throughout the growing season without causing deficiency problems, as long as the N supply is sufficient to achieve a leaf N concentration of between 3.1 and 3.5%.
Acknowledgements
Trond Olav Pettersen, Catrine Djurberg, Inger Juremalm and Börje Ericson are gratefully acknowledged for daily care of the experimental plots, sample preparation and nutrient and carbohydrate analyses. The investigation was financially supported by grants from the Scandinavian Turfgrass and Environmental Research Foundation (STERF) and the Departments of Urban and Rural Development and Soil and Environment at the Swedish University of Agricultural Sciences. Niblick Golf Design is gratefully acknowledged for financing construction of the experimental green.
References
- Bigelow , C. A. , Bowman , D. C. and Cassel , D. K. 2001 . Nitrogen leaching in sand-based rootzones amended with inorganic amendments and sphagnum peat . Journal of the American Society for Horticultural Science , 126 : 151 – 156 .
- Brown , K. W. , Duble , R. L. and Thomas , J. C. 1977 . Influence of management and season on fate of N applied to golf greens . Agronomy Journal , 69 : 667 – 671 .
- Cannell , M. G. R. , Sheppard , L. J. and Milne , R. 1988 . Light use efficiency and woody biomass production of poplar and willow . Forestry , 61 : 125 – 136 .
- Ericsson , T. 2005 . Effects of demand driven fertilisation on growth, appearance, and nitrogen use efficiency of turf grass . Available at: http://sterf.golf.se (In Swedish)
- Ericsson , T. and Ingestad , T. 1988 . Nutrition and growth of birch seedlings at varied relative phosphorus addition rates . Physiologia Plantarum , 72 : 227 – 235 .
- Ericsson , T. and Kähr , M. 1993 . Growth and nutrition of birch seedlings in relation to potassium supply rate . Trees , 7 : 78 – 85 .
- Ericsson , T. and Kähr , M. 1995 . Growth and nutrition of birch seedlings at varied relative addition rates of magnesium . Tree Physiology , 15 : 85 – 93 .
- Ericsson , T. , Rytter , L. and Linder , S. 1992 . “ Nutritional dynamics and requirements of short rotation forest ” . In Ecophysiology of short rotation forest crops , Edited by: Mitchell , C. P. , Ford-Robertson , J. B. and Sennerby-Forsse , L. 35 – 65 . London : Elsevier Applied Science .
- Ericsson , T. , Rytter , L. and Vapaavuori , E. 1996 . Physiology of carbon allocation in trees . Biomass and Bioenergy , 2 : 115 – 127 .
- Ericsson , T. , Blombäck , K. , & Neumann , A. 2012 . Demand-driven fertilization. Part I: Nitrogen productivity in four high-maintenance turf grass species . Acta Agriculturae Scandinavica, S1: Quality Turf and Efficient Utilization of Resources S113 S121
- Gaussoin , R. 1995 . A modified stimpmeter for small-plot turfgrass research . HortScience , 30 : 547 – 548 .
- Horst , G. L. , Engelke , M. C. and Mayers , W. 1983 . Assessment of visual evaluation techniques . Agronomy Journal , 76 : 619 – 622 .
- Hull , R. J. and Liu , H. 2005 . Turfgrass nitrogen: physiology and environmental impacts . International Turfgrass Society Research Journal , 10 : 962 – 975 .
- Ingestad , T. 1987 . New concepts on soil fertility and plant nutrition as illustrated by research on forest trees and stands . Geoderma , 40 : 237 – 252 .
- Ingestad , T. 1988 . A fertilisation model based on the concept of nutrient flux density and nutrient productivity . Scandinavian Journal of Forest Research , 3 : 157 – 173 .
- Ingestad , T. and Ågren , G. 1988 . Nutrient uptake and allocation at steady-state nutrition . Physiologia Plantarum , 72 : 450 – 459 .
- Ingestad , T. and Lund , A.-B. 1986 . Theory and techniques for steady state mineral nutrition and growth of plants . Scandinavian Journal of Forest Research , 1 : 439 – 453 .
- Johnston , W. J. and Golob , C. T. 2002 . Nitrogen leaching through sand-based golf greens . USGA Turfgrass Environment Research , 1 : 1 – 7 .
- Jones , J. R. 1980 . Turf analysis . Golf Course Management , 48 : 29 – 32 .
- Knecht , M. F. and Göransson , A. 2004 . Terrestrial plants require nutrients in similar proportions . Tree Physiology , 24 : 447 – 460 .
- Larcher , W. 1995 . Physiological plant ecology , Berlin : Springer Verlag .
- Linder , S. 1985 . “ Potential and actual production in Australian forest stands ” . In Research for forest management , Edited by: Landsberg , J. J. and Parsons , W. 11 – 35 . Melbourne : CSIRO .
- Liu , H. , Baldwin , C. M. , Luo , H. and Pessarakli , M. 2008 . “ Enhancing turfgrass nitrogen use under stresses ” . In Handbook of turfgrass management and physiology , Edited by: Pessarakli , M. 557 – 601 . Boca Raton , FL : CRC Press .
- McDonald , A. J. S. , Ericsson , A. and Lohammar , T. 1986 . Dependence of starch storage on nutrient availability and photon flux density in small birch (Betula pendula Roth.) . Plant Cell and Environment , 9 : 433 – 438 .
- McDonald , A. J. S. , Lohammar , T. and Ingestad , T. 1992 . Net assimilation rate and shoot area development in birch (Betula pendula Roth.) at different steady-state values of nutrition and photon flux density . Trees , 6 : 1 – 6 .
- Mills , H. A. and Jones , J. B. Jr . 1996 . Plant analysis handbook II , Athens , GA : Micro-Macro Publishing Incorporated .
- Monteith , J. L. 1977 . Climate and efficiency of crop production in Britain . Philosophical Transactions of Royal Society of London Series B , 281 : 277 – 294 .
- Pease , B. W. , Stier , J. C. , Hollman , A. B. , & Horgan , B. 2011 . Nitrogen fertility for establishment of velvet and creeping bentgrass fairways and tees . Applied Turfgrass Science May , 1 – 8
- Smith , G. S. , Cornforth , I. S. and Henderson , H. V. 1985 . Critical leaf concentrations for deficiencies of nitrogen, potassium, phosphorus, sulphur, and magnesium in perennial ryegrass . New Phytologist , 101 : 393 – 409 .
- Steen , E. and Larsson , K. 1986 . Carbohydrates in roots and rhizomes of perennial grasses . New Phytologist , 104 : 339 – 346 .
- Turgeon , A. J. 2002 . Turfgrass management , Englewood Cliffs , NJ : Prentice Hall .
- United States Golf Association 1993 . USGA Green Section Record . March/April 1993 .