Abstract
Although organic fertilizer sources are widely marketed for application to turfgrasses, there is limited research that examines their effect on turfgrass performance in the humid south-eastern United States. For this work, ‘organic’ refers to commercial fertilizers manufactured from wastes such as sewage sludge (biosolid), poultry byproducts (manure, litter, feather meal), or other byproducts (whey, meals, oils). Organic fertilizers can behave as a slow-release N fertilizer, with a delayed greening response, low burn potential, and varying N release rates in different environments. Three separate 3-month long studies (one creeping bentgrass, two hybrid bermudagrass) evaluated the effects of organic fertilizers on various turfgrass and soil parameters. The objectives of this research were to evaluate turfgrass response to organic fertilizers in the field by measuring turf colour, quality, clipping yield, N uptake, total soil microbial biomass, soil inorganic (NO3-N, NH4-N), and organic N and carbon content. Organic N sources included materials made from dehydrated biosolids, turkey litter, and meat, bone, blood and feather meal. These sources were compared with hybrid bermudagrass and bentgrass fertilized with urea or a commercial urea/methylene urea fertilizer. All N sources were applied one time each year at a rate of 4.9 g N m−2. Plots were moved to a new location in each year of the study. In general, application of sources with large portions (or 100%) of soluble N (urea and a urea/methylene urea blend) produced turf with a darker green colour, higher N content, and greater clipping yield than plots fertilized with materials containing organic N. Urea provided consistent high quality colour for the same 10–12 week period as the organic sources, and no organic source provided acceptable colour for any longer period than soluble N sources. There were few differences in soil N, C, or microbial biomass due to N source.
Introduction
Natural organic fertilizers are the oldest type of fertilizers known to man. Produced from animal or plants, these fertilizers are typically manufactured from the waste of animal processing (bone meal, blood meal, feather meal, rendering byproducts), animal production (manures, poultry litter), human bioproducts (biosolids) or plant materials (soybean extracts, mushroom composts, oilseed processing).
There are many available N sources that will sufficiently supply nutrients to turfgrass. These are often classified as inorganic soluble, synthetic organic soluble, synthetic organic slow release, and natural organic slow release. The most commonly used are inorganic soluble fertilizers. These generally release nutrients for immediate plant utilization, but nutrients may be vulnerable to environmental loss. Examples of inorganic soluble fertilizers are NH4NO3 and (NH4)2SO4. These fertilizers are often used to produce a rapid greening response or to help turf heal rapidly from damage, as the inorganic N is soluble and immediately available for plant uptake (Carrow Citation1997).
The soluble synthetic organic fertilizer urea is often used in turfgrass fertilization. Urea is organic because it contains C, but it is not commonly applied as a “true organic” fertilizer because it is manufactured synthetically. Urea offers a high nutrient analysis (46-0-0) and a rapid turf response that produces similar yields and colour response to that of NH4NO3 (Landschoot and Waddington Citation1987, Carrow Citation1997).
Synthetic organic slow-release products are classified as a physical or chemical slow release. Physical slow-release fertilizers contain resin coats or sulfur coats that degrade, releasing nutrients as a function of coat integrity (Peacock and DiPaola Citation1992). The release rate varies with the thickness and degradation properties of the resin coat (Hummel Citation1989). Nutrients are released when water moves by osmosis through the resin coat, and urea solution diffuses back out (Hummel Citation1989). Besemer (Citation1963) reported that bentgrass fertilized every 13 to 17 weeks with sulfur-coated urea offered similar turf quality to that of a monthly application of soluble fertilizers. Hummel and Waddington (Citation1984) found sulfur-coated urea pellets 3 years after application, which contained up to 26% of applied N. Hummel (Citation1989) found the highest N recoveries with sulfur-coated urea and resin-coated urea when compared with standard soluble urea and concluded that resin-coated ureas were an excellent choice for N supply. Synthetic chemical slow-release products, such as IBDU (isobutylenediurea) and methylene urea, release N by hydrolysis and microbial activity. Short-chain methylene ureas can provide a rapid initial colour response, but this varies with source (Carrow Citation1997).
Natural organic fertilizers contain C, but are derived from waste products (Christians Citation2004). Natural slow-release organics often provide plant-available N and other nutrients, including P, K, Ca, Mg and micronutrients (Eldridge et al. Citation2008). Besides offering a slow-release quality, these fertilizers reuse sources of potential waste products. Natural organic slow-release N products release nutrients more quickly as particle size decreases. Slow-release N products also have lower tissue burn potentials, so fewer applications at higher rates can be made, while providing a longer duration of N release. The inconsistency of N release from slow-release N products presents the need to study individual products to determine accurate fertilizer recommendations (Hummel and Waddington Citation1981).
Some organic N fertilizers have been shown to have disease-suppressing traits, allowing turf to outgrow disease problems (King and Torbert Citation2007). Organic fertilizers have been shown to reduce dollar spot severity as compared with the control (Davis and Dernoeden Citation2002), and they also reduced necrotic ring spot (Melvin and Vargas Citation1994, Guillard and Kopp Citation2004). Organic products contain C compounds, which increased soil bacterial populations within 4 days after treatment (Li Citation2005), although these findings conflict with others, who found no effect of organic fertilizers on microbial populations (Elliot and Des Jardin Citation1999). A study of bentgrass showed increased populations and increased microbial activity in plots treated with compost and sludge (Tian et al. Citation2008).
The slow-release properties of natural organic fertilizers may help reduce fertilizer N loss and may help reduce the factors (e.g., irrigation schedule, N source, rate and timing of application) that effect N loss (Kerek et al. Citation2003). Nitrates may be leached from soil, especially in sandy golf course greens (Mazur and White Citation1983). One study showed that plots fertilized with organic fertilizers contained 0.6 and 1.7% NO3−N of applied N in leachate, while plots receiving applications of NH4NO3 had 16.8% of applied N (as NO3-N) in leachate (Guillard and Kopp Citation2004).
A University of Florida study on St. Augustine grass showed equal or greater turfgrass response from dehydrated biosolid (Milorganite) or a urea/methylene urea blend (Scotts Turf Builder; The Scotts Company, LLC., Marysville, OH) when compared with other commercially available inorganic products (Cisar Citation2004). Alternatively, other research showed that organic fertilizers produced limited turf response, with high variability due to source (Landschoot and Waddington Citation1987, Peacock and Daniel Citation1992, Carrow Citation1997).
Thus, the literature which examines turfgrass responses to applications of natural organic fertilizers is somewhat limited, and observed results (longevity of turfgrass colour response, changes in soil characteristics) are variable and highly dependent on geographic region. Evaluations of turfgrass response to application of organic fertilizers are scant in the humid south-eastern United States. Thus, the objective of this research was to evaluate turfgrass response to organic fertilizers in the field by measuring turf colour, quality, clipping yield, N uptake, and soil inorganic N, soil organic C and N, and total microbial biomass. To do this three experiments were performed in 2009 and 2010, all of which evaluated turfgrass response to commercially available organic fertilizers.
Materials and methods
In 2009 and 2010, field studies were conducted at the Auburn University Turfgrass Research Unit (TGRU) located on the Auburn University campus. Studies were initiated on 18 Jan. 2010 (bentgrass), 27 April 2009 (bermudagrass) and 4 May 2010 (bermudagrass). The experiments were conducted on ‘Tifsport’ (2009) and ‘Tifway’ (2010) hybrid bermudagrass (Cynodon dactylon L.×Cynodon transvaalensis Burtt-Davy) fairways and a creeping bentgrass (Agrostis stolonifera L.) ‘Penn G-2’ putting green. Soil type for the bermudagrass studies was a Marvyn loamy sand (Fine-loamy, siliceous, thermic Typic Paleudult), while the bentgrass green was a 5-year-old sand/peat putting green. Initial soil tests for each experiment indicated that P and K were 40 and 100; 35 and 50; and 50 and 60 mg kg−1 for the bentgrass (2010), bermudagrass (2009) and bermudagrass (2010) experiments, respectively. Because these soil tests always placed P and K indices in the ‘High’ or ‘Very High’ soil test categories additional P and K fertilizer was not added, as a turfgrass response would not be observed to such fertilizer additions. Because responses to P or K fertilization are rarely seen on soil with P and K soil tests such as observed in this study no attempt was made to balance P and K application to uniformity – these were N-based studies. Soil pH for the research areas was 6.5 (bentgrass, 2010), 6.6 (bermudagrass, 2009) and 6.1 (bermudagrass, 2010). There were no N fertilizers applied to the research areas for one year prior to the application of treatments. Fungicide and pesticide treatments were used as needed and followed recommended guidelines.
Fertilizer treatments listed in were used in each study, plus an unfertilized control. Treatments were replicated four times in a randomized complete block design. Each study was mown prior to fertilizer application. Treatments were hand applied once at the dates given previously to 1.2×2.4 m plots at 4.9 g N m−2 and irrigated immediately (2.5 mm) after application. Bermudagrass studies were mown twice per week at a height of 2.2 cm with a Tru-Cut H-2C reel mower (Advanced Mower, Bessemer, AL). Once a week harvested clippings were removed for subsequent clipping yield and N analysis. Otherwise, clippings were left on the plot. The bentgrass was mown six of seven days with a walk-behind reel mower (Jacobsen, Textron Co.) at a height of 3.2 mm, with clippings removed at each mowing.
Table I. Fertilizer treatments used in the creeping bentgrass (2010) and hybrid bermudagrass (2009 and 2010) trials, Auburn, AL.
Each study was irrigated (or received via precipitation) to total at least 2.5 cm water week−1. Data collected from all experiments included clipping yield, fertilizer pickup via mowing, turfgrass shoot density, rhizome/stolon density (bermudagrass), root density, visual colour ratings, chlorophyll meter readings, soil total and 2M KCl extractable N, and an end-of-study soil microbial biomass extraction (bentgrass and bermudagrass, 2010 only). Details and references for these procedures are provided in subsequent paragraphs, below.
Turfgrass colour response was measured weekly via qualitative visual colour ratings and with a hand-held chlorophyll meter. The scale was from one to nine, with one being brown turf and nine being an optimal dark green colour. Weekly chlorophyll meter readings were taken with a Fieldscout CM 1000 chlorophyll meter (Spectrum Technologies, Inc., Plainfield, IL.). Five chlorophyll meter readings were taken from each plot, and results were averaged. Measurements were recorded with the colourimeter hand-held at a 1-m height between 1000 and 1400 hours on cloudless days.
For the first 3 weeks of the study clippings were harvested from each individual plot for the fertilizer removal part of the study. Clippings were collected once per week (bermudagrass) or three times a week (samples bulked for each week) (bentgrass), using the same mower as used for plot maintenance, and immediately sieved through a 2-mm mesh screen, in order to separate any fertilizer picked up by the mower. Any collected fertilizer was weighed and reapplied to the plot. Fertilizer loss was minimal or non-existent 3 weeks after application, so samples were no longer sieved for fertilizer removal. For the remainder of the study periods clippings for dry matter and N analysis were collected once a week for analyses. Harvested clippings were forced-air dried at 70 °C for 48 hours and weighed for total clipping dry matter yield. Clippings were analyzed via dry combustion for total N using a LECO TruSpec CN (LECO Corp., St. Joseph, MI.).
Three soil samples were taken from each plot weekly to a 7.6 cm depth below the thatch layer with a 0.95 cm diameter probe. Samples (thatch removed and discarded prior to extraction) were combined and sieved through a 2-mm screen. Soil samples were extracted with 2 M KCl and analyzed for NH4-N and NO3-N concentration colourimetrically (Sims et al., Citation1995) using a BioTek uQuant Microplate Spectrophotometer (Winooski, VT). Total N and C in the soil were determined by a dry combustion LECO TruSpec CN (Mulvaney et al. Citation2008).
Shoot, rhizome/stolon, and root densities were taken from bermudagrass plots on 28 July 2009 and on 1 June, 7 July, and 27 July 2010. Shoot density of bentgrass was determined on 25 Jan., 22 March, and 12 April 2010. All shoot and rhizome/stolon densities were measured by taking two cores (6 cm diameter and 6.4 cm deep) with a tubular turf plugger (Turf-Tec International, Tallahassee, Fl.). Shoots were counted by hand, and rhizome/stolons were cleaned of soil, forced-air dried at 70 °C for 48 hours, and weighed. Root density was determined by collecting separate 30-cm deep samples (2.5-cm diameter sampler, 3 cores per plot), with roots processed as described above for rhizomes and stolons. Soil microbial biomass was collected on 10 Sept. 2010 from the bermudagrass study and 12 April 2010 using the method described by Parkinson and Paul (Citation1982). Samples were brought to field capacity and fumigated with ethanol-free chloroform and then incubated for 24 hours. The CO2 evolved was then collected with 1 M NaOH. Samples were incubated for 10 days in the dark. The CO2 evolution was calculated by titration of the NaOH solution with 1.5 M BaCl2 and 0.25 M HCl.
Results and discussion
Fertilizer removal via mower pick-up
In the 2009 bermudagrass study, fertilizer removal was not measured. In 2010, fertilizer removal was included in the bermudagrass and bentgrass studies, with all collected fertilizer returned to the plot after measurement. There was significant fertilizer removal with the harvested clippings for the first 2 weeks of harvest, and in the case of the closely mown bentgrass, 3 weeks after fertilization (). Bermudagrass and bentgrass fertilized with Sustane® (4-6-4) had greatest fertilizer removal, more than twice as much as any other treatment. If compared on an N content basis results were similar to comparisons on a product basis, as most products with measureable mower pickup contained a similar amount of N (4 to 6%). The one exception was the Sustane® (8-2-4) product, with 2.1 gram of fertilizer m−2 removed (week 1), resulting in 0.17 g m−2 of N loss. This N loss was roughly equal to that measured in mower pickup from plots fertilized with the Sustane® (4-6-4; 0.18 g N m−2 removed), Milorganite (0.11 g N m−2 removed), or either Top product (0.16 and 0.12 g N m−2 removed for fine and regular grade, respectively). Virtually no fertilizer was removed from the urea or Scotts Turf Builder® fertilized plots, in either study. The two treatments with greatest fertilizer loss in week 1 still had measureable fertilizer loss in week 2 (Sustane® 4-6-4 and Sustane® 8-2-4).
Table II. Fertilizer removal (g m−2) via mower pick-up, 2010 studies, Auburn, AL. Creeping bentgrass was managed as a putting green whilst the hybrid bermudagrass was maintained at fairway height.
On a creeping bentgrass putting green, greatest loss of fertilizer due to clipping harvest was found from an IBDU source, followed by Polyon®, and then Milorganite® (Mancino et al. Citation2001). The authors noted that differences in fertilizer removal were due to solubility, size, and density of the materials. In our study, both solubility and size affected removal, as no fertilizer was harvested from the soluble urea plots, while the treatment with greatest removal (Sustane® 4-6-4) was both a slow-release and large product, with the largest SGN (average particle size diameter multiplied by 100) ().
Turf colour response
In both years the bermudagrass responded quickly to applications of urea, with significant greenup in both visual colour () and chlorophyll meter readings (data not shown) within 5 days. In 2010, bermudagrass and bentgrass fertilized with Scotts Turf Builder® also showed a more rapid greenup than all other treatments (). This treatment was not included in the 2009 study. Rapid greenup from the TurfBuilder® would be expected, as the majority of N in that fertilizer is soluble urea, with a smaller percentage of slow-release methylene urea. Application of NatureSafe Starter® produced a significantly greener turf (as compared with the control) within 2 weeks after application (both 2009 and 2010). Application of any fertilizer produced greener bermudagrass than observed in the unfertilized control by week 3 (Weeks after Treatment (3 WAT)) in 2009 and by week 2 (2 WAT) in 2010. In the bentgrass trial, application of any fertilizer produced greener turf at 4 weeks after application (4 WAT). Because the bentgrass study was a cool-season study (fertilizers applied in January) colour responses were slower to develop, especially in the natural organic sources, where N mineralization would have been needed to release plant-available inorganic N. As with the bermudagrass studies, application of urea provided dark green colour for up to 11 weeks, and no slow-release N source provided better colour for any longer period of time (). Any turfgrass receiving N maintained a significantly greener colour, as compared with the unfertilized control, for the entire 12-week rating period. Any difference in visual colour due to fertilizer sources was largely gone by week 10 in 2009 and week 9 in 2010. In both years there was never a slow-release organic product that provided any longer colour response than that observed in bermudagrass or bentgrass fertilized with urea.
Figure 1. Relative colour of hybrid bermudagrass and creeping bentgrass as affected by N fertilizer source, Auburn, AL, 2009 and 2010. Vertical bars are the standard error about the mean.
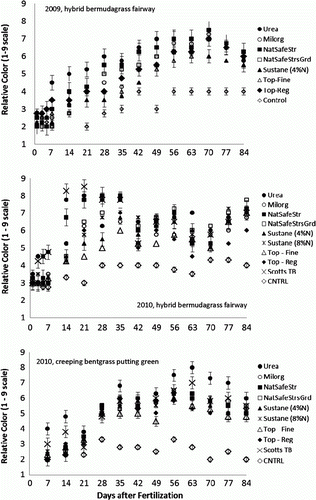
Although hand-held chlorophyll meters have become a commonly used research tool, additional data which examine their correlation with commonly used indices such as turf colour is needed (Mangiafico and Guillard Citation2005). Correlations between visual turf colour and chlorophyll meter readings, for all data collected in each study period, were calculated. For bermudagrass, the correlation between visual colour and chlorophyll meter reading in 2009 was stronger, with an R2 of 0.81, while in 2010 there was a weaker relationship, with an R2 of 0.43. Bentgrass also exhibited a weak relationship between chlorophyll meter readings and visual ratings, with an R2 of 0.34. Visual ratings with the human eye sometimes detected differences for a greater period of time, with significant differences in bermudagrass colour detected for 12 and 11 WAT in 2009 and 2010, respectively. In those same years significant differences in chlorophyll meter reading were observed for the entire 12-week period in 2009, but significant differences in chlorophyll meter readings were absent by 8 WAT in 2010.
A recent paper which examined relationships between normalized difference vegetation index (NDVI) and visual quality found different relationships due to turf species and mowing height. They found a lack of precision in the ability of NDVI to predict visual quality and recommended that data be compared within the same species and mowing height (Lee et al. Citation2011). By comparison, others found significant correlations between hand-held reflectance meters and turfgrass chlorophyll and concluded that hand-held meters could be a useful tool for N management (Mangiafico and Guillard Citation2005).
Clipping yield and tissue nitrogen
For brevity, examples of selected clipping yield and N uptake data (out of a total of 35 collections for the three experiments) are provided for the three experiments (). At 2 weeks and 3 weeks after application (2009), bermudagrass treated with urea had significantly greater clipping yield than most treatments. In 2010 (3 and 4 WAT) bermudagrass fertilized with both urea and Scotts TurfBuilder® had significantly greater clipping yield than most treatments, and this effect was observed for up to 6 weeks after treatment ().
Table III. Clipping yield (g dry matter m−2) and N content (g N kg−1 tissue) of hybrid bermudagrass and creeping bentgrass at selected sampling dates as affected by N source, 2009 and 2010, Auburn, AL.
Application of any N source typically increased N content in the bentgrass and bentgrass tissue above that measured in tissue from unfertilized control plots, but there were few differences in N content due to application of the different organic fertilizers (). The sole consistent response was that application of any N source with soluble N (urea, Scotts TurfBuilder®) often produced tissue with a significantly higher N content, as compared with tissue from plots fertilized with organic N sources. In 2009, bermudagrass receiving N via urea had a greater tissue N content than any other treatment, a significant effect found for the first 2 weeks of sampling (5 and 12 May 2009). In 2010, bermudagrass receiving N via urea or Scotts TurfBuilder® had greater tissue N content than any other treatment, a significant effect again found for the first 2 weeks of sampling (11 and 17 May 2009). In the bentgrass study similar results were observed, except that it was later in the study for such differences to appear. For bentgrass, any plot fertilized with urea had significantly greater N content in tissue at 3 WAT (8 Feb 2010), 5 WAT (23 Feb), 7 WAT (8 March), and 9 WAT (22 March). At 10 and 11 WAT (29 March and 5 April) bentgrass fertilized with Scotts TurfBuilder® also had tissue N equal to that measured in the urea-fertilized plots, and these both had more N than measured in any other treatment.
Soil nitrogen, carbon, and microbial biomass
In general, soil nitrogen (inorganic and organic), soil carbon, and soil microbial biomass were unaffected by application of the various N sources. In every experiment, there was little significant difference in soil-extractable inorganic N (NH4-N plus NO3-N) between all treatments. For the bermudagrass experiments, there were 12 sampling dates for each year of the study, and over the 2-year period half of those samples had no significant difference in inorganic N due to the application of any fertilizer, with this effect observed as early as 3 weeks after treatment. Soil from the bentgrass experiment was sampled 11 times over the course of the experiment, and in that trial there were only two sampling dates (5 and 10 WAT) when application of an N source affected total inorganic N (at those dates, higher inorganic N in plots fertilized with NatureSafe StressGuard® or Sustaine® 8-4-8). Ammonium accounted for about 90% of soil-extractable inorganic N, and soil NO3 was typically lower than soil ammonium. In any given sampling week, total average inorganic N ranged from 5 to 12 mg N kg−1 (2009, bermudagrass), 4 to 11 mg N kg−1 (2010, bermudagrass) and 10 to 30 mg N kg−1 (2010, bentgrass).
There was no major difference in total N (inorganic plus organic) amongst all treatments as compared with the control, for any experiment. Total soil N ranged from 0.3 to 0.8 g N kg−1 (2009, bermudagrass), from 0.1 to 1.0 g N kg−1 (2010, bermudagrass), and from 0.6 to 0.7 g N kg−1 (2010, bentgrass). Studies have shown that mature established bermudagrass turf can sustain growth from naturally mineralized N located in the thatch layer and soil organic N pools, releasing between 60 to 154 kg N ha−1 growing season−1. These authors also determined that substantial growth from the unfertilized plots of bermudagrass showed evidence of sufficient mineralization for turf nutrition (Lee et al. Citation2003).
Organic C was also unaffected by N fertilization, with not a single sampling date (35 total for the three experiments) having significant or consistent differences in soil C as affected by N treatment. Soil microbial biomass was only collected in 2010, but there was no significant difference in soil microbial biomass as affected by N source in either the bentgrass or bermudagrass experiment. In the bermudagrass trial soil microbial biomass ranged from a low of 154 ug C g−1 in the NatureSafe Starter® treatment to a high of 242 ug C g−1 in the NatureSafe StressGuard treatment. In the bentgrass experiment plots fertilized with Milorganite had the lowest soil microbial biomass (140 ug C g−1), with highest levels measured in the unfertilized plots (209 ug C g−1). In addition to the general lack of treatment effects for organic N and C, and soil microbial biomass, levels of these analytes did not change dramatically over the 12-week experimental periods, neither increasing nor decreasing in any type of consistent pattern.
This research consisted of two 1-year studies, and any significant effect on soil organic N or C, or soil microbial biomass, would be unlikely in this short time period. A similar study found no differences in microbial populations or total N when hybrid bermudagrass was fertilized with natural organic fertilizer or IBDU (Elliot and Des Jardin Citation1999). The bermudagrass plots were established 13 and 14 years ago for the 2009 and 2010 studies, respectively, and the bentgrass plots were more than 5 years old. Studies suggest that soil type does not affect soil microbial biodiversity, due to abundance of food from carbohydrates and C in the soil (Yao et al. Citation2006). Studies also suggest that as turfgrass maturity increases natural soil N mineralization efficiency also increases, and mature unfertilized turfgrass can mineralize from 60 to 154 kg N ha−1 growing season−1. Nitrifying soil microbes are at peak activity between 30 and 35°C (Shi et al. Citation2006a, Citation2006b). These temperatures were reached each week during our bermudagrass studies, and in the later portion of the bentgrass experiment.
Roots, shoots, and rhizome/stolons
In 2009, bermudagrass root weight, rhizome/stolon weight, and rhizome/stolon diameter were never affected by fertilizer treatment (data not shown). Rhizomes, stolons, and roots are the storage organs for turf carbohydrates, and often are less likely to respond to N, as compared with variables such as shoot density or turf colour (Guertal and Hicks Citation2009).
In 2010, there were no differences in root weight among treatments until the last sampling date (data not shown). At that sampling, 12 WAT, bermudagrass fertilized with Milorganite® had a greater root weight than plots fertilized with Scotts Turf Builder®, urea, or NatureSafe StressGuard®. As in 2009, the diameter of rhizomes/stolons was unaffected by treatment.
In 2009, bermudagrass shoot density was affected by N source, with application of any N source increasing shoot density (12 WAT) (). In 2010, shoot density was largely unaffected by N fertilization, with no differences detected between fertilized and control plots at 9 and 12 WAT (). In previous research Guertal and Hicks (Citation2009) reported that N source did not affect bermudagrass shoot density. Similar results were found in the bentgrass study, with few differences in shoot density due to fertilizer source detected at any one of three sampling dates ().
Table IV. Shoot density of harvested creeping bentgrass and hybrid bermudagrass (shoots cm−2) as affected by sampling date and N treatment, Auburn, AL, 2009 and 2010.
In conclusion, application of sources with large portions (or 100%) of soluble N (urea and a urea/methylene urea blend) produced turf with a darker green colour, greater tissue N content and greater clipping yield than plots fertilized with materials containing organic N. Differences in turfgrass quality other than colour (disease, texture, shoot density) were less evident. Urea or a commercial urea/methylene urea fertilizer provided consistent high quality colour (greenness) for the same 10–12-week period as the organic sources, and no organic source provided acceptable colour for any longer period than soluble N sources. Over a 12-week period, there were few differences in soil N, C, or microbial biomass due to one application of any organic N source.
References
- Besemer , S. T. 1963 . A comparison of resin-fertilizer with non-water soluble fertilizers on bentgrass putting green turf . California Turf Culture , 13 : 3 – 5 .
- Carrow , C. N. 1997 . Turfgrass response to slow-release nitrogen fertilizers . Agronomy Journal , 89 : 491 – 496 .
- Christians , N. 2004 . Fundamentals of turfgrass management , Hoboken , NJ : John Wiley and Sons .
- Cisar , J. L. 2004 . Evaluation of organic fertilizers on St. Augustine grass in south Florida . CERES final project .
- Davis , J. G. and Dernoeden , P. H. 2002 . Dollar spot severity, tissue nitrogen, and soil microbial activity in bentgrass as influenced by nitrogen source . Crop Science , 42 : 480 – 488 .
- Eldridge , S. M. , Chan , K. Y. , Xu , Z. H. , Chen , C. R. and Barchia , I. 2008 . Plant-available nitrogen supply from granulated bio-solids: implications for land application guidelines . Australian Journal of Soil Research , 46 : 423 – 436 .
- Elliot , M. L. and Des Jardin , E. A. 1999 . Effect of organic nitrogen fertilizers on microbial populations associated with bermudagrass putting greens . Biology and Fertility of Soils , 28 : 431 – 435 .
- Guertal , E. A. and Hicks , C. A. 2009 . Nitrogen source and rate effects on the establishment of ‘Tifsport’ and ‘Tifway’ hybrid bermudagrass . Crop Science , 49 : 690 – 695 .
- Guillard , K. and Kopp , K. L. 2004 . Nitrogen fertilizer form and associated nitrate leaching from cool-season lawn turf . Journal of Environmental Quality , 33 : 1822 – 1827 .
- Hummel , N. W. Jr . 1989 . Resin-coated urea evaluation for turfgrass fertilization . Agronomy Journal , 81 : 290 – 294 .
- Hummel , N. W. Jr and Waddington , D. V. 1981 . Evaluation of slow-release nitrogen sources on Baron Kentucky Bluegrass . Soil Science Society of America Journal , 45 : 966 – 970 .
- Hummel , N. W. Jr and Waddington , D. V. 1984 . Sulfur-coated urea for turfgrass fertilization . Soil Science Society of America Journal , 48 : 191 – 195 .
- Kerek , M. , Drijber , R. A. and Gaussoin , R. E. 2003 . Labile soil organic matter as a potential nitrogen source in golf greens . Soil Biology and Biochemistry , 35 : 1643 – 1649 .
- King , K. W. and Torbert , H. A. 2007 . Nitrate and ammonium losses from surface-applied organic and inorganic fertilizers . Journal of Agricultural Science , 145 : 385 – 393 .
- Landschoot , P. J. and Waddington , D. V. 1987 . Response of turfgrass to various nitrogen sources . Soil Science Society of America Journal , 51 : 225 – 230 .
- Lee , D. J. , Bowman , D. C. , Cassel , D. K. , Peacock , C. H. and Rufty , T. W. Jr . 2003 . Soil inorganic nitrogen under fertilized bermudagrass turf . Crop Science , 43 : 247 – 257 .
- Lee , H. , Bremer , D. J. , Kemin , S. and Keeley , S. J. 2011 . Relationships between normalized difference vegetation index and visual quality in turfgrasses: effects of mowing height . Crop Science , 51 : 323 – 332 .
- Li , K. 2005 . Evaluation of organic turfgrass management and its environmental impact by dissolved organic matter . Electronic Doctoral Dissertation . University of Massachusetts . http://scholarworks.umass.edu/dissertation/AAI3163683\
- Mancino , C. F. , Petrunak , D. and Wilkinson , D. 2001 . Loss of putting greens-grade fertilizer granules due to mowing . HortScience , 36 : 1123 – 1126 .
- Mangiafico , S. S. and Guillard , K. 2005 . Turfgrass reflectance measurements, chlorophyll, and soil nitrate desorbed from anion exchange membranes . Crop Science , 45 : 259 – 265 .
- Mazur , A. R. and White , C. B. 1983 . Mineralization of nitrogen from several sources and establishment of ‘Penncross’ creeping bentgrass on putting green media . Agronomy Journal , 75 : 977 – 982 .
- Melvin , B. P. and Vargas , J. M. Jr . 1994 . Irrigation frequency and fertilizer type influence necrotic ring spot of Kentucky bluegrass . HortScience , 29 : 1028 – 1030 .
- Mulvaney , M. J. , Wood , C. W. and Wood , B. H. 2008 . Carbon and nitrogen mineralization and persistence of organic residues under conservation and conventional tillage . Agronomy Journal , 102 : 1425 – 1433 .
- Parkinson , D. & Paul , E. A. 1982 . Microbial biomass . In A. L. Page , R. H. Miller and D. R. Keeney Methods of soil analysis, part 2. Chemical and microbiological properties , 821 – 830 . Agronomy Monograph no. 9, , 2nd edn . Madison , WI : American Society of Agronomy and Soil Science Society of America .
- Peacock , C. H. and Daniel , P. F. 1992 . A comparison of turfgrass response to biologically amended fertilizers . HortScience , 27 : 883 – 884 .
- Peacock , C. H. and DiPaola , J. M. 1992 . Bermudagrass response to reactive layer coated fertilizers . Agronomy Journal , 84 : 946 – 950 .
- Shi , W. , Yao , H. and Bowman , D. C. 2006a . Soil microbial biomass, activity, and nitrogen transformations in a turfgrass chronosequence . Soil Biology and Biochemistry , 38 : 311 – 319 .
- Shi , W. , Yao , H. and Bowman , D. C. 2006b . Soil microbial biomass and nitrogen dynamics in a turfgrass chronosequence: a short-term response to turfgrass clipping addition . Soil Biology and Biochemistry , 38 : 2032 – 2042 .
- Sims , G. K. , Ellsworth , T. R. and Mulvaney , R. L. 1995 . Microscale determination of inorganic nitrogen in water and soil extracts . Communications in Soil Science and Plant Analysis , 26 : 303 – 316 .
- Tian , G. , Granato , T. C. , Dinelli , F. D. and Cox , A. E. 2008 . Effectiveness of bio-solids in enhancing soil microbial populations and nitrogen mineralization in golf course putting greens . Applied Soil Ecology , 40 : 381 – 386 .
- Yao , H. , Bowman , D. and Shi , W. 2006 . Soil microbial community structure and diversity in a turfgrass chronosequence: land-use change versus turfgrass management . Applied Soil Ecology , 34 : 209 – 218 .