Abstract
Sugar beet accumulates a significant amount of Na, which affects both yield of storage root and its technical quality. So far there has not been developed a scientific basis of fertilizer Na recommendation. In order to solve this problem, in 2003 and 2004 series of field trials were carried in commercial farms out to determine the response of sugar beet to Na application. The experiments were established in 20 fields differing in soil Na concentration. Each trial consisted of control (NPK) and a plot with 50 kg Na ha−1 (NPK + Na). Soil samples were collected at two depths (0.0 – 0.3 m and 0.3 – 0.6 m) at spring, before the application of Na. The increase of beet yield (BY) varied from −0.8 to 15.1% compared with the control and averaged at 4.9%. The plants fertilized with Na showed lower sucrose concentration (ca−0.21% fresh matter) and higher root Na concentration (ca +0.65 mM kg−1 fresh matter) compared with the control. The relative increase of white sugar yield (WSY) varied from − 3.5 to 14.1% and was field specific. The effect of Na application on BY and quality depended on the level of plant-available Na. Its impact on WSY was modified by the content of exchangeable K. The highest WSY increase was observed both on Na-poor soils (<6 mg kg−1) and also on soils with K/Na ratio higher than 15–20:1. This study indicates that the diagnosis of plant-available Na content should include both the top- and subsoil. The highest WSY increase resulting from the plant's response to fertilizer Na should be expected on soils with ready-for-use Na content below 60 kg ha−1 within the layer 0.0–0.6 m. In addition, the rate of fertilizer Na for these soils should not exceed 90 kg ha−1.
Introduction
Sugar beet (Beta vulgaris L.) is the key crop for white sugar production in temperate regions, including Poland. However, yields are low (~50 Mg ha−1) compared with those obtained in Western European countries (e.g., France and Germany). The key reasons for these differences are attributed to differences in soil fertility and climatic conditions (Supit et al., Citation2010). Soils in Poland originate from postglacial material and are naturally poor in colloids. As a result, they are characterized by low water retention and natural shortage of nutrients, especially cations (Grzebisz & Diatta, Citation2012). An important limiting factor of sugar BY in Poland is also the frequently occurring droughts during summer (Kenter et al., Citation2006). Its negative impact on sugar BY is stronger under conditions of soil nutrient imbalance, especially of K, which is an attribute of light soils (Cakmak, Citation2005; Grzebisz & Diatta, Citation2012).
The increase in root yields and the raise of economic competitiveness of sugar beet production should be done via a best exploitation of natural soil resources (Märländer et al., Citation2003). Sugar beet belongs to the group of plants classified as a natrophile (Na includer). On Na-poor soils, Na fertilization is beneficial for sugar beet growth (Draycott & Christenson, Citation2003). The chemical and, to some extent, nutritional similarity of both elements is the main cause for a possible substitution of K by Na under some cropping systems. For this crop, therefore, it is proposed to apply cheaper fertilizers containing not only K but also Na (Hajiboland et al., Citation2009; Wakeel et al., Citation2010).
In the light of the scientific literature, Na is an essential trace element for certain C4 plants only. For the most species, a positive role of Na is attributed only to replacing K for nonspecific functions (Pilon-Smits et al., Citation2009). However, in plant species of the family of Chenopodiaceae, including sugar beet, Na seems to have a specific function, as can be concluded from higher growth rates in the presence of Na with ample supplies of K (Subbarao et al., Citation2003). It has been found that Na increases water content of the leaves, participates in regulation of stomata activity, and thus improves water status of sugar beets under water stress (Lawlor & Milford, Citation1973; Subbarao et al., Citation1999; Hajiboland et al., Citation2009). Simultaneously, Na increases the leaf area via an increased rate of cell expansion (Hampe & Marschner, Citation1982; Niazi et al., Citation2000). It should be noted that Na may be able to replace K in long-distance transport of NO3 − ions (Subbarao et al., Citation2003). Most crops are sensitive to elevated soil Na concentration (Katerji et al., Citation2003). Sodium toxicity in plants is attributed to a combination of osmotic stress, enzyme inhibition, and competition with K (Flowers & Dalmond, Citation1992; Koyro, Citation2000; D'Onofrio et al., Citation2005). Therefore, salt-tolerant plants, including sugar beet, have developed an efficient mechanism for extruding Na+ from the cytoplasm to the vacuoles of leaves (Munns & Tester, Citation2008). Hence, sugar beet plants can accumulate high Na concentrations and, simultaneously, keep a wide K:Na ratio in the cytoplasm (Blumwald et al., Citation2000).
So far most researchers have agreed with the favorable role of Na in shaping BY (Haneklaus et al., Citation1998; Draycott & Christenson, Citation2003; Wakeel et al., Citation2010). However, opinions on the optimal Na content in soils cropped with beets and also its adequate rate are still controversial and ambiguous. The positive effect of Na fertilizer application is seldom manifested (Milford et al., Citation2000; Römer et al., Citation2004). As reported by Haneklaus et al. (Citation1998), Na fertilization increases BY. Simultaneously, the quality decreases with increasing Na rates, as a result of its accumulation in roots. Some researchers have stressed the positive effect of Na both on BY and also on sucrose content (Marschner et al., Citation1981; Hajiboland et al., Citation2009; Wakeel et al., Citation2010). The observed high variability of sugar beet response to Na is due to the action of numerous factors. Among them, the most important are pedoclimatic conditions, agricultural practices, and plant genotypes. As reported by Tsialtas and Maslaris (Citation2009), genotypic ability of sugar beet to exclude Na from the storage root significantly impacts its N nutritional status and, thus, yield and quality of sugar beet. Soil concentration of available K is probably the most important factor controlling sugar beet response to Na fertilization. The positive yield-forming effect of Na has been manifested particularly under conditions of low K supply, appearing mostly in K-poor soils (Draycott & Durrant, Citation1976) and/or high K-fixation soils (Wakeel et al., Citation2010). Moreover, effects of Na depend on the time and type of fertilizer applied. According to Allison et al. (Citation1994), the optimal time for Na application falls in early spring, due to its potential losses during winter.
It has been assumed for the current study that the insufficient Na content in soils cropped with sugar beet is an important factor limiting BYs in Poland. The determination of the critical soil Na content and its rating was the key aim of the study. Therefore, the second aim of field investigations was to determine the effect of NaCl applied in spring on the BY and quality, based on the differentiated physical and chemical soil properties.
Material and methods
Trials with sugar beet (Beta vulgaris L.) were carried out in years 2003 and 2004 in commercial farms. They were located in areas of intensive sugar beet cropping in Central-Western Poland (51–53°N and 16–18° E). A factorial experiment was established in each of 20 sugar beet fields. Each of them was set in a full random design with four replications and a plot area of 108 m2. The experimental factor consisted of two levels of Na application: control without sodium (NPK) and 50 kg Na ha−1 (NPK + Na). Sodium was applied as NaCl, two weeks before sugar beet sowing.
Standard agricultural practices were applied in all fields, with soil tillage in late fall, as well as farmyard manure application (FYM). At the fields where no FYM was applied in the fall, white mustard was sown as green manure (). The application rate of nitrogen, phosphorus, and potassium on a particular field depended on agrochemical properties of soils and agricultural practices. Phosphorus and potassium fertilizers (single superphosphate, muriate of potash, and multinutrient fertilizers) were applied after the harvest of the preceding crop, mainly spring cereals. Nitrogen fertilizers were applied at two dates: (1) before sowing sugar beet and (2) at the four–six leaf growth stage. The final N rate varied from 57 to 160 kg ha−1.
Table I. Localization and agronomic information for the 20 experiments.
Sugar beets were hand harvested at the stage of technological maturity from an area of 14.4 m2. The aboveground biomass (leaves + petioles + root tops) is designated as leaf yield (LY). The evaluation of qualitative parameters of storage roots (i.e., sucrose concentration in fresh roots, concentration of K, Na, and α-amino-N) was performed by using a Venema autoanalyzer (Typ IIG). Representative root samples (mean of 25–30 roots per treatment, randomly collected) were first washed, grounded to get a uniform pulp, and clarified with 0.3% aluminum sulfate solution. Potassium and Na concentrations were determined by flame photometry, and α-amino-N was analyzed by the fluorometric ortho-phthaldialdehyde method. Sucrose concentration in fresh root (%, SC) was determined by polarimetry. White sugar yield (WSY) and standard molasses loss (SML) were calculated according to the Brunswick Formula (Buchholz et al., Citation1995):
where SML is standard molasses loss (%), K + Na is sum of potassium and sodium concentration in beet (mM 100 g−1 fresh matter), α-N is α-amino-N concentration in beet (mM 100 g−1 fresh matter), SC is sucrose concentration (% on beet fresh matter), SFL is standard factory loss (0.6%), BY is beet yield (Mg ha−1), WSY is white sugar yield (Mg ha−1).
According to the World Reference Base for Soil Resources (WRB) classification system, all studied soils have been classified as Luvisols. More than half of them were characterized by loamy sand texture and the others as sandy loam. Soil samples were collected at two depths (0.0–0.3 m and 0.3–0.6 m) in spring before application of fertilizers. The following soil properties were determined: particle size distribution (sand 2–0.05 mm, silt 0.05–0.002, and clay <0.002 mm by Casagrande's aerometric method in Prószyński modification); organic carbon, Corg (wet dichromate oxidation, Nelson & Sommers, Citation1982); pH (1 M KCl, 1:2.5 m/v ratio, Van Lierop, Citation1990); electrical conductivity (ECe) (distilled water, 1:5 m/v ratio, Rhoades & Miayamoto Citation1990), available form of P (DL method, Egnér et al., Citation1960); available (exchangeable) forms of K, Na, Mg, Ca (1 M CH3COONH4 pH 7.0; 1:10 m/v ratio, Thomas, Citation1982), and mineral forms of nitrogen, NH4-N and NO3-N (0.01 M CaCl2, 1:10 m/v, Houba et al., Citation1995). Collected extracts were analyzed for cations by atomic-absorption spectrophotometry (SpectrAA 220FS, Varian) and P, NH4-N, and NO3-N by flow injection analyses (FIAstar5000, FOSS). The Nmin was determined in “raw” and the remaining components in dry soil samples. In order to express the nutrient content in kg ha−1, converter 4.5 was applied.
The long-term average yearly precipitation in the area of study is about 550 mm. Total annual precipitation amounted to 379 mm in 2003 and 556 mm in 2004. It should be noted that in the two critical months for sugar beet growth, i.e., July and August, the amount of rainfall was 111 mm and 122 mm, for years 2003 and 2004, respectively. The requirements for water by the sugar beet canopy in both months are fixed at the level of ca 180 mm. The average annual temperature was 8.8°C in 2003 and 8.7°C in 2004.
The soil data were subjected to principal component's analysis (PCA). The PCA was performed using the factor analysis module of the STATISTICA package, Version 9 (StatSoft, Inc., Citation2012). The maximal number of factors was set as the basis of individual variance. In the next step, only factors whose values of variance were higher than 1 were considered (Kaiser's criterion). In order to find out the clear pattern of factor loadings, a rotation of factor's axis was undertaken by the “normalized Equamax” method. The variables whose factor loadings explained 50% of factor variability (loadings >0.7) were used for interpreting the factors (“new” variables).
In order to assess the influence of Na fertilization on yield and quality of sugar beet, one-way ANOVA was applied for each field, as well as two-way ANOVA with main factors the fields and Na rates. The relationships between BY or WSY increase (expressed in%) and soil physical and chemical properties were evaluated by the analysis of correlation, nonlinear regression (logarithmic function), and cluster analysis (STATISTICA 9). The recorded soil main factors (from PCA analysis) along with the variable representing individual BY and WSY increases and also SC changes were used for grouping observations in clusters with the minimum variability within clusters and maximum variability between clusters. The k–means method was applied for grouping the variables. The function of “cross-validation” was used when establishing the optimal number of clusters (for a number of cases within the cluster >2). The effect of factors in the object's classification was estimated by the one-way ANOVA. Tukey's test (for different N) at the probability level α=0.05 was additionally performed to compare mean values.
Results
Soil properties
The study showed that soil properties between fields were highly variable, depending on soil depth. The contents of sand, silt, and clay were in the ranges of 62–87, 8–31, 2–14% in the topsoil and 58–82, 8–31, 12–30% in the subsoil, respectively. In general, soils were characterized by a lower content of clay in the topsoil (7.8%) as compared with the subsoil (12.3%), as typical for Luvisols originating from sandy loams. The content of organic carbon (Corg) in the topsoil varied from 0.39 to 1.91% and pH from 5.2 to 7.4 (). In general, the topsoil was characterized by higher levels of available K, but lower of Na, as compared with the subsoil. The average concentration of K and Na in the topsoil amounted to 141.4 and 8.4 mg kg−1 and in the subsoil 94.1 and 10.7 mg kg−1, respectively. More than half of studied soils were characterized by a high content of available K (>120 mg kg−1). The lowest K concentration was obtained in fields 3, 5, and 14, and the lowest Na concentration in the fields 6, 8, 9, 13, 16, and 18 ().
Table II. Soil properties of the experimental fields at two depths before sugar beet sowing.
In the topsoil, the electrical conductivity values ranged between 57 and 162 µS cm−1. Next plant available P varied from 40.5 to 149.4 mg kg−1, Mg within the range 27.9–133.5 mg kg−1, and Ca from 438 to 3979 mg kg−1. In the subsoil, the following results were obtained: 44−135 µS cm−1, 8.2–108.9, 26.2–174.0, and 416–4218 mg kg−1, respectively. The Nmin (sum of NH4-N and NO3-N) values ranged between 46–86 kg ha−1 at the 0.0–0.6 m soil layer.
Data obtained from the PCA method for the topsoil (A) enabled four factors to be distinguished, which altogether explained 82% of the full soil-based variability. The factor A/I consisted of variables related to the content of Corg, ECe and Ca; for the factor, A/II – clay, Mg and also Na; factor A/III – P; and factor A/IV – K ().
Table III. Loadings and variance of principal components (after rotation of components) in relation to soil depth.
Three factors were discriminated for the subsoil (B) and explained 79% of the whole soil-based variability. The variables related to Na content in the layer 0.3–0.6 m and were involved in the factors B/I and B/II, jointly with the variables represented by clay, Mg, and Corg, Ca, and ECe ().
Beet yield and quality
BY varied from 40.7 to 68.2 Mg ha−1, between experimental fields, with the mean amounting to 53.5 Mg ha−1. An increase of BY (from 0.9 to 15.1%) as a result of Na application was observed in most (n = 18) investigated fields. A statistically significant BY increase was noted only in four fields (6, 8, 18, and 19). Yield decrease as related to the negative response of sugar beet to Na application varied from − 0.3 to − 0.8% (fields 7 and 20). Consequently, for all experiments, the mean BY increase due to Na fertilization was at the level of 4.9% ().
Table IV. Effect of Na application on the BY, LY, WSY, and parameters of sugar beet quality.
LY varied from 12.6 to 35.2 Mg ha−1 (mean 23.5 Mg ha−1) and was field-specific (). The effect of Na application showed a highly variable effect. A significant increase was observed only in field 19, while fields 6 and 8 showed a decrease. Sodium application did not affect significantly mean LY and shoot/root ratio (the proportion of leaf biomass in the total yield of beet), which was 0.46 (NPK) and 0.44 (NPK + Na).
Sodium affected negatively SC in beet root. This trend was noted in 16 out of 20 fields, varying from − 0.01 to − 0.70%. SC increase was observed in four fields (9, 13, 16, and 18) and ranged from 0.14 to 0.31%. Sodium fertilized plants, on average, were characterized by significantly lower SC (ca 0.21%) compared with the control. Root Na concentration increased considerably only in two fields (3 and 9). Fertilized plants had higher root Na concentration compared with the control. The difference was on average 0.65 mM kg−1 ().
The effect of Na on K concentration in beet brei was positive and negative on α-amino-N. However, values of these indices were both closely field specific and, at the same time, were not explicit. Consequently, no significant differences were noted between NPK and NPK + Na-treatments (). This was also evident for the SML (2.22% for NPK and 2.24% for NPK + Na).
Increase of WSY by Na application was observed in a lesser number of fields compared with BY (). This result was mainly due to the negative effect of Na on SC. The relative increase of WSY varied from − 3.5 to +14.1%, and was field specific. A significant increase was observed only in four fields: 6, 8, 13, and 18 (from 0.14 to 0.31%). The average sugar yield increase as impacted by Na fertilization was not significant and was 3.5%. It is worth noting that the response to sodium fertilization did not significantly depend upon the application of FYM on farms (with FYM=3.4% and without FYM = 4.0%).
Effect of soil properties
The increase in BY and WSY were strongly and negatively correlated with soil-available Na. This relationship was, however, an attribute of the subsoil. The values of the R 2 coefficients for BY were in the range of 0.24–0.49 (p <0.05 and p <0.001; n=20) and for WSY 0.36–0.55 (p <0.01 and p <0.001; n=20), respectively, to soil depth. Among quality traits, only changes in SC were significant (negatively) correlated with soil Na, especially at the depth 0.0–0.3 m (R 2=0.28; p <0.05; n=20). Responses of BY and WSY were also negatively correlated with clay, Corg, Ca, Mg and Nmin contents. However, correlation coefficients were significantly lower than those obtained for soil Na concentration (R 2<0.22). Correlation coefficients between the effects of Na fertilization and soil K content were not significant.
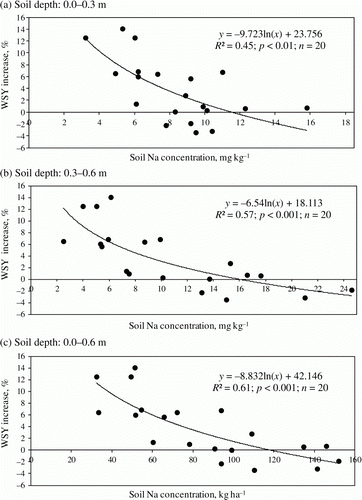
Log transformation of the linear functions improved the predictability of Na soil concentration. In addition, an increase of R 2 was observed when Na was expressed in kg ha−1 for the layer 0.0–0.6 m. An increase of WSY as a response to Na can be expected when soil-available Na concentration is lower than 11 mg kg−1 at the upper soil layer, 16 mg kg−1 at the sublayer, and 120 kg ha−1 at the 0.0–0.6 m layer ().
Figure 1. Relationships between WSY increase (in%) to applied NaCl and soil-available Na concentration in 0.0–0.3 m (a), 0.3–0.6 m (b), and 0.0–0.6 m soil depth (c).
Available soil Na content explained 61% of the observed variability of response (). Therefore, cluster analysis was applied for determining the effect of all analyzed soil properties on the degree of sugar beet response to Na application. The recorded soil main factors (from PCA analysis) along with the variable representing individual BY and WSY increase and also SC changes were used for grouping observations in clusters. Two clusters were distinguished upon the basis of factors characterizing the variability of the upper soil layer and BY. Among all factors, A/II (soil Na concentration) affected the data, splitting the most. It was observed that the highest soil Na available content was associated with the lowest BY increase under Na fertilization. Also, for SC and WSY, factor A/II was the most important. Two clusters of treatments differing in WSY were distinguished. Factor A/IV, including soil K concentration, affected mainly BY, but there was no significant difference between mean cluster values ().
Table V. Cluster analysis – yields and sucrose concentration increase (%) in relation to values of principal components (± SD) for soil depth 0.0–0.3 m.
Based on factors described for the 0.3–0.6 m soil layer, three clusters differing in BY, SC, and WSY were established (). The highest productivity (for WSY) of the applied fertilization was observed in treatments characterized by the lowest value of B/II and, concurrently, with the highest value of B/III. Treatments with the highest value of B/II, but moderate level of B/III, were included within the group of sites negatively responding to Na application. The average WSY increase and, simultaneously, the highest scattering of data was found in the cluster representing the moderate level of factor B/II and the lowest values of factor B/III. In general, the higher the values of B/II and B/III factors, the more pronounced the decrease in SC in beet roots ().
Table VI. Cluster analysis – yield and sucrose concentration increase (%) in relation to values of principal components (± SD) for soil depth 0.3–0.6 m.
Soil Na and K concentration in the individual clusters is presented in . The data implicitly indicated that clusters differed mainly in Na content. The highest WSY increase was attributed to cluster no. 1. Soil fertility characteristics, gathered in this cluster, showed the lowest concentration of Na in soils and, simultaneously, highest K concentration in the subsoil, too. The absence of positive response to Na application was observed in cluster no. 3, characterized by the highest concentration of Na, but moderate concentration of K ().
Table VII. Statistical overview of Na and K content in the soils of isolated clusters, for white sugar yield increase (mg kg−1).
Discussion
Sodium concentration in soils is determined by climate, soil parent material, land cover, vegetation type, and topography. The most influential human-induced factors are land use, farming system, organic and mineral fertilization, and irrigation practices. This study showed that arable soils in the temperate region, as in Poland, in general, are productive and are Na-poor as compared with soils of arid and semiarid regions (Hajiboland et al., Citation2009; Tsialtas & Maslaris, Citation2009). In humid regions, Na ions leach easily along with infiltrating water. This phenomenon is indirectly confirmed by the data obtained during the study because the subsoil contained much more available Na compared with the topsoil. The key causes of Na nonuniform distributions are processes responsible for Na+ adsorption by clay particles, although the weathering of soil minerals rich in Na and Mg is possible (Harley & Gilkes, Citation2000). The study also showed that clay content, especially in the topsoil, was the strongest soil factor controlling Na concentration. This dependency has not been found for K because its amount in soil depends mainly on farming practice and plant cycling (Jobbágy & Jackson, Citation2001).
The potential yields (BY) of sugar beet, based on climatic factors, in area extending from France to Poland, ranged in the period 1996–2005 from 86 to 80 Mg ha−1, respectively. However, current yields showed much higher difference from 74 to 39 Mg ha−1, correspondingly (Supit et al., Citation2010). In the present study, the average BY was sufficiently high, amounted to 53.5 Mg ha−1, but lower to the expected potential. The main reason is the unfavorable weather course, impairing plant growth. In 2003 and 2004 (IV–X), the amount of precipitation during the growing period was 40–50% lower compared with total water requirements of sugar beet, 650 mm (FAO, Citation2012). On the other hand, water stress induces a sugar beet response to applied Na (Allison et al., Citation1994; Mäck & Hoffmann, Citation2006). This study clearly revealed that Na fertilization increased the average BY by 5.6% in 2003 and 4.4% in 2004.
In general, BY and WSY depend on nitrogen management in the crop during the growing season. The principal role of N in the sugar beet is to stimulate the rate of a canopy growth and partitioning of assimilates between leaves and storage root. To achieve full canopy cover in early summer, the crop needs to take up during first 60 days of vegetation about 100–120 kg N ha−1 (Malnou et al., Citation2006). It is well documented that N uptake and utilization by sugar beet depends on the soil water availability and supply of other nutrients, especially K (Marschner, Citation1995; Draycott & Christenson, Citation2003). In sugar beet, a high proportion of K can be replaced by Na without growth decline and additional growth stimulation occurs, what cannot be achieved by increasing solely K concentration in plant tissues (Subbarao et al., Citation2003). A positive effect of Na replacing by K has been documented for leaf area, leaf thickness, number of stomata, and plant succulence, based on hydroponic studies (Hampe & Marschner, Citation1982). The favorable effect of Na could also be related to its function as the osmosis-controlling agent during stomatal activity. According to Terry and Urlich (Citation1973), in the Na-treatment with drought stress, the stomata resistance of sugar beet leaves to water vapor exchange rose more rapidly, but declined more slowly after stress release, than in K-treatment. All these processes resulted in the improvement of water-use efficiency in plants facing drought stress (Niazi et al., Citation2000; Subbarao et al., Citation2001). The main question remains, how far can K be substituted by Na? According to Subbarao et al. (Citation1999), the stomatal conductance in red beet is nearly normal even when almost 95% of the plant K was replaced by Na. Sodium can substitute for K in its osmotic role but not in its biochemical actions (Subbarao et al., Citation2003). In contrast to K ions, Na ions affect negatively the activity of enzymes in the cytoplasm (Flowers & Dalmond, Citation1992, D'Onofrio et al., Citation2005). Therefore, chlorophyll level and leaf photosynthesis rates of sugar beet declined substantially during K deficiency, even when Na was present (Terry & Urlich, Citation1973). Nevertheless, the inhibition of some enzymes, e.g., nitrate reductase and starch synthase can be beneficial for WSY because Na positively change the proportion of assimilates stored as sugar rather than used for leaf growth (Hajiboland et al. Citation2009). Moreover, the beneficial role of Na is confined not only to supplementing the deficiency of K in sugar beet plants but also in the regulation of cell ionic equilibrium. An adequate K/Na, Ca/K, or Ca/Na ratio in beet leaves controls the size of BY and WSY (Haneklaus et al., Citation1998; Wakeel et al., Citation2009).
Although Na application can potentially improve sugar BY, a high soil Na level retard growth and affect negatively root quality (Haneklaus et al., Citation1998; Tsialtas & Maslaris, Citation2005). Moreover, K and Na in sugar beet roots are melassogenic substances decreasing white sugar production during processing (Buchholz et al., Citation1995). The rate of Na applied in the current study was 50 kg ha−1. Some researchers have reported that this rate is safe for the quality of storage root (Haneklaus et al., Citation1998; Wakeel et al., Citation2010). This study revealed, however, that Na application positively influenced yield of beet compared with its quality. The mean increase of WSY was 3.5% but for BY was 4.9%. This is in line with data reported by Haneklaus et al. (Citation1998) showing that sugar beet Na fertilization positively influences only BY. Data reported by these authors concluded that Na fertilization decreases the beet quality due to the elevated concentrations of Na. The present study indicated decreasing SC as the main factor negatively influencing quality of storage root. These discrepancies may be explained by (1) dilution of sucrose due to the increased water content in the storage root as a result of the increased Na concentration (Tsialtas & Maslaris, Citation2009) and (2) negative correlation of SC with inorganic ions (K, Na) in storage roots (Bell et al., Citation1996). The effect of Na on K and α-amino-N as well as the technological index, i.e., SML, was not explicit, as reported earlier by Wakeel et al. (Citation2010).
Sugar beet response to Na fertilization depended on soil factors, especially on soil Na concentration in the subsoil and clay content. The latter relationship has been revealed because Na availability was significantly correlated with clay content. The most important factor controlling sugar beet response to Na fertilization was, however, concentration of available K. According to Draycott and Durrant (Citation1976), the highest efficiency of Na application should be expected for soils with exchangeable K content below 60 mg kg−1. The greatest positive effect of K substitution by Na is observed for soils characterized by strong K+ fixation (Wakeel et al., Citation2010). Data from the study showed a complex pattern of plant response to Na fertilization. With respect to the topsoil, it should be mentioned that the highest yield increases were obtained in treatments characterized by both low soil Na and K contents. These conditions can be considered as the recommended basis of Na application. Much more complicated pattern was found for the subsoil. The highest effect of Na application was obtained on soils characterized both by the lowest Na content and, simultaneously, high K content. This phenomenon stresses the fact that Na exerts a positive effect on WSY not only in soils with low but also with excessive K content. This specific effect of Na fertilizer on WSY requires insight into the basic physiological processes responsible for K and Na competition. So far reports do not indicate the occurrence of specific ionophores for Na+ in plasmalemma (Mäser et al., Citation2002). Sodium migrates into plant cells as a result of the “low-affinity” mechanism related to K uptake. This mechanism enables the occurrence of Na+ antagonism toward K+ and also Ca2 + (Tester & Davenport, Citation2003). Sodium taken up by a plant may ameliorate the excessive and unbalanced K uptake, in turn inducing Mg and Ca deficiency (Marschner, Citation1995; Wakeel et al., Citation2009).
Effect of soil properties was also evaluated for beet's quality. In general, the higher the Na and K content in soils (0.0–0.3 m), the more pronounced the decrease in SC in the root. This result should be related to the function of both cations and sucrose in the regulation of osmotic pressure in taproot cells (Bell et al., Citation1996). Moreover, soils poor in available K and, simultaneously, rich in Na has revealed the elevated Ca concentration (factor A/I). It acted as the factor ameliorating the unfavorable effect of Na application on SC. This follows from the fact that high Ca concentration in the soil solution reduces Na uptake by beet (Wakeel et al., Citation2009). The positive effect of soil K in the process of sucrose accumulation in root was found in the subsoil. The high soil K concentration in this soil layer mitigated the unfavorable effect of Na on SC in root. This finding is in line with other studies (Subbarao et al., Citation2003; Tsialtas & Maslaris, Citation2009).
One of the most controversial questions refers to the impact of genotypes on sugar beet tolerance to increased Na levels (Marschner et al., Citation1981). It was, in general, ascribed by differences in lipid composition of roots (Stuiver et al., Citation1981). According to Tsialtas and Maslaris (Citation2009), N nutrition could be affected by the genotypic ability to exclude Na from root. Cultivars with preferential absorption of K over Na cannot benefit from the promotion of leaf expansion and growth caused by Na uptake. Four varieties, i.e., Kassandra, Kristall, Dojana, and Saskia, have been tested in the current studies; however, no significant interaction between varieties and Na rate was found. The lack of interaction implicitly indicates the dominant effect of soil properties on BY and WSY in response to Na fertilizer. This result is in accordance with Drycott and Russel (Citation1974) who stated that varietal differences in fertilizer requirement are unlikely to be important in commercial practice.
The cluster analysis has been applied to determine the critical contents of available Na and K to determine WSY increase (). Particularly interesting are values of the first cluster, consisting of groups of treatments responding the best to Na application. It can be concluded that soils with Na concentration below 6.7±2.2 mg kg−1 in the topsoil need to be supplemented with Na. In soils with Na above 10.4±2.4 mg kg−1 its application is not necessary. According to Draycott and Christenson (Citation2003), threshold ranges for Na in the topsoil are as follows: low <25; medium 25–50 and high >50 mg Na kg−1 (ammonium acetate method). The critical values obtained in the current study were lower in comparison with these norms, but at the same time very close to German ones (e.g., for a class of low sodium content 6–15 mg kg−1, determined by Schachtschabel's method, LUFA Citation2012). This adequacy can be explained by the similarity in morphology and chemistry of soils and climatic conditions dominating in both countries. The choice of extraction method is less important because available forms of Na are very easily soluble in water.
The content of soil-available Na in the 0.0–0.6 m soil layer explained more the found beet response to Na concentration than considered for the top- and subsoil separately (). This was why the diagnosis of soil Na concentration should be extended to soil layers deeply located. The threshold level of Na in spring fixed at 120 kg ha−1 (0.0–0.6 m)has been applied to split Na soil content into three classes of the low, medium, and high (). It is notable that the “linear” trend of sodium content in soils was decisive for the values of the threshold values. The highest WSY increase as a result of Na application is expected on soils with Na content below 60 kg ha−1. However, the rate of fertilizer Na for this class should not exceed 90 kg ha−1 because the minimum amount of Na in the studied group of soils was observed at the level of 30 kg ha−1. The influence of K was less pronounced as compared with Na. Nevertheless, it may be considered as the minor factor to be taken into account when establishing recommendations for Na fertilizer. In general, the higher the K/Na ratio in the soil, the stronger the effect of Na fertilization is expected. The critical value of the K/Na ratio was fixed at the level of 15–20:1 ().
Figure 2. Relationship between WSY increase (in%) to applied NaCl and soil K/Na ratio, calculated for soil-available K and Na (extracted with 1 M ammonium acetate), expressed in kg ha−1 for 0.0–0.6 m soil depth.
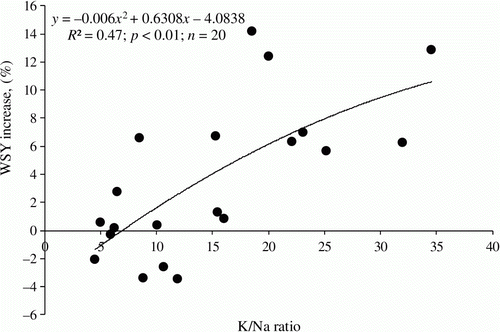
Table VIII. Content of availability form of Na in the soil layer 0.0–0.6 m (extracted by ammonium acetate, pH 7.0, 1:10 m/v) and results interpretation for sugar beet fertilization purposes.
In summary, the role of Na is confined not only to supplementing the deficiency of K in sugar beet plants but also in the regulation of cations’ equilibrium. This study also indicates that the diagnosis of Na and K content should be extended to the analysis of soil layers deeply located.
References
- Allison , M. F. , Jaggard , K. W. and Armstrong , M. J. 1994 . Time of application and chemical form of potassium, phosphorus, magnesium and sodium fertilizers and effects on the growth, yield and quality of sugar beet (Beta vulgaris) . Journal of Agricultural Science, Cambridge , 123 : 61 – 70 . doi: 10.1017/S0021859600067782
- Bell , Ch. I , Milford , G. F. J. and Leigh , R. A. 1996 . “ Sugar beet ” . In Photoassimilate Distribution in Plants and Crops , Edited by: Zamski , E. and Schaffer , A.A. 691 – 707 . New York : Marcel Dekker Inc. .
- Blumwald , E. , Aharon , G. S. and Apse , M. P. 2000 . Sodium transport in plant cells . Biochimica et Biophysica Acta , 1465 : 140 – 151 . doi: 10.1016/S0005-2736(00)00135-8
- Buchholz , K. , Märländer , B. , Puke , H. , Glattkowski , H. and Thielecke , K. 1995 . Neubewertung des technischen Wertes von Zuckerrüben . Zuckerindustrie , 120 : 113 – 121 .
- Cakmak , I. 2005 . The role of potassium in alleviating detrimental effects of abiotic stresses in plants . Journal of Plant Nutrition and Soil Science , 168 : 521 – 530 . doi: 10.1002/jpln.200420485
- D'Onofrio , C. , Kader , A. and Lindberg , S. 2005 . Uptake of sodium in quince, sugar beet, and wheat protoplasts determined by the fluorescent sodium-binding dye benzofuran isophtalate . Journal of Plant Physiology , 162 : 421 – 428 . doi: 10.1016/j.jplph.2004.07.017
- Drycott , A. P. and Russell , G. E. 1974 . Varietal response by sugar beet to nitrogen, sodium and potassium fertilizers . Journal of Agricultural Science, Cambridge , 83 : 181 – 184 . doi: 10.1017/S002185960004716X
- Draycott , A. P. and Durrant , M. J. 1976 . Response by sugar beet to potassium and sodium fertilizers, particularly in relation to soils containing little exchangeable potassium . Journal of Agricultural Science, Cambridge , 87 : 105 – 112 . doi: 10.1017/S0021859600026642
- Draycott , A. P. and Christenson , D. R. 2003 . Nutrients for Sugar Beet Production. Soil-Plant Relationships , Wallingford : CABI Publishing .
- Egnér , H. , Riehm , H. and Domingo , W. R. 1960 . Untersuchungen über die chemische Bodenanalyse als Grundlage für die Beurteilung des Nährstoffzustandes der Böden. II. Chemische Extraktionsmethoden zur Phosphor- und Kaliumbestimmung [Investigation of chemical soil analyses which are used as a basis for determination of soil fertility. II. Chemical extraction methods for determination of phosphorus and potassium concentrations] . Kungliga Lantbrukshögskolans Annaler , 26 : 199 – 215 . [In Swedish]
- FAO . 2012 . Crop water information. Sugar beet . Accessed 12 July 2012, available at: http://www.fao.org/nr/water/cropinfo_sugarbeet.html
- Flowers , T. J. and Dalmond , D. 1992 . Protein synthesis in halophytes: The influence of potassium, sodium and magnesium in vitro . Plant and Soil , 146 : 153 – 161 . doi: 10.1007/BF00012008
- Grzebisz , W. and Diatta , J. 2012 . “ Constraints and solutions to maintain soil productivity: A case study from central Europe ” . In Soil fertility improvement and integrated nutrient management – a global perspective , Edited by: Whalen , J. 159 – 182 . Rijeka , , Croatia : InTech Europe .
- Hajiboland , R. , Joudmand , A. and Fotouhi , K. 2009 . Mild salinity improves sugar beet (Beta vulgaris L.) quality. Acta Agriculturae Scandinavica . Section B – Soil and Plant Science , 59 : 295 – 305 .
- Hampe , T. and Marschner , H. 1982 . Effect of sodium on morphology, water relations, and net photosynthesis in sugar beet leaves . Zeitschrift für Pflanzenphysiologie , 108 : 151 – 162 .
- Haneklaus , S. , Knudsen , L. and Schnug , E. 1998 . Relationship between potassium and sodium in sugar beet . Communications in Soil Science and Plant Analysis , 29 : 1793 – 1798 . doi: 10.1080/00103629809370070
- Harley , A. D. and Gilkes , R. J. 2000 . Factors influencing the release of plant nutrient elements from silicate rocks powders: A geochemical overview . Nutrient Cycling in Agroecosystems , 56 : 11 – 36 . doi: 10.1023/A:1009859309453
- Houba , V. J. G. , Huijbregts , A. W. M. , Wilting , P. , Novozamsky , I. and Gort , G. 1995 . Sugar yield, nitrogen uptake by sugar beet and optimal nitrogen fertilization in relation to nitrogen soil analyses and several additional factors . Biology and Fertility of Soils , 19 : 55 – 59 . doi: 10.1007/BF00336347
- Jobbágy , E. G. and Jackson , R. B. 2001 . The distribution of soil nutrients with depth: Global patterns and the imprint of plants . Biogeochemistry , 53 : 51 – 77 . doi: 10.1023/A:1010760720215
- Katerji , N. , van Hoorn , J. W. , Hamdy , A. and Mastorilli , M. 2003 . Salinity effect on crop development and yield, analysis of salt tolerance according to several classification methods . Agricultural Water Management , 62 : 37 – 66 . doi: 10.1016/S0378-3774(03)00005-2
- Kenter , C. , Hoffmann , C. M. and Märländer , B. 2006 . Effects of weather variables on sugar beet yield development (Beta vulgaris L.) . European Journal of Agronomy , 24 : 62 – 69 . doi: 10.1016/j.eja.2005.05.001
- Koyro , H. 2000 . Effect of high NaCl salinity on plant growth, leaf morphology, and ion composition in leaf tissues of Beta vulgaris sp. maritima . Journal of Applied Botany , 74 : 67 – 73 .
- Lawlor , D. W. and Milford , G. F. J. 1973 . The effect of sodium on growth of water-stressed sugar beet . Annals of Botany , 37 : 597 – 604 .
- LUFA . 2012 . Natrium. Düngeempfehlungen für Acker- und Grünland . Accessed 12 July 2012, available at: http://www.landwirtschaftskammer.de/lufa/download/fachinfo/boden/natrium_duengeempfehlung.pdf
- Malnou , C. S. , Jaggard , K. W. and Sparkes , D. L. 2006 . A canopy approach to nitrogen fertilizer recommendations fort the sugar beet crop . European Journal of Agronomy , 25 : 254 – 263 . doi: 10.1016/j.eja.2006.06.002
- Mäck , G. and Hoffmann , C. M. 2006 . Organ-specific adaptation to low precipitation in solute concentration of sugar beet (Beta vulgaris L.) . European Journal of Agronomy , 25 : 270 – 279 . doi: 10.1016/j.eja.2006.06.004
- Märländer , B. , Hoffmann , C. M. , Koch , H. -J. , Ladewig , E. , Merkes , R. , Petersen , J. and Stockfisch , N. 2003 . Environmental situation and yield performance of sugar beet crop in Germany: Heading for sustainable development . Journal of Agronomy and Crop Science , 189 : 201 – 226 . doi: 10.1046/j.1439-037X.2003.00035.x
- Marschner , H. , Kuiper , P. J. C. and Kylin , A. 1981 . Genotypic difference in response of sugar beet plants to replacement of potassium by sodium . Physiologia Plantarum , 51 : 239 – 244 . doi: 10.1111/j.1399-3054.1981.tb02705.x
- Marschner , H. 1995 . Mineral Nutrition of Higher Plants , London : Academic Press .
- Mäser , P. , Gierth , M. and Schroeder , J. I. 2002 . Molecular mechanisms of potassium and sodium uptake in plants . Plant and Soil , 247 : 43 – 54 . doi: 10.1023/A:1021159130729
- Milford , G. F. J. , Armstrong , M. J. , Jarvis , P. J. , Houghton , B. J. , Bellett-Travers , D. M. , Jones , J. and Leigh , R. A. 2000 . Effect of potassium fertilizer on the yield, quality and potassium offtake of sugar beet crops grown on soils of different potassium status . Journal of Agricultural Science, Cambridge , 135 : 1 – 10 . doi: 10.1017/S0021859699007881
- Munns , R. and Tester , M. 2008 . Mechanisms of salinity tolerance . Annual Review of Plant Biology , 59 : 651 – 681 . doi: 10.1146/annurev.arplant.59.032607.092911
- Nelson , D. W. and Sommers , L. E. 1982 . “ Total carbon, organic carbon, and organic matter ” . In Methods of Soil Analysis, Part 2. Chemical and Microbial Properties , Edited by: Page , A. L. , Miller , R. H. and Keeney , D. R. 530 – 594 . Madison , Wisconsin : ASA-SSSA, Second Edition .
- Niazi , B. H. , Rozema , J. , Broekman , R. A. and Salim , M. 2000 . Dynamics og growth and water relations of fodderbeet and seabeet in response to salinity . Journal of Agronomy and Crop Science , 184 : 101 – 109 . doi: 10.1046/j.1439-037x.2000.00353.x
- Pilon-Smits , E. A. H. , Quinn , C. F. , Tapken , W. , Malagoli , M. and Schiavon , M. 2009 . Physiological functions of beneficial elements . Current Opinion in Plant Biology , 12 : 267 – 274 . doi: 10.1016/j.pbi.2009.04.009
- Rhoades , J. D. and Miayamoto , S. 1990 . “ Testing soils for salinity and sodicity ” . In Soil Testing and Plant Analysis , Edited by: Westerman , R. L. 299 – 333 . Madison , Wisconsin : SSSA Book, Third Edition .
- Römer , W. , Claassen , N. , Steingrobe , B. and Märländer , B. 2004 . Reaktion der Zuckerrübe (Beta vulgaris var. altissima) auf die Kaliumdüngung – ein 20-jähriger Feldversuch [Response of sugar beet (Beta vulgaris var. altissima) to potassium fertilization – a 20-year field experiment] . Journal of Plant Nutrition and Soil Science , 167 : 726 – 735 . doi: 10.1002/jpln.200420437
- StatSoft, Inc . 2012 . Electronic Statistics Textbook . Accessed 5 June 2012, available at: http://www.statsoft.com/textbook
- Stuiver , C. E. E. , Kuiper , P. J. C. , Marschner , H. and Kylin , A. 1981 . Effects of salinity and replacement of K+ by Na+ on lipid composition in two sugar beet inbred lines . Physiologia Plantarum , 52 : 77 – 82 . doi: 10.1111/j.1399-3054.1981.tb06037.x
- Subbarao , G. V. , Wheeler , R. M. , Stutte , G. W. and Levine , L. H. 1999 . How far can sodium substitute for potassium in red beet? . Journal of Plant Nutrition , 22 : 1745 – 1761 . doi: 10.1080/01904169909365751
- Subbarao , G. V. , Wheeler , R. M. , Levine , L. H. and Stutte , G. W. 2001 . Glycine betaine accumulation, ionic and water relations of red-beet at contrasting levels of sodium supply . Journal of Plant Physiology , 158 : 767 – 776 . doi: 10.1078/0176-1617-00309
- Subbarao , G. V. , Ito , O. , Berry , W. L. and Wheeler , R. M. 2003 . Sodium – a functional plant nutrient . Critical Reviews in Plant Sciences , 22 : 391 – 416 .
- Supit , I. , van Diepen , C. A. , de Wit , A. J. W. , Kabat , P. , Baruth , B. and Ludwig , F. 2010 . Recent changes in the climatic yield potential of various crops in Europe . Agricultural Systems , 103 : 683 – 694 . doi: 10.1016/j.agsy.2010.08.009
- Terry , N. and Urlich , A. 1973 . Effects of potassium deficiency on photosynthesis and respiration of leaves of sugar beet under conditions of low sodium supply . Plant Physiology , 51 : 1099 – 1101 . doi: 10.1104/pp.51.6.1099
- Tester , M. and Davenport , R. 2003 . Na+ tolerance and Na+ transport in higher plants . Annals of Botany , 91 : 503 – 527 . doi: 10.1093/aob/mcg058
- Thomas , G. W. 1982 . “ Exchangeable cations ” . In Methods of Soil Analysis, Part 2. Chemical and Microbial Properties , Edited by: Page , A. L. , Miller , R. H. and Keeney , D. R. 159 – 165 . Madison , Wisconsin : ASA-SSSA, Second Edition .
- Tsialtas , J. T. and Maslaris , N. 2005 . Effect of N fertilization rate on sugar yield and non-sugar impurities of sugar beets (Beta vulgaris) grown under Mediterranean conditions . Journal of Agronomy & Crop Science , 191 : 330 – 339 . doi: 10.1111/j.1439-037X.2005.00161.x
- Tsialtas , J. T. and Maslaris , N. 2009 . Selective absorption of K over Na in sugar beet cultivars and its relationship with yield and quality in two contrasting environments of central Greece . Journal of Agronomy & Crop Science , 195 : 384 – 392 . doi: 10.1111/j.1439-037X.2009.00379.x
- Van Lierop , W. 1990 . “ Soil pH and lime requirement determination ” . In Soil Testing and Plant Analysis , Edited by: Westerman , R. L. 76 – 126 . Madison , Wisconsin : SSSA Book, Third Edition .
- Wakeel , A. , Abd-El-Motagally , F. , Steffens , D. and Schubert , S. 2009 . Sodium-induced calcium deficiency in sugar beet during substitution of potassium by sodium . Journal of Plant Nutrition and Soil Science , 172 : 254 – 260 . doi: 10.1002/jpln.200800236
- Wakeel , A. , Steffens , D. and Schubert , S. 2010 . Potassium substitution by sodium in sugar beet (Beta vulgaris) nutrition on K-fixing soils . Journal of Plant Nutrition and Soil Science , 173 : 127 – 134 . doi: 10.1002/jpln.200900270