
Abstract
A new generic, three-dimensional, solute transport component was developed into FLUSH, which is a hydrological model developed for Nordic conditions. Water flow and solute transport descriptions in FLUSH follow the dual-permeability concept, which divides the total soil pore space into mobile soil matrix and macropore systems. The solute transport model was parameterized to simulate the main processes of nitrogen (N) cycle in clayey, subsurface-drained soils during autumn periods after the harvest. The model simulates transport of nitrate and ammonium N, as well as mineralization, nitrification, and denitrification. Reactions in soil are affected by temperature and moisture, as simulated by FLUSH. Ammonium can adsorb on soil particles in both pore systems, while organic N is described in simulations as an immobile solute in the soil matrix. One-dimensional version of the model was applied to two subdrained field sections (1.3 and 3.4 ha) in the Nummela experimental field in southern Finland during two autumn periods (2008 and 2011). The model was able to replicate the measured dynamics of nitrate N concentrations in drain discharge during both the periods. Concentrations were the most dependent on drain discharge dynamics and the rate of nitrification. Measured and simulated ammonium concentrations in drain discharge were about 10 times smaller than nitrate concentrations, even though the levels of N input with initial values and deposition for both inorganic fractions were similar. Successful solute transport simulation results further increase the confidence in the description of the water flow processes in FLUSH.
Introduction
Nitrogen (N) losses from agricultural catchments are governed by climate, cultivation practices, drainage systems, topography, and soil properties, and the related processes are characterized by large temporal and spatial variations (e.g. Vagstad et al. Citation2001; Granlund et al. Citation2008; Bechmann et al. Citation2014). N transport outside the growing seasons forms the major part of the annual and long-term N load (e.g. Rekolainen Citation1993; Vagstad et al. Citation2001; Rankinen et al. Citation2008). In the absence of plant N uptake, the main processes behind N losses from cultivated soils are the mineralization of nitrate from organic matter, and nitrate transport from the field via runoff (Bjorneberg et al. Citation1996). In the autumn period, the magnitude of N loads from the field is mainly affected by rainfall–runoff events transporting the dissolved nitrate N (Rankinen et al. Citation2004), which usually forms the main part of the total agricultural N load (e.g. Paasonen-Kivekäs et al. Citation1999; Vagstad et al. Citation2001). Kløve et al. (Citation2013) reported that climate change may increase nitrate leaching into groundwater reservoirs.
N losses via subsurface drains are an important problem in clayey, cultivated areas (Bjorneberg et al. Citation1996; Mohanty et al. Citation1998), where the drainage installation practices and trench filling material affect water flow (e.g. Turunen et al. Citation2013), solute transport pathways, and resulting N losses (e.g. Turtola & Paajanen Citation1995; Äijö et al. Citation2014). Soil macropores enable rapid preferential flow and transport of dissolved N fractions from the tillage layer to the subsurface drains. In structured, fine-textured soils, preferential flow and transport has a notable effect on water flow and nutrient transport (e.g. Jarvis Citation2007; Paasonen-Kivekäs et al. Citation2008).
Mathematical models can be used to describe the effects of cultivation practices on complex biochemical reactions in soil and losses of nutrients via different pathways in various hydrometeorological conditions. In Finland, Knisel and Turtola (Citation2000) used the GLEAMS model to simulate long-term N loads from a clayey subdrained field, and Granlund et al. (Citation2008) applied the ICECREAM model to investigate the effects of climate change and decreased fertilizer rates on N leaching. In southern Sweden, Salazar et al. (Citation2009) simulated nitrate loads from cultivated fields with the DRAINMOD-NII model. Rankinen et al. (Citation2008) studied nitrate N leaching with different fertilizer scenarios using the COUP model. These one-dimensional (1D) models include components specifically tailored for N transport but include only relatively simple water flow descriptions (except COUP).
Physically based transport models can be used to decompose water flow and solute transport-related processes into components, and account for the spatial distribution of the parameters and variables in the process descriptions. Solute transport in porous media is usually described with a single pore system and the advection-dispersion equation (ADE), which is not well-suited for describing transport in heterogeneous soils, where different pore sizes and spatial variability influence solute movement (Feyen et al. Citation1998). Dual-permeability models divide porosity into mobile matrix and macropore systems (e.g. Šimůnek et al. Citation2003) and include a separate mathematical description for each system (Gerke & van Genuchten Citation1993; Jarvis & Larsbo Citation2012). Water and solute exchange mechanisms between the pore systems are an important part of the dual-permeability models (e.g. Vogel et al. Citation2000). Many models simulate the interaction between the pore systems with the first-order approach, and solute mass exchange between the pore systems is usually composed of advective and dispersive components (e.g. Šimůnek et al. Citation2003).
Even though the theory of solute transport in structured soils is well outlined (e.g. Jarvis Citation2007; Šimůnek & Van Genuchten Citation2008; Köhne et al. Citation2009), information on characterization and parameterization of transport processes in soil macropores is far from complete. Empirical evidence suggests that preferential pathways are biologically more active than bulk soil, but the combined effect of solute biodegradation and adsorption on leaching in macroporous soils remains uncertain (Jarvis Citation2007). Solute retardation in macropores is weaker than in the bulk soil (Jarvis Citation2007) but should not be neglected (Köhne et al. Citation2009). Generic solute transport models have been used to simulate conservative solute transport in porous media (Jarvis Citation2007), but to gain more understanding on parameterization of physical and chemical nonequilibrium processes, transport models on both reactive and conservative solutes should be tested (Šimůnek & van Genuchten Citation2008). Recent studies still report problems with simulating both water flow and solute transport in clayey soils (e.g. Haws et al. Citation2005), warranting further research on the topic.
The objective of the present study was to develop a generic, three-dimensional (3D), multispecies solute transport model and integrate it to FLUSH, which is a 3D hydrological model describing water flow and erosion processes in subdrained clay fields (Warsta Citation2011; Warsta, Karvonen, et al. Citation2013; Warsta, Taskinen, et al. Citation2013). The generic solute transport model is tested by simulating processes of inorganic N in 1D soil columns during autumn periods in two clayey field sections with different drain spacings. The autumn periods were selected to focus on rainfall–runoff events producing solute loads in conditions when load generation was not mixed with vegetation N uptake. The application produces more insight into N movement in aggregated soils and reveals how the drain spacing affects solute transport in clayey fields in the absence of vegetation uptake.
Model description
The structure of the developed solute transport model is based on algorithms used in FLUSH (Warsta Citation2011), which describes 2D water flow in the overland domain and 3D flow in the subsurface domain. The soil porosity is divided into soil matrix and macropore systems that enable simulation of slow water flow in the soil matrix and fast preferential flow in the macropores. In the subsurface domain, water flow is simulated with the Richards equation in both pore systems. Soil temperature in FLUSH is described with the convection–diffusion equation (Warsta et al. Citation2012). Previous model descriptions were presented by Turunen et al. (Citation2013), Warsta, Karvonen, et al. (Citation2013), and Warsta, et al. (Citation2014).
Conceptually, the developed, generic solute transport model is similar to the water flow model, i.e. the field area is divided into overland and subsurface domains, and subsurface soil porosity is further partitioned into matrix and macropore systems. The model can simulate several solutes at the same time, and reaction chains can be formed between the solutes. The solutes enter the overland domain as wet deposition or are initially stored in the subsurface domain. In the overland domain, the solutes are initially stored in depression storage (e.g. Turtola et al. Citation2007) to be available for infiltration with water into the soil matrix and macropores. When the depression storage is full of water, overland flow can laterally transport solutes on the field surface by advection, and discharge to open ditches can lead to a loss of solutes. In the subsurface domain, solutes are transported by advection with water, dispersion due to heterogeneous soil pore pathways and diffusion according to the concentration gradients in soil matrix and macropore systems. Solutes can also be transported between the pore systems by advection and diffusion mechanisms. Nonconservative solutes can adsorb on the soil particles in both pore systems with the equilibrium adsorption concept (e.g. Šimůnek & van Genuchten Citation2008), which slows down solute transport. Solute adsorption and degradation processes are not applied in the surface domain. Subsurface drain discharge and groundwater outflow act as solute sinks in the subsurface domain.
Solute transport in the overland domain is represented with the advection equation:
where hW (m) is the water depth in the soil surface, c (kg m−3) is the solute concentration in the overland domain, Q (m2 h−1) is the unit flow rate (e.g. Warsta, Karvonen, et al. Citation2013), and ss (kg m−2 h−1) describes the sink and source terms in the surface system.
Solute transport in the subsurface system is described with the following equations for the soil matrix and macropores:
where R (–) is the retardation coefficient, q (m h−1) is the volumetric fluid flux density, kb (–) is the decay rate coefficient, S (mg kg−1) is the adsorbed solute mass, ρs (kg m−3) is the soil dry density, ΓS (kg m−3 h−1) is the mass exchange term, w is the macropore fraction of total porosity, SS (h−1) is the source or sink term, and c′ (kg m−3) is the concentration related to the specific source (infiltration, degradation of other solutes) or sink (tillage layer runoff, drain discharge, or groundwater outflow) term. Subscripts m and f refer to the matrix and macropore systems, respectively (Equations 2 and 3). Dispersion coefficients were computed according to Zheng and Bennet (Citation2002). The DXX, DYY, and DZZ terms are the dispersion coefficients in X-, Y-, and Z-directions. The cross terms (DXY, DXZ, DYX, DYZ, DZX, and DZY) are neglected and assumed to be zero.
The solute degradation is described with the first-order reaction, and kb can be affected by soil temperature and moisture. Degradation affects both the soluble and adsorbed forms of the solute. Adsorption of solutes is described with the equilibrium sorption approach (using linear isotherm in this study). Solute retention is calculated with an isotherm-specific retardation factor in each solute cell, both matrix and macropores.
Solute mass exchange between the pore systems is calculated following Gerke and Van Genuchten (Citation1996):
where ΓW is the water exchange term and c* is the solute concentration in matrix or macropores depending on the direction of water flow. The first-order mass exchange coefficient, αs (h−1), in Equation (4) is:
where β(–) is a geometry coefficient, d (m) is the radius of the soil matrix aggregate, and Da (m2 h−1) is the effective diffusion coefficient.
The solute transport to sinks (tillage layer outflow, subsurface drains, and groundwater outflow) is computed with advection. Infiltration is computed as a mass exchange between the overland cell and the underlying top subsurface cell.
The temporal components in the partial differential equations (Equations 1–3) are numerically solved with the backward finite difference method and the spatial components with an implicit finite volume-based method. In the overland domain, the solute transport (Equation 1) is solved by iteration. In the subsurface domain, solute transport (Equations 2 and 3) is solved in the vertical direction with the pentadiagonal matrix algorithm (Warsta, Karvonen, et al. Citation2013) and by iteration in the horizontal directions. The model solves transport sequentially one solute at a time.
In the model application, the solute transport model was parameterized to simulate transport of N fractions including ammonium, nitrate, and organic N (NH4+, NO3−, and Org. N in ) in a subsurface-drained clayey field section. Organic N is described in the simulations as an immobile solute, and it is only influenced by the degradation reaction, where organic N is mineralized (µorg in ) into ammonium N. Ammonium N is simulated as a mobile solute, and it can adsorb on soil particles (KD). Ammonium N is further transformed (µamm) into nitrate N by the nitrification reaction. Nitrate N is treated as a mobile solute without adsorption. It can be transformed into gaseous N in the denitrification reaction (µnit). All the reactions are affected by moisture and temperature. Moisture factor was implemented as a limiting value that determines whether denitrification or nitrification and mineralization occur. Decay rate is modified by soil layer temperature with Equation (6) (Bunnel et al. Citation1977):
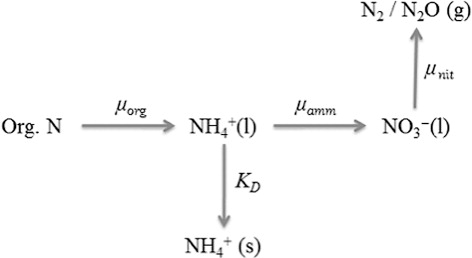
where tq10 (–) and tbas (°C) are calibration parameters (e.g. Jansson & Karlberg Citation2001).
Site and data
Study site characterization
The Nummela experimental site is a subsurface-drained clayey field (; 9.2 ha, slope <1%) located in Jokioinen (60°51′ 59″N 23°25′ 50″E) in southern Finland. The experimental site was established for subsurface drainage studies and has been managed by MTT Agrifood Research Finland. Tillage layer runoff, tile drain discharge, and quality of runoff waters were determined at the site during two consecutive monitoring campaigns (2007–2009 and 2010–2013). The site, cultivation practices, and latest field studies are presented in more detail in Vakkilainen et al. (Citation2008, Citation2010), Turunen et al. (Citation2013), and Äijö et al. (Citation2014).
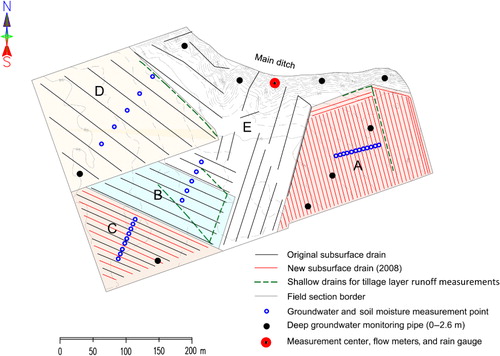
The original subsurface drainage system was installed in 1950s into a depth of 1.0 m, and it consists of clay tiles with an inner diameter of 0.05 m (Vakkilainen et al. Citation2010). In the study, the area was divided into four field sections (A, B, C, and D) with different drain spacings (6, 16, 8, and 32 m). New drainage installations were performed in sections A (2.9 ha) and C (1.7 ha). The field sections B (1.3 ha) and D (3.4 ha) were treated as reference sections without changing the original drainage (Vakkilainen et al. Citation2010).
Annual cultivation practices in all the sections were the same during the study years. Spring sown oats (Avena sativa) was cultivated in 2008 and spring barley (Hordeum vulgare) in 2011. Manure was applied in 2008 and in all the study years, mineral N fertilizers were used with an annual rate of 27–94.5 kg N ha−1. Harvest was done on 24 and 17 September in 2008 and 2011, respectively, and it was followed by autumn tillage in both the years. The measured crop yield and N uptake were in 2008 in the range of 3.8–4.9 t ha−1 and 57.4–78.1 kg ha−1 and in 2011 in the range of 1.9–2.6 t ha−1 and 34.0–50.6 kg ha−1, respectively. N inputs (fertilizer, manure, and seeds) at the beginning of the growing seasons and outputs (harvest) at the end of growing seasons in 2008 and 2011 are presented in .
Table 1. Nitrogen inputs (in spring) and outputs in the reference field sections B and D.
The soil is classified as Vertic Luvic Stagnosols (FAO Citation2007) and has a mean clay content of 67% in the topsoil layer (0–0.35 m) and 72–86% in the subsoil layer (0.35–1 m; Vakkilainen et al. Citation2010). A similar soil was comprehensively described by Yli-Halla et al. (Citation2009). Soil characteristics, including water retention properties, total porosity, macroporosity, and saturated hydraulic conductivity, were determined in 2006 from soil samples gathered from five points in each field section (Vakkilainen et al. Citation2008).
Hydrometeorological data
Tillage layer runoff and drain discharge were measured at 15-min intervals from each field section using Datawater WS Vertical helix meter (Maddalena, Povoletto, Italy). Tillage layer runoff was collected with shallow subsurface drains, installed to a depth of 0.4 m. Hourly values were calculated from the monitoring data. Groundwater level was manually measured in each field section with five plastic groundwater observation tubes that were installed into a depth of 1.5 m. The moisture content of tillage layer (0−0.3 m) was measured manually once a week with the time domain reflectometry (Soil Moisture Equipment Corp., Goleta, CA, USA).
Flow-weighted bulk samples from drain discharge and tillage layer runoff were collected from a discharge volume of 30−200 m3 for laboratory analyses. Concentrations of total, nitrate and ammonium N were determined using analytical methods described by Turtola and Paajanen (Citation1995). The concentration of the bulk sample was assumed to represent the average concentration of the sampling interval. The nitrogen loads via tillage layer runoff and drain discharge were calculated for each sampling interval by multiplying the average concentration of the sampling interval with the cumulative water volume between the sampling time points (Vakkilainen et al. Citation2010).
Hourly meteorological data (precipitation, air temperature, relative humidity, wind speed, and global radiation) were available from the Jokioinen Observatory administered by the Finnish Meteorological Institute. Precipitation was measured at the site at 15-min intervals using the RAINEW 111 tipping bucket rain gauge (RainWise Inc., Bar Harbor, ME, USA), and the data were aggregated to hourly precipitation values. Potential evapotranspiration (PET) was calculated for a reference crop using the Penman–Monteith equation following Allen et al. (Citation1998). Missing data values from the Jokioinen Observatory for the PET calculations were from the Helsinki-Vantaa airport meteorological station (approximately 100 km from Jokioinen; see Turunen et al. Citation2014).
Monthly N deposition values were provided from Jokioinen by the Finnish Environment Institute. The monthly deposition (mg m−2 mo−1) and precipitation were used to determine the mean monthly precipitation concentrations for ammonium and nitrate N.
Results
Model setup and parameterization
The model was tested by comparing simulation results against data from the two field sections (B and D) in the Nummela site. The selected field sections were hydrologically different; section D was wetter than section B due to the wider drain spacing (32 vs. 16 m). We used 1D computational grids to simulate water flow and solute transport in the field sections, while Turunen et al. (Citation2013, Citation2014) simulated water balance in the whole field in 3D. The vertical depth of the modeled soil profile was 2.4 m and it was divided into 16 layers. The layer depths from the top to the bottom of the soil profile were 0.02, 0.05, 0.08, 0.1 × 9, 0.25 × 2, 0.35, and 0.5 m. A single open ditch collected waters exceeding the depression storage (0.01 m) in the overland domain. The subsurface drain depth was set into 1.0 m and the drain diameters to 0.05 and 0.04 m in the B and D sections, respectively. The diameter in D was lower because the drains in D were presumably partly clogged. Measured subsurface drain discharge quantity and quality as well as soil moisture and groundwater table data from 2008 autumn were used for manual model calibration and data from 2011 for model validation. The model performance was assessed visually, and with the Nash–Sutcliffe efficiency (ENS) coefficient (Nash & Sutcliffe Citation1970) and the mean absolute error (MAE).
The flow model parameterization was based on Turunen et al. (Citation2013) with the following changes made due to the 1D soil profile. The recalibrated hydraulic parameters () included overland flow threshold depth (hW, THR), flow path length to the subsurface drain (ΩS), drain diameter (dS), water exchange rate multiplier between the pore systems (ΨW), and lateral saturated hydraulic conductivity multiplier for macropores (Khf, MUL). van Genuchten water retention curves (WRCs; van Genuchten Citation1980) were fitted to measurements from undisturbed soil cores and applied in the soil matrix. WRC used in the macropore system was adopted from Turunen et al. (Citation2013).
Table 2. Calibrated parameter values for the water flow model for the B and D field sections.
At the beginning of the simulation periods, the overland water depths were set to 0.0 m. Groundwater table levels were set to 1.2 m in the B section and 1.5 m in the D section below the soil surface. The presented initial groundwater table levels were estimated from the average measured values in the beginning of autumn.
Data on nitrate and ammonium N concentrations in the drain discharge waters were used to calibrate and validate the solute transport model. Soil-related transport parameters including soil bulk density (ρ = 1500 kg m−3), longitudinal and transverse dispersivities (DL = 0.1 and DT = 0.01 m), and effective molecular diffusivity (Dw = 3.6 × 10⁻⁶ m2 h−1) were set the same for B and D based on literature (e.g. Warsta, Taskinen, et al. Citation2013).
Parameters β, d, and Da in Equation 5 are lumped into ΨS (–). The mass and water exchange parameters in the D section are lower (ΨS = ΨW = 0.001 h−1) than in B (ΨS = 0.1 and ΨW = 0.08 h−1) due to the drain spacing difference. Better-aerated and drier soil in B can promote the development of macropore network and thus increase mass exchange rates between the aggregate and interaggregate space.
The calibrated parameter values related to the N cycle () are presented in . Parameter values for N reactions (kb, amm, kb, org, kb, nit) were the same for both simulated field sections. However, the higher moisture content and the resulting lack of oxygen in the D section caused differences between the fields in the simulated N cycle and transport.
Table 3. Parameter values for nitrogen model for both field sections.
The initial ammonium and nitrate N contents in the soil were estimated according to Pietola et al. (Citation1999). In the validation period, the initial soil N content had to be reevaluated, since there were notable differences between the growing seasons in the calibration (2008) and validation (2011) years. The N inputs at the beginning of the growing season were approximately the same, but N outputs were lower in the validation period compared to the calibration period (40% lower for B and 35% for D; ). The initial soil N values in the validation period were estimated from N budget (input–output) in the field. The initial calibrated soil N masses, N distribution in the profile, and monthly deposition ranges during the simulated periods are presented in .
Table 4. Calibrated initial nitrogen mass and its distribution (in parentheses) in soil and estimated deposition ranges in the simulations.
Calibration results
Corrected precipitation during the calibration period was 298 mm (646 mm in June 2008–May 2009), and precipitation occurred mostly in the middle part of the period. The mean air temperature in the period was 4.2°C. For section B, the simulated drain discharge was 34%, groundwater outflow was 28%, and tillage layer runoff was 15% of precipitation. For section D, groundwater outflow was 34%, drain discharge was 28%, and tillage layer runoff was 22% of precipitation. Evapotranspiration was 11% for both the field sections. The large drain spacing and steep slope next to D led to a higher groundwater outflow from D than B (Turunen et al. Citation2013). Also it was noticed that the slope and the large drain spacing increased tillage layer runoff in D compared to the flat B section, although there were some inaccuracies in the data collected from B (Vakkilainen et al. Citation2010).
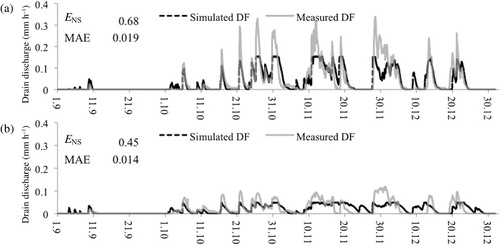
The observed and simulated hourly drain discharge results from both the field sections with the ENS and MAE values during the calibration period 2008 are presented in . Cumulative drain discharge results were underestimated for B and overestimated for D. The MAE value was slightly higher for B than for D, while ENS was better for B than for D (0.68 vs. 0.45).
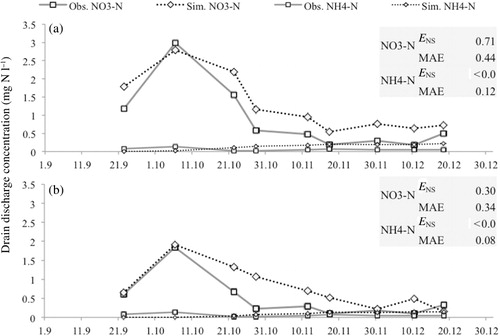
Simulations of nitrate N concentrations in drain discharge were more successful than ammonium N concentrations in terms of ENS (). On the other hand, the drain discharge MAE was much smaller for ammonium than for nitrate N (0.08–0.12 vs. 0.34–0.44; ). Both the measured and simulated ammonium concentrations were approximately 10 times lower compared to the nitrate concentrations due to adsorption in the soil profile. Simulation of low concentrations should be evaluated with a different accuracy criterion (Köhne et al. Citation2009), and it can be difficult to reproduce the measured ammonium concentration dynamics in drain discharge due to the complex adsorption–desorption processes occurring during transport. Despite the fact that the initial values for soil nitrate and ammonium N were approximately the same and the deposition concentrations for both solutes were close to each other, the model was able to correctly simulate the different magnitudes of ammonium and nitrate N concentrations in drain discharge.
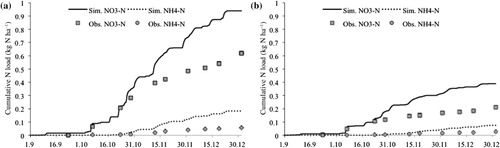
Transport of ammonium is rarely included in N simulations because ammonium N has a small effect on the total N load and nitrate N dominates the N load from mineral agricultural soils (e.g. Paasonen-Kivekäs et al. Citation1999; Salazar et al. Citation2009; Dayaani et al. Citation2010). The simulated cumulative loads of ammonium and nitrate N were overestimated in the calibration period () compared to the values estimated from data. Dynamics of N concentrations in drain discharge from the B and D sections were similar, but the total nitrate and ammonium N loads were greater from B than from D (). This was due to the higher drain discharge volume from B (34 vs. 18% of precipitation) while in D tillage layer runoff had a greater role (22 vs. 15% of precipitation).
Validation results
In the validation period, corrected precipitation was 306 mm (693 mm in June 2008 to May 2009) and occurred at the beginning and the end of the simulated period. Validation period was slightly warmer (5.9°C) than the calibration period. For section B, the simulated drain discharge was 38%, groundwater outflow was 29%, and tillage layer runoff was 11% of precipitation. For section D, groundwater outflow was 36%, tillage layer runoff was 21%, and drain discharge was 19% of precipitation. Evapotranspiration was 11% for both the field sections. According to the simulated and measured water balance, tillage layer runoff from D was 10% higher compared to drain discharge, whereas in B drain discharge was over three times higher than tillage layer runoff.
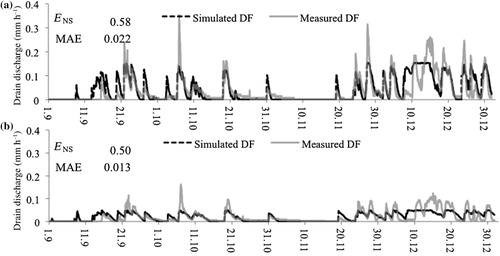
The observed and simulated hourly drain discharge values in 2011 are presented in . The cumulative drain discharges from both the field sections were approximately the same as during the calibration period. The MAEs for validation period were similar between the field sections (0.022 vs. 0.013 in B and D, respectively) and with the calibration period (0.019 vs. 0.014 in B and D, respectively). During both the periods, the simulated hourly drain discharge peaks were lower compared to observations ( and ). Despite the simulated lower peaks, the cumulative drain discharge was overestimated by 7% for B. Drain discharge from D was underestimated by 5%.
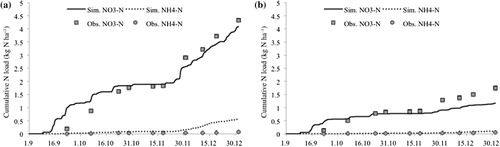
In the validation period, the simulated nitrate N loads () were lower compared to loads estimated from data, while in calibration it was vice versa. The underestimation was due to the low simulated concentrations during high drain discharge events, although some simulated concentrations exceeded the observed values (). The simulated ammonium N loads were again overestimated compared to the observations. Otherwise, the results were similar in the validation period compared to calibration. The tillage layer runoff was more prominent in D (21% of precipitation) than in B (11%). The collector drains used in tillage layer runoff measurements were repaired in November 2011, which may have affected soil hydrology and solute transport. The activities took place just before the second peak value in nitrate N concentrations ().
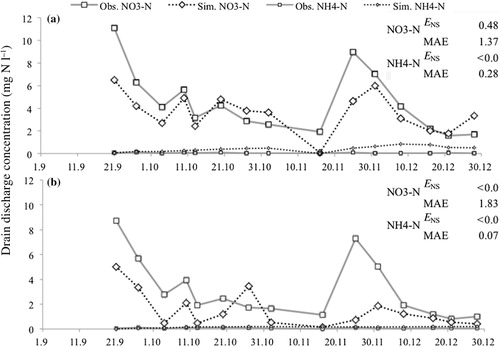
In the middle of the validation period, there was a dry phase, which had a notable effect on the dynamics of N concentrations in drain discharge (). Nitrate N accumulated in the profile during the dry phase and was washed away during the following precipitation events ().
Sensitivity analysis
In the sensitivity analysis, the calibrated water flow and solute transport-related parameter values were manually increased and decreased by 10%, and the effects on solute loads were recorded (Warsta, Taskinen, et al. Citation2013). This local method is used to detect the net effect of a single parameter on the simulation result (Rankinen et al. Citation2013). The effects on loads in drain discharge and tillage layer runoff were investigated, and the parameters were organized into a list according to their ranks (e.g. Warsta, Karvonen, et al. Citation2013; Warsta, Taskinen, et al. Citation2013). The sensitivity analysis was conducted with data from the B section with the validation period model setup. The analysis was made separately for nitrate and ammonium N, but only the nitrate results are discussed here because the ammonium N results were mostly similar. A clear difference was seen in temperature-related parameters, which had a larger effect than moisture limiter on ammonium N transport, while opposite was true for nitrate N. The temperature limiter had a similar effect on both the N fractions, but the moisture limiter had a minor effect on ammonium N compared to nitrate N. The effect may have been caused by different water contents in the matrix and macropore systems because the temperature was the same in both pore systems. By decreasing the moisture limiter, we increased the denitrification rate and, in turn, decreased nitrification and mineralization in the soil matrix. Nitrification still occurred in macropores where water content was small. This modification only slightly increased ammonium N losses compared to the decrease in nitrate N losses.
The decay rate limiters had high ranks (1, 2, and 5) on the list due to their notable effect on the load via drain discharge. Decreasing the moisture limit value had a major effect on nitrate N loss via drain discharge (Rank 1) but did not affect nitrate N losses via tillage layer runoff. Distribution coefficient slowed down infiltration of ammonium N and further decreased the amount of nitrate N formation in nitrification. The denitrification rate was one of the least sensitive parameters tested in the analysis, which may have been caused by the dominant effect of moisture and temperature limiters on decay rates. Initial storage values had high rankings for both the fractions (Ranks 4 and 5 for nitrate N and ammonium N, respectively), i.e. initial values for soil N content played a major role in the simulation results for drain discharge.
Water flow-related parameters had a notable effect on N loads in surface and subsurface domains (Khf, MUL, drain parameters, ΩS, αW, and hW, THR) due to the dominant nature of advective transport. Similar effects were presented by Warsta, Taskinen, et al. (Citation2013) in a sensitivity analysis for suspended sediment transport. Water flow-related parameters directly affect the infiltration capacity of the soil and the distribution of total runoff into tillage layer runoff, drain discharge, and groundwater outflow. Also, the water exchange coefficient controls water exchange rate between the pore systems and thus advective transport between the matrix and macropores.
Discussion
Many model applications investigating N processes in cultivated fields are focused on simulating only nitrate or total N loads (e.g. Knisel & Turtola Citation2000; Granlund et al. Citation2008; Rankinen et al. Citation2008; Salazar et al. Citation2009). In this study, we simulated nitrate and ammonium N concentrations in drain discharge, and organic N was included in the model as an immobile solute. It is important to include the main N fractions in the simulations because reproducing only the nitrate N load does not guarantee that the model simulates the nitrogen cycle correctly. By simulating ammonium and organic matter-related processes, we were able to quantify the chemical reaction chain from organic to nitrate N.
N models (e.g. COUP, DRAINMOD-NII, and GLEAMS) usually focus on the description of complicated parts of N cycle and its interactions with other solutes, mainly carbon. The models, however, often apply simplified water flow descriptions and do not simulate dynamic flow phenomena in structured soils, even though moving water is the main transport mechanism for solutes. In DRAINMOD-NII model (Youssef et al. Citation2005), for example, soil moisture profiles are modeled as successive hydraulic equilibrium states, although in a clay soil profile hydraulic pressure heads rarely reach static steady-state conditions. Primary problem with the explicit N models is that they are essentially hardwired, and the modeler needs to change the model code and compile it to include additional solutes or processes into the system. There is a call for developing more generic models that simulate water flow and transport of multiple solutes in several pore systems and are suitable for structured (Rasa et al. Citation2009) and heterogeneous (Frey et al. Citation2012) soils. In our applications, soil shrinkage and swelling processes were neglected, and the shrinkage-swelling submodel of FLUSH (Warsta, Karvonen, et al. Citation2013) was turned off to minimize the complexity of interpreting the solute transport results. Only permanent macropores composed of plant root conduits and earthworm burrows were included (e.g. Turunen et al. Citation2013).
Our simulations of short autumn periods were limited but revealed important controlling factors behind load generation after the growing season. Earlier studies (e.g. Larsson & Jarvis Citation1999; Delin & Stenberg Citation2014) suggested that annual nitrate leaching is not necessarily dominated by the fertilization rate but by the uptake of N by plants during the growing season. From our study, we can draw similar conclusions, because the total amount of N in fertilizer applications prior to calibration and validation periods was similar but total nitrate losses were clearly different between the two periods (0.212–0.62 and 1.75–4.33 kg ha−1 in calibration and validation, respectively). Better simulation results for the validation period were achieved when the initial soil N content was determined using the N balance (input–output) of the preceding growing season. However, Salo and Turtola (Citation2006) asserted that annual N balance was not a good indicator for N load evaluation, and according to Rankinen et al. (Citation2008), nutrient balances contain a large number of uncertainties. Sensitivity analysis underlined the importance of the initial N content in soil. This has been recognized also in other model studies, e.g. with GLEAMS (Knisel & Turtola Citation2000) and DRAINMOD-NII (Dayaani et al. Citation2010).
Hydrological conditions link agricultural practices to nutrient leaching and water quality (e.g. Vagstad et al. Citation2004). This was also evident in the Nummela field simulations, since differences in N losses were determined by the amount of runoff as N concentrations were similar in the investigated field sections. The dry phase in the validation period led to the most distinct change in concentrations, which was seen as increased nitrate N load during the first rains after the dry period (e.g. Ekholm et al. Citation2007; Rankinen et al. Citation2008).
The validated model allowed us to produce numerical experiments to detect how processes in matrix and macropores controlled the N balance. When we limited ammonium retardation into the soil matrix, concentration results in drain discharge were far less in agreement with the observations compared to when adsorption was active in both pore systems. Köhne et al. (Citation2009) noted that despite the limited contact time and area, sorption also affects solute transport in the preferential flow domain. According to Jarvis (Citation2007), macropores can be chemically and microbiologically active places, and degradation should be considered in the preferential flow domain (Köhne et al. Citation2009). When we decreased the value of the decay moisture limiter (increasing denitrification occurrence) in the sensitivity analysis, we discovered that macropores were an important space for nitrification and therefore nitrate N leaching. Limiting the degradation process to soil matrix only would have caused underestimations in nitrate N leaching. Granlund et al. (Citation2000) reported that nitrate N leaching was depended on soil moisture content and thermal conductivity, which regulated the occurrence of denitrification and mineralization. Nonetheless, limiting solute degradation to only the liquid state did not have a visible effect on ammonium and nitrate N concentrations, but increased nitrogen content in the soil matrix.
Two- or multi-porosity models can describe solute sorption with physical and chemical nonequilibrium approaches (e.g. Šimůnek & van Genuchten Citation2008). According to Jarvis (Citation2007), solute transport in soil macropores should not be described with an equilibrium approach. In our study, kinetic sorption was implemented as a physical nonequilibrium between the soil matrix and macropores using mass exchange between the pore systems as a part of the adsorption mechanism.
A generic, 3D, dual-permeability, multispecies transport model was developed into the FLUSH model. The generic nature of the transport model facilitates simulation of a range of degrading and adsorbing solutes. The transport model component is fully coupled to FLUSH and can utilize all geometry-, water-, and temperature-related variables in the simulations. The approach also enables connection of hydraulic functions to the solute variables facilitating simulation of e.g. density-driven flow in the future. The 3D structure of the model can be used to assess solute loads with groundwater outflow from an area.
The model was able to simulate 1D transport of ammonium and nitrate and corresponding loads via subsurface drains in two clayey field sections in southern Finland during two autumn periods (calibration and validation). The two sites with different drain spacing and topography showed minor differences between N concentrations, but clear differences between runoff components and N loads. At both the sites, the nitrate N concentrations were clearly higher and varied more than the ammonium N concentrations. The main modeling challenge was to replicate the hydrology of the study sites and the different concentration levels of inorganic N fractions. Moisture limiter controlling soil N reactions restricted reactions more in the soil matrix than in the macropore domain, while temperature had a similar effect on degradation in both pore systems. Simulation of ammonium N transport was more successful when adsorption was applied in both soil matrix and macropore systems instead of applying the process only in the matrix. The effect of diffusive solute exchange between the pore systems was minimal compared to advective mass exchange.
Acknowledgments
We acknowledge CSC – IT Center for Science Ltd. for the allocation of computational resources. We would like to acknowledge Helena Äijö, Laura Alakukku, and Merja Myllys for their support in the research project. We thank Johannes Deelstra and anonymous reviewers for their constructive comments.
Additional information
Funding
References
- Äijö H, Myllys M, Nurminen J, Turunen M, Warsta L, Paasonen-Kivekäs M, Korpelainen E, Salo H, Sikkilä M, Alakukku L, et al. 2014. PVO2-hanke. Salaojitustekniikat ja pellon vesitalouden optimointi – Loppuraportti 2014 [Field drainage methods and optimizing water management of agricultural fields (PVO2) – Final report In 2014]. Salaojituksen tutkimusyhdistys ry:n tiedote 31. Helsinki (Finland): Finnish Drainage Research Association; 105 p.
- Allen RG, Pereira LS, Raes DR, Smith M. 1998. Crop evapotranspiration: guidelines for computing crop water requirements. FAO Irrigation and drainage paper No. 56. Rome (Italy): FAO; 300 p. ISBN: 92-5-104219-5.
- Bechmann M, Blicher-Mathiesen G, Kyllmar K, Iital A, Lagzdiņš A, Salo T. In press 2014. Nitrogen application, balances and their effect on water quality in small catchments in the Nordic–Baltic countries. Agric Ecosyst Environ.
- Bjorneberg DL, Kanwar RS, Melvin SW. 1996. Seasonal changes in flow and nitrate-N loss from subsurface drains. Trans ASAE. 39:961–976.
- Bunnell FL, Tait DEN, Flanagan PW, Van Clever K. 1977. Microbial respiration and substrate weight loss—I: a general model of the influences of abiotic variables. Soil Biol Biochem. 9:33–40.
- Dayyani S, Prasher SO, Madani A, Madramootoo CA. 2010. Development of DRAIN–WARMF model to simulate flow and nitrogen transport in a tile-drained agricultural watershed in Eastern Canada. Agr Water Manage. 98:55–68.
- Delin S, Stenberg M. 2014. Effect of nitrogen fertilization on nitrate leaching in relation to grain yield response on loamy sand in Sweden. Eur J Agron. 52:291–296.
- Ekholm P, Granlund K, Kauppila P, Mitikka S, Niemi J, Rankinen K, Räike A, Räsänen J. 2007. Influence of EU policy on agricultural nutrient losses and the state of receiving surface waters in Finland. Agr Food Sci. 16:282–300.
- FAO. 2007. World reference base for soil resources 2006, first update 2007. World Soil Resources Reports No. 103. Rome: FAO.
- Feyen J, Jacques D, Timmerman A, Vanderborght J. 1998. Modelling water and solute transport in heterogenous soils: a review of recent approaches. J Agric Engng Res. 70:231–256.
- Frey SK, Rudolph DL, Conant Jr B. 2012. Bromide and chloride tracer movement in macroporous tile-drained agricultural soil during an annual climatic cycle. J Hydrol. 460:77–89.
- Gerke HH, Van Genuchten MTh. 1993. A dual-porosity model for simulating the preferential movement of water and solutes in structured porous media. Water Resour Res. 29:305–319.
- Gerke HH, Van Genuchten MTh. 1996. Macroscopic representation of structural geometry for simulating water and solute movement in dual-porosity media. Adv Water Resour. 19:343–351.
- Granlund K, Bärlund I, Salo T, Esala M, Posch M. 2008. The effect of decreasing fertilization on agricultural nitrogen leaching: a model study. Agr Food Sci. 16:376–386.
- Granlund K, Rekolainen S, Grönroos J, Nikander A, Laine Y. 2000. Estimation of the impact of fertilisation rate on nitrate leaching in Finland using a mathematical simulation model. Agric Ecosyst Environ. 80:1–13.
- Haws NW, Rao PSC, Šimůnek J, Poyer IC. 2005. Single-porosity and dual-porosity modeling of water flow and solute transport in subsurface-drained fields using effective field-scale parameters. J Hydrol. 313:257–273.
- Jansson P-E, Karlberg L, editors. 2001. Coupled heat and mass transfer model for soil-plant-atmosphere systems. Stockholm: Royal Institute of Technology, Department of Civil and Environmental Engineering. 327 p. Available from: www2.lwr.kth.se/Vara%20Datorprogram/CoupModel/coupmanual.pdf
- Jarvis NJ. 2007. A review of non‐equilibrium water flow and solute transport in soil macropores: principles, controlling factors and consequences for water quality. Eur J Soil Sci. 58:523–546.
- Jarvis N, Larsbo M. 2012. MACRO (v5.2): model use, calibration, and validation. T ASABE. 55:1413–1423.
- Kløve B, Ala-Aho P, Bertrand G, Gurdak JJ, Kupfersberger H, Kværner J, Muotka T, Mykra H, Preda E, Rossi P, et al. 2013. Climate change impacts on groundwater and dependent ecosystems. J Hydrol. 518:250–266.
- Knisel WG, Turtola E. 2000. GLEAMS model application on a heavy clay soil in Finland. Agr Water Manage. 43:285–309.
- Köhne JM, Köhne S, Šimůnek J. 2009. A review of model applications for structured soils: b) Pesticide transport. J Contam Hydrol. 104:36–60.
- Larsson MH, Jarvis NJ. 1999. A dual-porosity model to quantify macropore flow effects on nitrate leaching. J Environ Qual. 28:1298–1307.
- Mohanty BP, Bowman RS, Hendrickx JMH, Šimůnek J, Van Genuchten MTh. 1998. Preferential transport of nitrate to a tile drain in an intermittent-flood-irrigated field: model development and experimental evaluation. Water Resour Res. 34:1061–1076.
- Nash J, Sutcliffe JV. 1970. River flow forecasting through conceptual models part I—A discussion of principles. J Hydrol. 10:282–290.
- Paasonen-Kivekäs M, Koivusalo H, Karvonen T, Vakkilainen P, Virtanen J. 1999. Nitrogen transport via surface and subsurface flow in an agricultural field. In: Heathwaite L, editor. Impact of land-use change on nutrient loads from diffuse sources. Birmingham: IAHS Publ. no. 257; p. 163–169.
- Paasonen-Kivekäs M, Vakkilainen P, Karvonen T. 2008. Nutrient transport through tile drains on a clayey field. 10th International Drainage Workshop of ICID Working Group on Drainage, Helsinki–Tallinn, Finland– Estonia; 2008 July 6–11, Conference Proceedings; p. 142–152.
- Pietola L, Tanni R, Elonen P. 1999. Responses of yield and N use of spring sown crops to N fertilization, with special reference to the use of plant growth regulators. Agr Food Sci. 8:423–440.
- Rankinen K, Granlund K, Bärlund I. 2004. Modelling of seasonal effects of soil processes on N leaching in northern latitudes. Nord Hydrol. 35:347–357.
- Rankinen K, Granlund K, Futter MN, Butterfield D, Wade AJ, Skeffington R, Arvola L, Veijalainen N, Huttunen I. Lepistö A. 2013. Controls on inorganic nitrogen leaching from Finnish catchments assessed using a sensitivity and uncertainty analysis of the INCA-N model. Boreal Environ Res. 18:373–386.
- Rankinen K, Salo T, Granlund K. 2008. Simulated nitrogen leaching, nitrogen mass field balances and their correlation on four farms in south-western Finland during the period 2000–2005. Agr Food Sci. 16:387–406.
- Rasa K, Horn R, Räty M, Yli-Halla M, Pietola L. 2009. Shrinkage properties of differently managed clay soils in Finland. Soil Use Manage. 25:175–182.
- Rekolainen S. 1993. Assessment and Mitigation of Agricultural Water Pollution. Helsinki, Finland: Publications of the Water and Environment Research Institute, National Board of Waters and the Environment, p. 12.
- Salazar O, Wesström I, Youssef MA, Skaggs RW, JoelA. 2009. Evaluation of the DRAINMOD–N II model for predicting nitrogen losses in a loamy sand under cultivation in south-east Sweden. Agr Water Manage. 96:267–281.
- Salo T, Turtola E. 2006. Nitrogen balance as an indicator of nitrogen leaching in Finland. Agr Ecosyst Environ. 113:98–107.
- Šimůnek J, Jarvis NJ, Van Genuchten MTh, Gärdenäs A. 2003. Review and comparison of models for describing non-equilibrium and preferential flow and transport in the vadose zone. J Hydrol. 272:14–35.
- Šimůnek J, Van Genuchten MTh. 2008. Modeling non-equilibrium flow and transport using Hydrus. Vadose Zone J. 7:782–797.
- Turtola E, Alakukku L, Uusitalo R, Kaseva A. 2007. Surface runoff, subsurface drainflow and soil erosion as affected by tillage in a clayey Finnish soil. Agr Food Sci. 16:332–351.
- Turtola E, Paajanen A. 1995. Influence of improved subsurface drainage on phosphorus losses and nitrogen leaching from a heavy clay soil. Agr Water Manage. 28:295–310.
- Turunen M, Warsta L, Paasonen-Kivekäs M, Nurminen J, Koivusalo H. 2014. Simulating water balance and evapotranspiration in a subsurface drained clayey agricultural field in high latitude conditions. Acta Agr Scand B-S P. Accepted manuscript.
- Turunen M, Warsta L, Paasonen-Kivekäs M, Nurminen J, Myllys M, Alakukku L, Äijö H, Puustinen M, Koivusalo H. 2013. Modeling water balance and effects of different subsurface drainage methods on water outflow components in a clayey agricultural field in boreal conditions. Agr Water Manage. 121:135–148.
- Vagstad N, Stålnacke P, Andersen HE, Deelstra J, Gustafson A, Ital A, Jansons V, Kyllmar K, Loigu E, Rekolainen S, et al. 2001. Nutrient losses from agriculture in the Nordic and Baltic countries. Measurements in small agricultural catchments and national agro-environmental statistics. Copenhagen: TemaNord, Nordic Council of Ministers.
- Vagstad N, Stålnacke P, Andersen H-E, Deelstra J, Jansons V, Kyllmar K, Loigu E, Rekolainen S, Tumas R. 2004. Regional variations in diffuse nitrogen losses from agriculture in the Nordic and Baltic regions. Hydrol Earth Syst Sci. 8:651–662.
- Vakkilainen P, Alakukku L, Koskiaho J, Myllys M, Nurminen J, Paasonen-Kivekäs M, Peltomaa R, Puustinen M, Äijö H. 2010. Pellon vesitalouden optimointi – Loppuraportti 2010 [Field drainage methods and optimizing water management of agricultural fields (PVO) – Final report In 2010]. Salaojituksen tutkimusyhdistys ry:n tiedote 30. Helsinki (Finland): Finnish Drainage Research Association; 114 p.
- Vakkilainen P, Alakukku L, Myllys M, Nurminen J, Paasonen-Kivekäs M, Peltomaa R, Puustinen M, Äijö H. 2008. Pellon vesitalouden optimointi – Väliraportti 2008 [Field drainage methods and optimizing water management of agricultural fields (PVO) – Mid report In 2008]. Salaojituksen tutkimusyhdistys ry:n tiedote 29. Helsinki (Finland): Finnish Drainage Research Association; 100 p.
- van Genuchten MTh. 1980. A closed-form equation for predicting the hydraulic conductivity of unsaturated soils. Soil Sci Soc Am J. 44:892–898.
- Vogel T, Gerke H, Zhang R, van Genuchten M. 2000. Modeling flow and transport in a two-dimensional dual-permeability system with spatially variable hydraulic properties. J Hydrol. 238:78–89.
- Warsta L. 2011. Modelling water flow and soil erosion in clayey, subsurface drained agricultural fields [dissertation]. Espoo, Finland: Aalto University, School of Engineering, Department of Civil and Environmental Engineering. 212 pp. Available from: http://lib.tkk.fi/Diss/2011/isbn9789526042893/isbn9789526042893.pdf
- Warsta L, Karvonen T, Koivusalo H, Paasonen-Kivekäs M, Taskinen A. 2013. Simulation of water balance in a clayey, subsurface drained agricultural field with three-dimensional FLUSH model. J Hydrol. 476:395–409.
- Warsta L, Taskinen A, Koivusalo H, Paasonen-Kivekäs M, Karvonen T. 2013. Modelling soil erosion in a clayey, subsurface-drained agricultural field with a three-dimensional FLUSH model. J Hydrol. 498:132–143.
- Warsta L, Taskinen A, Paasonen-Kivekäs M, Karvonen T, Koivusalo H. 2014. Spatially distributed simulation of water balance and sediment transport in an agricultural field. Soil Till Res. 143:26–37.
- Warsta L, Turunen M, Koivusalo H, Paasonen-Kivekäs M, Karvonen T, Taskinen A. 2012. Modelling heat transport and freezing and thawing processes in a clayey, subsurface drained agricultural field. Paper presented at: 11th ICID Int. Drainage Workshop on Agricultural Drainage, Needs and Future Priorities; 2012 September 23–27; Cairo, Egypt.
- Yli-Halla M, Mokma DL, Alakukku L. 2009. Evidence for the formation of Luvisols/Alfisols as a response to coupled pedogenic and anthropogenic influences in a clay soil in Finland. Agr Food Sci Finland. 18:388–401.
- Youssef MY, Skaggs RW, Chescheir GM, Gilliam JW. 2005. The Nitrogen Simulation Model, DRAINMOD-N II. Trans ASAE. 48:611–626.
- Zheng C, Bennet GD. 2002. Applied contaminant transport modelling. 2nd ed. New York: Wiley; 621p.