
Abstract
Artificial subsurface drainage systems are a common water management practice to remove excess water from agricultural land in the Baltic and Nordic countries. Unfortunately, these systems also serve as nutrient transport pathways from agricultural fields to downstream waterbodies. The objective of this study was to determine the status of subsurface drainage water in the context of implementation of the European Union (EU) Water Framework Directive (WFD) and EU Nitrate Directive (ND), to investigate the impact of hydrology and mineral fertilizer application on nutrient losses through subsurface drainage systems and to evaluate the possible effects of climate change on drainage and nutrient loss. This research was conducted from 1995 through 2013 at the agricultural run-off–monitoring sites in Berze and Mellupite. Continuous-flow measurement data and composite water samples were collected on a monthly basis for assessment of total nitrogen (TN), nitrate–nitrogen (NO3–N) and total phosphorus (TP) in drainage water. Results from the study indicated that the mean annual NO3–N concentration was slightly below the threshold level defined by ND, while TN concentrations exceeded the threshold level for good chemical status of water according to WFD. Differences in TN losses were mainly driven by the hydrologic behaviour at the study sites rather than by mineral fertilizer application rates, whereas TP losses under similar application rates were affected by open inlets for surface water accumulation. The comparison of meteorological data for the research period (1995–2013) with the long-term mean (1950–1994) showed a pronounced evidence of climate change. The mean annual precipitation amount has increased at both Berze and Mellupite monitoring sites by 36 mm and 42 mm, respectively, compared to the long-term mean for 1950–1994. Meanwhile, the mean annual temperature during the research period was 7.3°C for Berze and 6.4°C for Mellupite, which is 1.4°C and 0.6°C warmer than long-term mean.
Introduction
Increased nutrient losses to surface waters have led to nutrient enrichment and eutrophication in the Baltic Sea (HELCOM Citation2009). Non-point source pollution from agriculture is the primary contributor of nitrogen (N) and phosphorus (P) riverine inputs and the main cause of water quality degradation in the Baltic Sea (HELCOM Citation2011). According to the recent land-use inventory, the agricultural land covers 2,376,869.7 ha or 36.9% of the total land in Latvia (State Land Service of Latvia Citation2014), about 1,120,000 ha of which are used as arable land for crop production (Central Statistical Bureau of Latvia Citation2010). In most cases, intensive agricultural production would be impossible without artificial drainage. Humid climate with pronounced water excess in combination with poorly drained soils determines the necessity of agricultural drainage in Latvia (Šķiņķis Citation1986).
However, despite all positive effects of agricultural drainage on agricultural production, there is a concern about increased N losses to surface waters through subsurface drainage systems. Several studies have been conducted in the Nordic–Baltic countries to determine the relationship between N balance and N leaching (Bechmann et al. Citation1998; Jansons et al. Citation2003). In most of the agricultural catchments included in these studies, no significant relationship between the annual N balance and N concentration and loss was identified. Deelstra et al. (Citation2005) and Lagzdiņš et al. (Citation2012) concluded that in two small agriculture-dominated catchments in Latvia, the scale of measurements is an important factor effecting N concentrations, i.e. the highest N concentrations were detected at the plot scale measurements followed by the field and small catchment. Moreover, studies have shown that the share of arable land in the catchment area has a positive correlation with N concentrations and losses in stream water (Jansons et al. Citation2003; Iital et al. Citation2005; Kyllmar et al. Citation2006). Deelstra and Iital (Citation2008) and Deelstra et al. (Citation2014) concluded that hydrological behaviour can vary significantly among the agricultural catchments mainly due to the differences in topography, subsurface drainage intensity, and soils. These studies also showed a positive relation between run-off and nitrogen losses. Subsurface drainage systems may also affect P losses from the agricultural land. Gilliam et al. (Citation1999) observed that subsurface drainage reduces surface run-off-induced losses of sediment and phosphorus. P in both soluble and particulate forms can be lost from agricultural soils via subsurface drainage systems, through surface water inlets, preferential flow paths or macropores (Heathwaite et al. Citation1996; Ulén Citation2006; Gentry et al. Citation2007).
Water quality improvements in Latvia are required by regulations and tools developed by the Helsinki Commission (HELCOM) and European Union (EU). The HELCOM Baltic Sea Action Plan aims to reduce nutrient inputs to the Baltic Sea with the objective to reach good environmental status by 2021 (HELCOM Citation2007). In the context of the EU Water Framework Directive (WFD; EC Citation2000), the concentrations of total nitrogen (TN) and total phosphorus (TP) are used for the classification of the chemical status of surface water bodies, whereas nitrate–nitrogen (NO3–N) concentrations have to be monitored by all member states under the requirements of EU Nitrate Directive (ND; EC Citation1991).
The objectives of this study were to (1) to determine the status of nutrient concentration in subsurface drainage water within the context of the implementation of the WFD and ND; (2) investigate the effect of the hydrologic behaviour and mineral fertilizer application rates on nutrient concentration and loss and (3) evaluate the possible impacts of climate change on drainage and nutrient loss.
Materials and methods
Research sites and field management
The study was conducted on two subsurface drainage fields located at the Berze (56°42′11.62″ N, 23°22′46.68″ E) and Mellupite (56°29′77.90″ N, 22°14′12.53″ E) research sites. The research at the selected sites is part of the Agricultural Runoff Monitoring programme in Latvia. The water quality monitoring system at the sites was established in 1994 and until now used for nutrient-leaching studies. This paper presents results of field measurements obtained from 1995 through 2013.
According to the WFD, the Berze and Mellupite research sites are situated in Lielupe and Venta river basin districts, respectively, and can be considered to represent farming activities and nutrient loading in these particular basins. In order to assess the chemical status of surface waters relative to the WFD, certain threshold values for TN and TP concentrations are established in Latvia. Threshold values of 2.5 mg l–1 and 0.09 mg l–1 for TN and TP, respectively, are used as criteria for good chemical status in river waterbodies that meet type-specific conditions including catchment area size (<100 km2) and stream gradient (<1 m km–1) (RBMP Citation2009). The specific threshold values for subsurface drainage water are not yet implemented in the Latvian legislation. Therefore, the numerical criteria defined for the river basins are used for the assessment of nutrient concentrations in the tile flow. The scientifically based recommendations for the water quality classification in agricultural areas, i.e. outlets of subsurface drainage systems and open ditches, have been proposed by Lagzdiņš et al. (Citation2012).
The Berze monitoring site is located within the nitrate-vulnerable zones (NVZ), delineated under the ND. The NVZ were based on surface water and groundwater monitoring results in Latvia. Areas were identified as NVZ in case the nitrate concentration in surface or groundwater exceeded or could exceed 50 mg l–1 or when inland and coastal waters have become eutrophic. In this case, the member states of the EU are required to take action, minimizing the risk of exceeding the nitrate (NO3–) concentration limit of 50 mg l–1 in surface water or groundwater. The location of monitoring sites, river basin districts and NVZ are shown in .
Source: Geospatial information of Latvia University of Agriculture and State Limited Liability Company ‘Ministry of Agriculture Real Estate’.
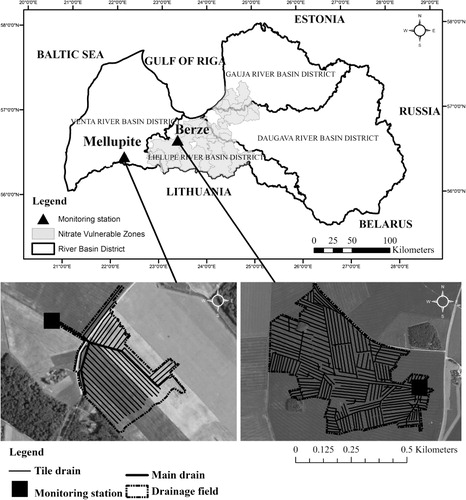
According to FAO (Citation2006) description of the soil textural classes, the dominant soil texture at the Berze and Mellupite drainage fields is silty clay loam and loam, respectively. The water infiltration rate in moderately fine-textured soils of Berze is slower than in the coarse-textured soils of Mellupite. The size of the Berze and Mellupite drainage fields is 77 and 12 ha, respectively. One inlet for surface run-off was established in the Mellupite drainage field to facilitate surface water entry into the drainage system. Surface water inlets are recommended to drain low-lying areas and depressions, thereby avoiding surface water accumulation.
Information on farming practices in the experimental fields was obtained through annual interviews with farmers, providing information on the type of crop, time of planting/harvesting and yield level, time, method and rate of fertilizer application, in addition to type and date of tillage (). These surveys indicate that the Berze monitoring site can be characterized as a relatively intensive agricultural production system within the present farming conditions in Latvia, whereas Mellupite represents a moderately intensive agriculture.
Table 1. Cropping systems and annual N and P application rates in the Berze and Mellupite subsurface drainage fields.
In general, autumn ploughing in October or November is practiced when spring crops, e.g. spring wheat, spring rape seed, spring barley and sugar beets, are planned for the following year. Soil ploughing, immediately after harvesting is performed before winter crops are sown (winter wheat and winter rape seed), while ploughing of fallow is done at the end of June in case winter crops are sown.
The timing of mineral fertilizer application depends on cropping practices. Farmers tend to apply fertilizers as closely as possible to the period of maximum crop uptake. Mineral fertilizers for winter crops are applied at sowing (August or September) with supplementary applications in April and/or May, while summer crops are fertilized at sowing (April), with supplementary applications in May and/or June.
Measurements and sampling
Weather data were recorded automatically at the sites. During periods when the on-site measurements failed, weather data collected by the ‘Latvian Environment, Geology and Meteorology Centre’ (LEGMC) were used. The nearest LEGMC stations are in Dobele and Saldus, located 13 km south-west of the Berze site and 24 km south-west of the Mellupite site, respectively. Precipitation and air temperature data measured during the research period (1995–2013) at the study sites were compared to long-term values (1950–1994) observed at the meteorological stations of Dobele and Saldus. The comparison of weather data during the research period with long-term weather data can provide relevant insight into the potential scenarios of climate change at both research sites. The time period from 1950 to 1994 was selected based on the longest available air temperature and precipitation data-sets providing long-term average weather patterns for the monitoring sites before the start of the research period in 1995.
Water quality and quantity monitoring have been carried out at the main drain of each drainage system. Drainage water discharge is measured using a V-notch weir at both sites. Water levels were recorded using a pressure transducer in combination with a data logger (Campbell Scientific). Hourly discharge (l s–1) measurements were used to calculate daily, monthly and annual run-off (mm) from the specific area. Flow-proportional composite water samples were taken automatically. Samples were collected in a bucket and removed from the study sites once per month, and stored in a cooler at 4°C until they could be analysed in laboratory. Samples were analysed for TN, NO3–N and TP according to the Latvian Standards at the Hydrochemistry Laboratory of Latvian Institute of Aquatic Ecology and the Laboratory of LEGMC. The NO3–N concentration was determined using flow analysis (CFA and FIA) and spectrometric detection method. TN concentrations were detected by the method of oxidative digestion with peroxodisulfate, while the TP concentrations were analysed using the ammonium molybdate spectrometric method.
Daily nutrient losses (kg ha–1) were calculated based on the measured run-off (mm) and concentrations (mg l–1) of nutrients in the composite samples. A linear interpolation was carried out between the monthly nutrient concentrations to estimate daily concentration values. The resulting daily concentrations were multiplied by the representative daily drain discharge, and while dividing by the total area, resulting in the nutrient loss per unit area (kg ha–1). Cumulative monthly and annual losses were obtained through summation of the daily values across the particular time period.
Statistical analysis
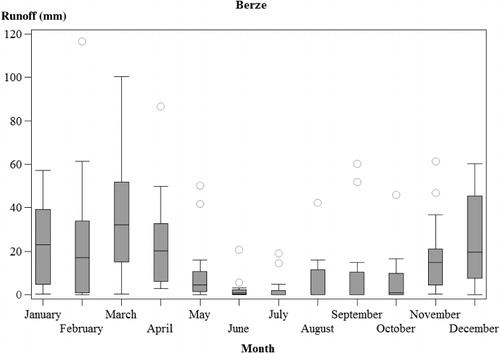
Statistical analyses of the monitoring data were conducted using the Statistical Analysis System software (SAS Institute Inc. Citation2011). The PROC SGPLOT procedure in SAS version 9.3 for Windows was used to determine the seasonal distribution of drain flow at experimental fields. Side-by-side box plots represent the most extreme minimum and maximum values within 1.5 interquartile ranges, the 25th, 50th (median) and 75th percentiles, and outliers of the data-set. Helsel and Hirsch (Citation2002) describe that outliers are considerably different values from the rest of the data-set and can be explained as a rare event from the single population, which is greatly skewed. The CORR procedure of SAS software was used to identify the intensity of associations among variables. More specific, the Spearman's rank correlation coefficient (R) at significance level p = .05 was computed to test the correlations between the meteorological, hydrologic, agricultural management and water quality variables. The Spearman's rank correlation is suggested in water resources investigations to analyse correlation between the parameters of two data-sets that do not correspond to the normal distribution (Duchemin & Hogue Citation2009; Delpla et al. Citation2011).
Meteorological conditions
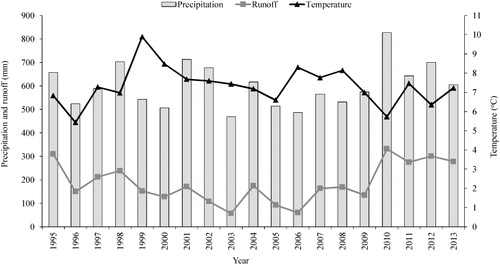
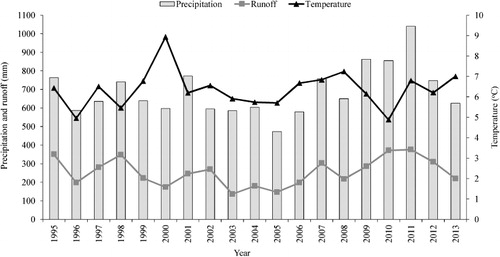
During the research period (1995–2013), large variations in the annual total precipitation and mean annual air temperature were observed at both the Berze and Mellupite study sites ( and ). Annual precipitation varied from 469.4 to 827.1 mm and from 472.8 to 1039.2 mm in Berze and Mellupite, respectively. Monthly distribution of precipitation for 1995–2013 is presented in . At both study sites, pronounced seasonal precipitation patterns were found. At the Berze monitoring location, the largest mean monthly precipitation occurs during the months of June, July, August and October (48% of the yearly 602.5 mm). Meanwhile, at Mellupite the largest amount occurs from July to October (46% of the yearly 689.9 mm). However, high precipitation during the summer season does not have an effect on the subsurface drainage run-off, mainly due to the high evapotranspiration demand. During the winter season (December to February), precipitation occurs mainly as snow, resulting in snow cover accumulation with an average duration of 80–90 days (Jansons et al. Citation2003).
Table 2. Comparison of mean monthly and annual precipitation and temperature for long-term (1950–1994) and research period (1995–2013). Relative changes in mean precipitation (%) and temperature (ΔT, °C).
The mean annual temperature indicates slightly warmer conditions at Berze compared to Mellupite (). The mean annual temperature during the study period, with the exception of 2000, was higher in Berze. The mean annual temperature during the research period was 7.3°C and 6.4°C for Berze and Mellupite, respectively (), being 1.4°C and 0.6°C warmer than long-term mean. Three months (December to February) have a mean temperature below 0°C in Berze, whereas at Mellupite four months (December to March) have below-zero temperatures.
Overall, the meteorological data during the observation period indicate that the Berze monitoring site is both warmer and has drier conditions compared to the Mellupite site.
Results
Hydrology
Water flow from subsurface drainage systems, also referred as ‘run-off’ or ‘drain flow’, is the main pathway of nutrient leaching from the agricultural fields to surface waterbodies. Therefore, it is important to investigate water flow patterns in subsurface drainage studies.
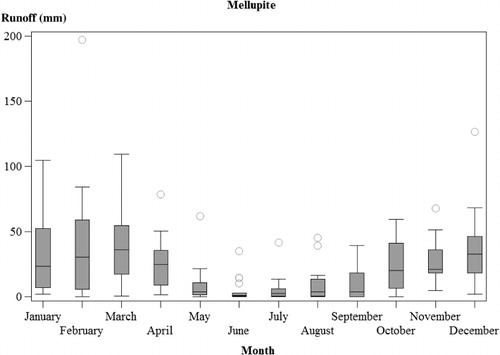
The highest mean annual run-off was measured at the Mellupite drainage field (375.9 mm) while the lowest run-off occurred at the Berze field (56.6 mm). In general, the annual run-off from the experimental fields corresponds to the total amount of precipitation within specific years ( and ). Spearman's test results show a statistically significant positive correlation between annual precipitation and annual run-off at both Berze (R = 0.76, p < .05) and Mellupite (R = 0.84, p < .05). Most likely, the higher correlation in Mellupite can be explained by the presence of a coarser soil texture and hence faster downward movement of water through the soil profile compared to Berze. Air temperature and run-off correlation analysis indicate statistically insignificant negative correlation of R = –0.42, p > .05, and R = –0.05, p > .05, in Berze and Mellupite. Large variations in precipitation and air temperature cause variations in annual run-off throughout the research period ( and ). An analysis of monthly run-off data was carried out to determine the seasonal distribution of drain flow ( and ).
The time series of monthly run-off indicated a pronounced seasonality for both study sites, with the lowest run-off during the summer period and the highest during spring ( and ). Similar findings have been reported by Klavins et al. (Citation2002) and Stålnacke et al. (Citation2003), when analysing river discharge regimens in major rivers in Latvia. The majority of run-off at the research sites occurred during the non-vegetation period from December through April ( and ). During this period, a greater variance in monthly run-off also occurs.
Nutrient concentrations in subsurface drainage
The agricultural run-off data show large inter-annual and seasonal variations in TN, TP and NO3–N concentrations in subsurface drainage water at both the Berze and Mellupite research sites (). In general, the highest mean annual TN concentrations in the drain flow were found at Berze, while mean annual TP concentrations were slightly higher in drainage run-off at Mellupite. During the period of research, the concentrations ranged from 1.8 to 102.7 mg TN l–1 and from 0.01 to 0.47 mg TP l–1 in Berze and from 1.6 to 16.8 mg TN l–1 and from 0.003 to 1.11 mg TP l–1 in Mellupite.
Table 3. Measured mean monthly concentrations of NO3−N, total nitrogen (TN) and total phosphorus (TP) in run-off from subsurface drainage fields in the Berze and Mellupite research sites (1995–2013).
Monthly mean nutrient concentrations for the research period are summarized in . The monthly concentrations of TN in Berze reveal a strong seasonal pattern with the highest concentrations occurring during the winter months when N uptake by plants is limited. In contrast, mean concentrations of TN in Mellupite are relatively stable throughout the year, while considerably lower concentrations were observed in June and July. However, mean monthly concentrations of TN measured at the study sites exceeded the threshold values for good water quality, based on the requirements of WFD during all months of the sampling period. In this context it has to be noted that retention processes at this scale of measurements are rather low. In-stream retention processes within the hydrological network may significantly reduce TN concentrations in receiving surface waterbodies. TP concentrations are generally low and only occasionally exceed the threshold level of 0.09 mg l–1 (). Therefore, the P-leaching loss from subsurface drainage systems is not a concern in Latvia. The mean annual NO3–N concentration was slightly below the threshold level of 11.3 mg l–1 defined by ND. The most vulnerable months in exceeding the threshold level of NO3–N concentrations in the Berze research site are January, November and December (). Therefore, implementation of appropriate mitigation measures, e.g. annual winter crops, winter cover crops if spring crops are planted as main crops, no tillage in autumn, will be needed to reduce nitrate-N losses to drainage water. The scientifically based standards for water quality classification in agricultural areas would help to define relevant nutrient criteria for agricultural run-off separately from the rivers.
Nutrient losses in subsurface drainage
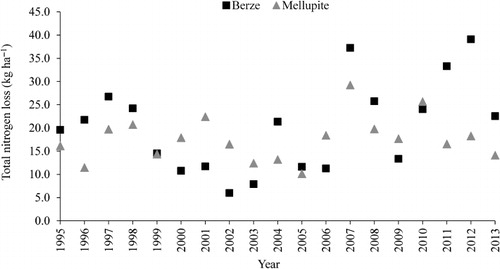
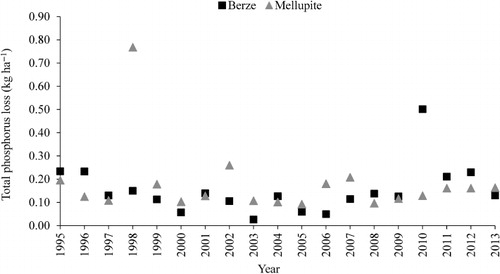
Similar to run-off, the TN losses showed high temporal and spatial variability. Annual losses of TN in subsurface drainage over the research period (1995–2013) ranged from 6.0 to 39.1 kg ha–1 in Berze and from 10.2 to 29.3 kg ha–1 in Mellupite (). The loss of TP varied from 0.03 to 0.50 kg ha–1 and 0.09 to 0.77 kg ha–1 at drainage effluents at Berze and Mellupite sites, respectively ().
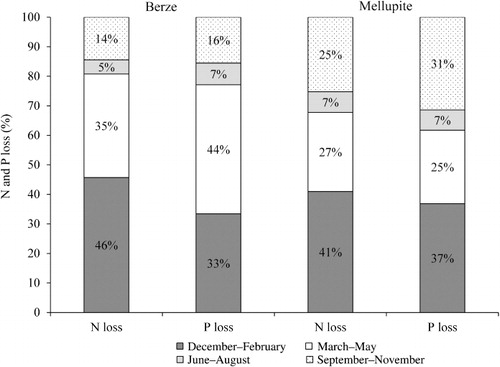
Seasonal patterns of TN and TP losses are presented in . The major share of the annual run-off () and TN and TP losses at the Berze study site occur during the winter and spring seasons (). The results show that 81% of TN and 77% of TP is lost from the agricultural land from December through May. The losses of TN and TP at Mellupite are more equally distributed among spring, fall and winter seasons. The seasonal distribution of drainage run-off and nutrient losses in different hydrological regions of Latvia must be considered when planning mitigation measures for reducing nutrient losses from agriculture to drainage water.
Discussion
Effect of hydrology and mineral fertilizer application rate on nutrient concentration and loss
As TN and TP losses from drainage fields are a function of concentration and drain flow, the lowest values are observed during the years with low run-off and vice versa. The Spearman's rank correlation analysis showed statistically significant and strong positive correlation between annual run-off and annual TN (R = 0.72) and TP (R = 0.85) loss for the Berze site, while in the Mellupite a substantially weaker relation was found (). A positive relation between run-off and nitrogen loss for the Norwegian and Swedish agricultural catchments was reported by Deelstra et al. (Citation2014), and similar findings for Danish and Estonian catchments were made by Stålnacke et al. (Citation2014). A study by Deelstra et al. (Citation2011) indicated that variation in TP loss corresponded to the variation in run-off.
Table 4. Test of associations between selected variables using Spearman's rank correlation coefficients (R) for the Berze and Mellupite research sites (1995–2013).
The run-off from subsurface drainage may also effect concentrations of TN and TP. The correlation between TN concentration and run-off was negative at both research sites (R = –0.30 for Berze, R = –0.34 for Mellupite), while a similar pattern also was observed at the Mellupite site regarding TP concentration (R = –0.38). At the Berze site, however, the relationship between the TP concentration and run-off was positive (R = 0.34). A decrease in NO3–N concentration with an increase in run-off was also observed by Kladivko et al. (Citation2004). However, Tiemeyer et al. (Citation2006) reported an increasing NO3–N concentration at increasing flow rates over the entire discharge season. Stålnacke et al. (Citation2003) have observed positive relationship between discharge and NO3–N concentrations in Latvian rivers. These results highlight the need for additional research concerning the interaction between drain flow and variation in TN and NO3–N concentrations.
Fertilizer application rates may also have a direct impact on nutrient loss and concentrations (Randall & Mulla Citation2001). Correlation analysis using annual N and P fertilizer application and annual TN and TP loss showed statistically insignificant and weak negative correlation at both monitoring sites (). The same pattern was observed when TN and TP concentrations and fertilizer application rates were compared, with the exception of TP concentrations at the Berze site, where a positive correlation between the concentration and fertilizer application was observed. These results highlight the need for a more detailed analysis on the interaction between the timing and application rate of mineral fertilizers and concentrations of TN and TP at the drainage outlet. However, this will be a challenging task as different crop covers were also used at the experimental fields.
Overall, mean annual N loss was higher at Berze (20.2 kg ha–1) than Mellupite (17.6 kg ha–1), mainly due to the strong positive correlation between annual run-off and N loss, higher fertilizer application rates and more intensive use of agricultural land. Mean annual mineral fertilizer application rates of N during the period of study were considerably higher in the Berze (123 kg ha–1) when compared with the Mellupite experimental field (87 kg ha–1).
Averaged over the 19-year period, mean annual TP losses were higher at Mellupite (0.18 kg ha–1) when compared with Berze (0.15 kg ha–1) due to occasional surface water and suspended sediment inflow into the drain system via the open inlets. At both research sites, TP losses generally occur during extreme discharge events, caused either by snow melt or intensive precipitation. The importance of individual storm events in losses of suspended sediment and particulate P in subsurface and stream waters has been reported by Kronvang et al. (Citation1997). Application rates of P were quite similar at both sites (~40 kg ha–1). In Mellupite, part of the agricultural land in the drainage field has been used extensively as fallow for 7 out of the 19-year sampling period.
However, the TN and TP loss in Latvia can be consider being low when compared with the results of similar studies in the Nordic countries. Deelstra et al. (Citation2011) showed that in Norway the mean annual nitrogen losses in two agricultural catchments varied from 31 to 48 kg ha–1, while TP losses of 1.6–2.4 kg ha–1 were mentioned in earlier studies by Deelstra and Iital (Citation2008). Studies in small agricultural catchments in Sweden indicated large variations of annual TN and TP loss, ranging from 2 to 41 N kg ha–1 and from 0.1 to 0.9 N kg ha–1 (Kyllmar et al. Citation2006). In contrast, Deelstra and Iital (Citation2008) have found lower annual TN losses (6.7–7.9 kg ha–1) in Estonian agricultural catchments when compared with the mean annual N loss presented in this study. Sileika et al. (Citation2005) also reported lower annual TN losses in Lithuanian agricultural catchment (12 kg N ha–1 year–1), meanwhile annual TP loss of 0.318 kg ha–1 year–1 were higher than in selected research sites in Latvia.
This study showed that nitrogen and phosphorus losses through drainage run-off depend on both hydrology and intensity of agricultural practices used at the study sites. A reduction in nitrogen losses could be achieved using controlled drainage (Helmers et al. Citation2012), no-tillage before planting (Bakhsh et al. Citation2006), cover crops (Strock et al. Citation2004) and by precise timing and rate of applied fertilizers (Randall & Mulla Citation2001).
Climate change
The meteorological data during the research period (1995–2013) along with the long-term data (1950–1994) were used to highlight the precipitation and air temperature variability over the time at the study sites (). The comparison of precipitation during the research period with the long-term mean shows that the mean annual precipitation amount has increased at both Berze and Mellupite monitoring stations by 36 mm and 42 mm, respectively. Moreover, in Mellupite an extremely high amount of annual precipitation (1039.2 mm) occurred in 2011: the yearly precipitation exceeded 1000 mm for the first time. The analysis of changes in monthly precipitation distribution indicated that lower precipitation can be expected in April, September and November for both research sites, the decrease varying from 2% to 31%. For both sites, the most pronounced increase in monthly precipitation occurred during January, February, May, July and October with an increase varying from 12% to 33%. In addition, several site-specific differences have been observed.
The comparison of mean annual air temperature data indicates warmer conditions during the study period for both monitoring sites when compared with the long-term mean. A considerable warming was detected for the Berze site, with an increase of 1.4°C in the mean annual temperature (). The analysis also showed that July and August have the highest increase in monthly temperature for both study sites, with a 2.2°C and 2.0°C increase at Berze and 1.5°C and 1.3°C increase in Mellupite, respectively. Air temperature during the winter months has increased considerably in Berze. The analysis of meteorological data measured at the research sites give an indication of climate change with an increase in annual air temperature and precipitation.
Apsīte et al. (Citation2011) conducted a study to assess climate change impacts on river run-off in Latvia. Their study used the data series of future climate scenarios A2 and B2 prepared by Seņņikovs and Bethers (Citation2009). In general, the results of climate change presented in this study are similar to those reported by Apsīte et al. (Citation2011). In the central part of Latvia, where the Berze monitoring station is located, the climate change scenarios forecast increase in mean annual air temperature ranging from 2.6°C to 3.9°C according to B2 and A2 scenarios. The most significant increase is projected for winter and autumn, which results in a longer growing season and higher evapotranspiration rates. Projected precipitation data show a significant increase during the winter season and a decrease during the summer and autumn seasons. It is also forecasted that intensive precipitation events will occur more frequently. Apsīte et al. (Citation2011) calculated that in the central part of Latvia, the mean annual run-off either will increase or will not change according to B2 and A2 scenarios, respectively. Pronounced increase in run-off is predicted for the winter season due to milder conditions and an increase in liquid precipitation. The magnitude of spring floods in rivers will be reduced as the duration and thickness of snow cover will also be reduced. There is no doubt that potential changes in climate will also affect all components of hydrological cycle, including water outflow from subsurface drainage systems. This study showed pronounced relationship between meteorological conditions, hydrological regimens and nutrient losses in subsurface drainage systems. Appropriate adaption measures will be needed to reduce possible negative effects. The results of this study have improved our understanding about possible effects of climate change on run-off and nutrient losses through agricultural subsurface drainage systems in Latvia.
References
- Apsīte E, Bakute A, Elferts D, Kurpniece L, Pallo I. 2011. Climate change impacts on river runoff in Latvia. Clim Res. 48:57–71.
- Bakhsh A, Kanwar RS, Pederson C, Bailey TB. 2006. N-source effects on temporal distribution of NO3-N leaching losses to subsurface drainage water. Water Air Soil Pollut. 181:35–50.
- [HELCOM] Baltic Marine Environment Protection Commission. 2007. HELCOM Baltic Sea action plan [Internet]. Krakow: Helsinki Commission [cited 2014 May 15]. Available from: http://helcom.fi/Documents/Baltic%20sea%20action%20plan/BSAP_Final.pdf
- [HELCOM] Baltic Marine Environment Protection Commission. 2009. Eutrophication in the Baltic Sea – An integrated thematic assessment of the effects of nutrient enrichment in the Baltic Sea region. Balt Sea Environ Proc. No. 115B.
- [HELCOM] Baltic Marine Environment Protection Commission. 2011. The Fifth Baltic Sea Pollution Load Compilation (PLC-5). Balt Sea Environ Proc. No. 128.
- Bechmann M, Eggestad HO, Vagstad N. 1998. Nitrogen balances and leaching in four agricultural catchments in southeastern Norway. Environ Pollut. 102:493–499.
- Central Statistical Bureau of Latvia. 2010. On final results of Agricultural Census 2010 [Internet]. Riga: Central Statistical Bureau of Latvia [cited 2014 May 15]. Available from: http://www.csb.gov.lv/en/notikumi/final-results-agricultural-census-2010-32185.html
- Deelstra J, Abramenko K, Vagstad N, Jansons V. 2005. Scale issues, hydrological pathways, and nitrogen runoff from agriculture -results from the Mellupite catchment, Latvia. In: Srinivasan R, Jacobs J, Day D, Abbaspour K, editors. Proceedings of the 3rd International SWAT Conference; 2005 Jul 11–15; Zürich. Zürich (SUI): Swiss Federal Institute of Aquatic Science and Technology.
- Deelstra J, Iital A. 2008. The use of the flashiness index as a possible indicator for nutrient loss prediction in agricultural catchments. Boreal Environ Res. 13:209–221.
- Deelstra J, Iital A, Povilaitis A, Kyllmar K, Greipsland I, Blicher-Mathiesen G, Jansons V, Koskiaho J, Lagzdiņš A. 2014. Hydrological pathways and nitrogen runoff in agricultural dominated catchments in Nordic and Baltic countries. Agric Ecosyst Environ. 195:211–219.
- Deelstra J, Oygarden L, Blankenberg AGB, Eggestad HO. 2011. Climate change and runoff from agricultural catchments in Norway. Int J Clim Change Strategies Manage. 3:345–360.
- Delpla I, Baurès E, Jung AV, Thomas O. 2011. Impacts of rainfall events on runoff water quality in an agricultural environment in temperate areas. Sci Total Environ. 409:1683–1688.
- Duchemin M, Hogue R. 2009. Reduction in agricultural non-point source pollution in the first year following establishment of an integrated grass/tree filter strip system in southern Quebec (Canada). Agric Ecosyst Environ. 131:85–97.
- EC (1991) Council Directive 91/676/EEC of 12 December 1991 concerning the protection of water against pollution caused by nitrates from agricultural sources. Off J Eur Commun. L 375:1–8.
- EC (2000) Directive 2000/60/EC of the European parliament and of the council of 23 October 2000 establishing a framework for the community action in the field of water policy. Off J Eur Commun. L 327:1–72.
- [FAO] Food and Agriculture Organization of the United Nations. 2006. Guidelines for soil description [Internet]. Rome: Food and Agriculture Organization of the United Nations [cited 2014 May 15]. Available from: ftp://ftp.fao.org/agl/agll/docs/guidel_soil_descr.pdf
- Gentry LE, David MB, Royer TV, Mitchell CA, Starks KM. 2007. Phosphorus transport pathways to streams in tile-drained agricultural watersheds. J Environ Qual. 36:408–441.
- Gilliam JW, Baker JL, Reddy KR. 1999. Water quality effects of drainage in humid regions. In: Skaggs RW, Van Schilfgaarde J, editors. Agricultural drainage. Madison (WI): American Society of Agronomy; p. 801–830.
- Heathwaite AL, Johnes PJ, Peters NE. 1996. Trends in nutrients. Hydrol Processes. 10:263–293.
- Helmers M, Christianson R, Brenneman G, Lockett D, Pederson C. 2012. Water table, drainage, and yield response to drainage water management in southeast Iowa. J Soil Water Conserv. 67:495–501.
- Helsel DR, Hirsch RM. 2002. Statistical methods in water resources [Internet]. Techniques of water-resources investigations, Book 4, Chapter A3. Reston (VA): U.S. Geological Survey; [cited 2014 May 17]. Available from: http://pubs.usgs.gov/twri/twri4a3/#pdf
- Iital A, Stålnacke P, Deelstra J, Loigu E, Pihlak M. 2005. Effects of large-scale changes in emissions on nutrient concentrations in Estonian rivers in the Lake Peipsi drainage basin. J Hydrol. 304:261–273.
- Jansons V, Busmanis P, Dzalbe I, Kirsteina D. 2003. Catchment and drainage field nitrogen balances and nitrogen loss in three agriculturally influenced Latvian watersheds. Eur J Agron. 20:173–179.
- Kladivko EJ, Frankenberger JR, Jaynes DB, Meek DW, Jenkinson BJ, Faussey NR. 2004. Nitrate leaching to subsurface drains as affected by drain spacing and changes in crop production system. J Environ Qual. 33:1803–1813.
- Klavins M, Briede A, Radionon V, Kokorite I, Frisk T. 2002. Long-term changes of the river runoff in Latvia. Boreal Environ Res. 7:447–456.
- Kronvang B, Laubel A, Grant R. 1997. Suspended sediment and particulate phosphorus transport and delivery pathways in an arable catchment, Gelbaek Stream, Denmark. Hydrol Process. 11:627–642.
- Kyllmar K, Carlsson C, Gustafson A, Ulen B, Johnsson H. 2006. Nutrient discharge from small agricultural catchments in Sweden: Characterisation and trends. Agric Ecosyst Environ. 115:15–26.
- Lagzdiņš A, Jansons V, Sudars R, Abramenko K. 2012. Scale issues for assessment of nutrient loss from agricultural land in Latvia. Hydrol Res. 43:383–399.
- Randall GW, Mulla DJ. 2001. Nitrate nitrogen in surface waters as influenced by climatic conditions and agricultural practices. J Environ Qual. 30:337–344.
- [RBMP] River Basin Management Plans. 2009. River basin management plans [Internet]. Riga: Ministry of Environmental Protection and Regional Development of the Republic of Latvia [cited 2014 Sep 2]. Available from: http://www.varam.gov.lv/lat/darbibas_veidi/udens_aizsardziba_/upju_baseini/
- SAS Institute Inc. 2011. SAS/STAT® 9.3 user's guide. Cary (NC): SAS Institute Inc.
- Seņņikovs J, Bethers U. 2009. Statistical downscaling method of regional climate model results for hydrological modelling. In: Anderssen RS, Braddock RD, Newham LTH, editors. The 18th World IMACS Congress and MODSIM09 International Congress on Modelling and Simulation; 2009 Jul 13–17; Cairns. Modelling and Simulation Society of Australia and New Zealand and International Association for Mathematics and Computers in Simulation.
- Sileika AS, Gaigalis K, Kutra G, Smitiene A. 2005. Factors affecting N and P losses from small catchments (Lithuania). Environ Monit Assess. 102:359–374.
- Šķiņķis C. 1986. Augšņu drenēš ana [Soil drainage]. Riga: Avots.
- Stålnacke P, Aakerøy PA, Blicher-Mathiesen G, Iital A, Jansons V, Koskiaho J, Kyllmar K, Lagzdiņš A, Pengerud A, Povilaitis A. 2014. Temporal trends in nitrogen concentrations and losses from agricultural catchments in the Nordic and Baltic countries. Agric Ecosyst Environ. doi:10.1016/j.agee.2014.03.028
- Stålnacke P, Grimvall A, Libiseller C, Laznik M, Kokorite I. 2003. Trends in nutrient concentrations in Latvian rivers and the response to the dramatic change in agriculture. J Hydrol. 283:184–205.
- State Land Service of Latvia. 2014. Land report of the Republic of Latvia on 01.01.2014. Riga: State Land Service of Latvia.
- Strock JS, Porter PM, Russelle MP. 2004. Cover cropping to reduce nitrate loss through subsurface drainage in the northern US Corn Belt. J Environ Qual. 33:1010–1016.
- Tiemeyer B, Kahle P, Lennartz B. 2006. Nutrient losses from artificially drained catchments in north-eastern Germany at different scales. Agric Water Manag. 85:47–57.
- Ulén B. 2006. A simplified risk assessment for losses of dissolved reactive phosphorus through drainage pipes from agricultural soils. Acta Agric Scand, Section B Soil and Plant Sci. 56:307–314.