
Abstract
Since the Middle Ages the Dutch have reclaimed many lakes and parts of the sea, creating polders. Drainage is required to use the land: for the inhabitants, for agriculture and for nature. Traditionally drainage was by gravity: through open (and later pipe) drains excess rainfall was transferred into open collector drains, from where the water was pumped out to a river, lake or the sea. Since the 1950s, land use has been changing towards a more diverse and intensive agriculture, more attention for nature, recreation and continuing urbanization. On top of this, the climate is changing: significant increases in precipitation, both average and extreme. Until recently, the solution to more excess water was to increase pump capacity. Yet the combined problems of climate change, sea level rise, subsidence and urbanization require more structural changes in water management. Drainage systems have to be modified to enable the shift from a strategy of rapid removal of all excess water to one that continuously controls water levels individually in each agricultural plot. A new approach of ‘retention, storage and controlled removal’ is being used to develop climate adaptation scenarios for the three hydro-ecological zones in the Netherlands, i.e.: (1) the man-made polder areas with marine clay soils along the North Sea coast and the former Zuider Sea; (2) the low-lying peat lands in the west and north; and (3) the sandy and loamy soils areas in the centre, south and east. New approaches for tailor-made drainage solutions following this strategy are being tested in various pilot areas in the three zones. Although the research is still ongoing, this paper presents the lessons learned to date related to the challenges, risks and limitations associated with the introduction of these new drainage strategies for coping with climate change in the Netherlands.
Introduction
In the Netherlands, drainage is a fact of life as it is required to use the land: for the inhabitants, for agriculture and for nature. Changes in land use, land management objectives and climate predictions require different approaches to drainage than those practised in the past. The different hydro-ecological conditions (zones) of the Netherlands require a drainage approach that can be adapted to local needs. A new paradigm and approach has been developed and is in testing in the different hydro-ecological zones (HEZs). This paper provides background information on drainage strategies in the Netherlands, explains the new approach to drainage and presents initial results from its application in the country's three different HEZs.
Evolution of drainage in the Netherlands
The Netherlands, a low-lying country in Western Europe (50°–54° N, 3°–8° E), consists of deltas and former flood plains of the rivers Rhine, Meuse and Scheldt (Colenbrander Citation1989). The total territory, including inland lakes, estuaries and territorial waters, is 41,543 km2, of which 55% is agricultural, 12% is nature, 19% is open water and the remaining 14% is built-up area (CBS Citation2014). The land consists mainly of alluvial deposits and about 25% of the country lies below mean sea level (MSL). The western part of the Netherlands has an elevation varying between 0 and 5 m below MSL and has little relief except for the coastal dunes. The lowest point is some 7 m below MSL. In the absence of dunes and dikes, more than 65% of the country would be flooded at high sea and high river levels (Van de Ven Citation1996).
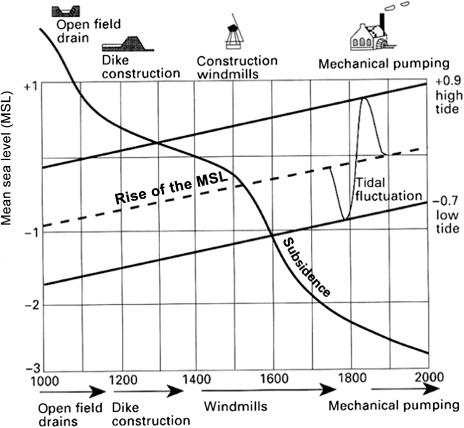
In the western parts of the Netherlands, reclamation started around 1000 AD (Van der Molen Citation1982). At that time, the land was elevated several metres above the river levels and drainage by gravity was possible. Groundwater levels that were controlled by sluices could be maintained at a depth that allowed arable crops to be cultivated. Because of the subsidence of the peat layers, however, the drainage system deteriorated and, in the fifteenth century, arable cultivation was gradually replaced by grassland (De Bakker Citation1982). Nevertheless, the land continued to subside, and new techniques were needed to drain the areas. From the sixteenth century onwards, windmills were widely used to pump out the drainage water, thereby maintaining a good drainage base, but consequently sustaining subsidence. In the eighteenth and nineteenth centuries, windmills were gradually replaced by mechanical pumping. Subsequently, the drainage base has been lowered from time to time, and nowadays, instead of being a few metres above MSL, these areas are now several metres below it ().
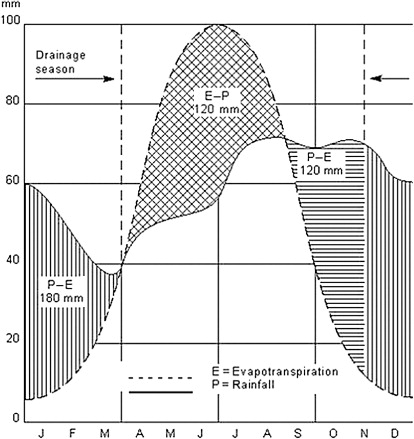
For centuries, the focus of drainage practices has been on the removal of excess rainfall to enable agriculture. The critical period for drainage is early spring when rapid removal of excess water enables mechanical land preparation in order to bring forward and lengthen the growing season (). Mechanical pumping added a rudimentary type of drainage control: in winter, when excess rainfall averages 300 mm and drainage is needed, the water levels are kept 30 cm lower than in summer, when there is a water deficit of about 120 mm and water conservation is required. The higher water levels kept in summer are used to replenish the groundwater by sub-irrigation and reduce the water deficit in the root zone by capillary rise.
A paradigm shift in the approach to drainage
After the Second World War, agriculture intensified and more intensive drainage was required, resulting in lower groundwater levels, increased drainage rates and more drought stress in dry periods. This process was further intensified by the land consolidation practices employed to reduce the problems of fragmentation of land holdings (Van den Noort Citation1987). These land consolidation activities were often combined with the improvement of the water management and road infrastructure (Prak Citation2002). The land consolidation projects resulted in significant lowering of the groundwater levels, not only in the man-made polders but also in the higher sandy areas in the east and south of the Netherlands. During the last 50 years, land use has also been changing: next to more diverse and intensive agriculture, more attention is paid to space for nature and recreation while urbanization is continuing. With the Netherlands being the most densely populated country in Europe, 409 inhabitants per square kilometre (Statistics Netherlands at www.cbs.nl), the water management requirements for these land use activities are closely interlinked.
On top of this, the climate is changing; it is predicted that rainfall will increase in spring, autumn and winter, but not in summer (the main growing season; ). In the summer, while extreme rainfall events are predicted to increase, higher temperatures will result in increased (crop)evapotranspiration and higher rainfall deficits during the growing season. A recent study over the period 1951–2009 indicates an upward trend in daily precipitation from February to April and a decreasing trend from July to September (Daniels et al. Citation2013). This change in precipitation patterns is most pronounced along the coast (changes of 15–30%) decreasing to less than 5%, i.e. 150 km further inland near the German border.
Table 1. Projected climate changes for the Netherlands in 2030 (KNMI Citation2014).
To cope with these changes, water management in the Netherlands has been since the 1970s in a fundamental process of change towards a more adaptive and participatory form of water management (Van der Brugge et al. Citation2005). Until recently, the solution to cope with the increase in rainfall intensities was to increase pump capacity. This was relatively easy to achieve as most of the older polders have a high percentage of open water (up to 25–30%): in the past, they had to store relatively large quantities of water since they were initially designed for windmill pumping. However, the combined problems of climate change, sea level rise, subsidence and urbanization require more fundamental structural changes. The goal has been to find a way to control drainage and water levels throughout the year rather than simply being able to pump more away.
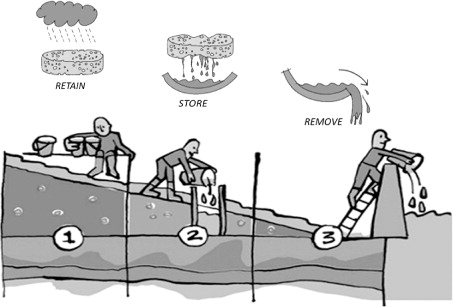
In February 2001, the National Government, the Association of Provincial Authorities, the Association of Water Boards and the Association of Dutch Municipalities agreed on a paradigm shift in the water management approach (Delta Committee Citation2008). Instead of increasing pumping and drainage capacities further and further, the focus has been shifted to control drainage in a three-step approach of decreasing priority: (1) retention of excess rainfall in the soil, (2) storage of remaining excess water in the field or the (field) drainage system and (3) controlled removal (). The overall aims are to reduce peak discharges in periods of rainfall excess (a benefit for the water managers) and to store extra water for periods of water stress (a benefit to the farmer). Furthermore, this approach reduces the leaching of soil nutrients after heavy rainfall, an important factor for management of the water quality.
Principles of controlled drainage
Drainage systems have to be modified to enable the above-mentioned shift: from systems that were built for rapid removal of all excess water to systems that can better control water levels in both the open drainage system and individual farm plots. The first step, controlling water levels in the open drainage canals, is a refinement of the traditional ‘winter/summer level’ system. The second and third steps, storage of excess water in the field and controlled removal/outflow, build on experiences with controlled drainage from, among other places, the USA, Egypt and India (Vlotman & Jansen Citation2003). Experiences from these other countries provide insight into the needed changes and expected benefits from controlled drainage.
In the USA, controlled drainage (also called Drainage Water Management/DWM) is mainly used to reduce nitrogen (N) losses (primarily in the nitrate nitrogen [NO3-N] form) from subsurface drained fields (Skaggs et al. Citation2012). The reduction in N loss to surface waters varied over a wide range (18–75%), depending on drainage system design, location, soil and site conditions. DWM also resulted in crop yield increases on some sites and not on others, with the year-to-year impacts of DWM on yields dependent on weather conditions, as well as the above factors. Experiences with controlled drainage in Egypt in the 1980s indicate savings in irrigation water between 22% and 35%, resulting in a reduction in drain discharges of on average 46% (El-Atfy et al. Citation1991). Although the total mass loss for N and P (orthophosphate–phosphorus) were already low, follow-up studies revealed that controlled drainage also reduced the total N losses through the drain system by 73% in summer and 32% in winter, and the total P losses by 77% in summer and 30% in winter (Wahba1 et al. Citation2001). Experiences in India and Pakistan in the 1990s show that (1) maintenance of the salt balance in irrigated agricultural drainage is only needed 10–15% of the year; (2) a shallow groundwater level enhances the use of the shallow groundwater for crop production through capillary rise; and (3) uncontrolled drainage accounts for 3–20% loss of total applied nitrogen (Ritzema Citation2009). These experiences show that the key elements of the new approach are: (1) in-field storage, (2) better control of the groundwater level, (3) controlled outflow, (4) better use of water and nutrients, (5) lower peak discharges and (6) reduced loss of nutrients.
Testing controlled drainage in the different hydro-ecological/land use zones of the Netherlands
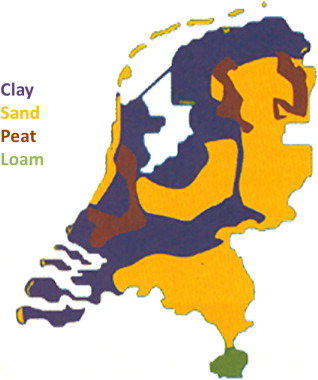
Based on the new ‘retention, storage and controlled removal’ strategy, Van de Sandt and Goosen (Citation2010) assessed the required changes in water management approaches in light of the assumed changes in land use and the possibilities for adaptation and/or resilience (). To develop scenarios for adaptation, the Netherlands has been divided into three HEZs, based on the soil type () and the elevation with respect to MSL: (1) the man-made polder areas with marine clay soils along the North Sea coast and the former Zuider Sea with elevation below sea level; (2) the low-lying peat land areas in the west (also below sea level) and north; and (3) the sandy and loamy soils areas in the centre, south and east with elevations well above sea level (Van de Sandt & Goosen Citation2010).
Table 2. Adaptation of the water management approaches based on the predicted land use changes in respectively the marine clay areas, peat land areas and sandy soil areas (after Van de Sandt & Goosen Citation2010).
Each zone has its characteristic land use and, based on this land use, different water management strategies are used to control the water level in the drainage system, the so-called drainage base. The drainage base determines the amount of water that can be stored in the soil profile above the groundwater level (). Analyses made with the regional hydrologic model SIMGRO (www.simgro.alterra.nl) show that a deeper drainage base in combination with a less intensive drainage system (e.g. an increase in drain distances) can reduce peak discharges by 10–15% (Querner Citation2003). Simulation with meteorological data over the period 1951–2000 showed that the required drainage rate, with a frequency of exceedance of 10 years, is highest in the marine clay areas (17.2 mm/d), compared to 14.0 mm/d for the peat lands and 13.8 mm/d for the sandy soil areas. This information was used for Van de Sandt and Goosen's assessments.
Table 3. Land use, drainage base and potential water storage in the soil profile for the three land use zones in the Netherlands–(after Querner Citation2003).
Pilot areas in each of the three HEZs were constructed by various organizations and research institutes to test the new approaches to drainage. Although the research is ongoing, the first lessons learned related to the challenges, risks and limitations associated with the introduction of the new approach in drainage are presented in the following sections.
Polders with marine clay soils along the North Sea and the former Zuider Sea
The marine clay areas of the Netherlands extend over the entire coastal zone and along the IJsselmeer with some interruption from the western and northern peat land areas (). We distinguish several major marine clay areas in the Netherlands: the south-west delta, the reclaimed land in the Randstad, the Flevoland polders and the clay polder areas in North Holland, Friesland and Groningen. The land is predominantly used for agriculture, but especially around cities other types of land use are developing rapidly, i.e. urbanization, recreation, transport and industrial infrastructure.
Traditionally, water management has been geared to the land use with a high degree of regulation and focus on reducing salinization caused by upward seepage. Drainage systems consist of (pipe) field drains to control the groundwater level in the field. These field systems drain by gravity into open collector drains from where the water is pumped to the main drainage system. The open collector drains are also used to remove excess surface water. In large parts of the west and the north of the Netherlands, the shallow groundwater is brackish with only thin fresh water lenses (<2 m) in or just below the root zone. Due to sea level rise, upward seepage of the brackish groundwater will increase in the coming years and thus the total salt flux as well. This process is called internal salinization. Next to sea level rise, the internal salinization is also enhanced by subsidence. Along the south-west coast of the Netherlands, salt loads are expected to double in the coming years in some parts of the deep and large polders (Oude Essink et–al. Citation2010). In the deep polders further inland, autonomous upconing of deeper and more brackish groundwater will also increase salt loads.
To combat internal salinization, the water management system is flushed with fresh water from the IJssel Lake and the major rivers. This flushing is not efficient because the water management system is widespread, and fine-meshed with many dead end loops; subsequently only a small percentage of the total amount of water that flows to the sea is used for flushing and irrigation (Van de Sandt & Goosen Citation2010). The adaptation measures under study in this zone aim to increase the storage of excess rainwater in the soil profile and to use this excess water to leach salts.
Controlled drainage experiment at Rusthoeve
At the experimental farm Rusthoeve in North-Beverland (51°34′50″ N, 3°50′50″ E), a controlled drainage experiment is ongoing. Agriculture, mainly sugar beets, winter wheat and potatoes, is purely rain fed because the groundwater is brackish at shallow depth and surface irrigation water is not available. Pipe field drains were installed at a depth of 1.20 and 1.60 m below ground level (GL) and connected to a pipe collector drain through an adjustable outlet that can be used to control the invert level of the outflow (= the drainage base). In the period from January 2011 to July 2012, two combinations of drain depth (1.20 and 1.60 m below GL) in combination with two levels of the drainage base (0.90 and 1.20 m below GL) were tested (Staarink Citation2014). The collected data were used to calibrate the SWAP (Soil, Water, Atmosphere and Plant) model (http://www.swap.alterra.nl/). Next, SWAP and weather data over the period 1968–2011 were used to assess the effects of controlled drainage on: (1) workability of the land in spring, (2) crop transpiration, (3) water conservation based on weather forecasting, (4) mitigating salt stress and (5) nitrogen losses.
Workability in spring
The simulations show that the drainage base is clearly related to the number of workable days in April, the month used for the preparation of the field (ploughing and sowing). A shallow drainage base results in less workable days, and a deeper drainage base results in more workable days, although the number of workable days for one combination of drain depth/drainage base varies greatly between years, depending on rainfall, which in April can vary between 31 and 60 mm (KNMI Citation2013). There are years with no workable days in April for the drainage base of 1.20 m below GL, while during other years all days in April can be classified as workable for all drain depth and drainage base combinations.
Increase in crop transpiration
The influence of the drainage base on crop transpiration was simulated by comparing relative crop transpiration (actual transpiration/potential transpiration) for the four combinations of drain depth/drainage base. The results show that the influence of these depths on crop transpiration is small, in the order of a few millimetres per year. The results are, however, highly dependent upon soil type: it varied between 8 mm for loam soils and 79 mm for sandy soils. The difference between sand and loam can be explained by the high water content at field capacity of a loam soil compared to a sandy soil. For the sandy soils, the average difference in crop transpiration between a drainage base of respectively 0.60 and 1.20 m below GL is about 7 mm. Compared to the average irrigation application of 20 mm, the water conservation is small.
Water conservation based on weather prediction
The simulations show that it takes a few days for the groundwater level to respond to changes in the drainage base. Simulations indicate that if it is possible to predict the weather a week in advance, and if the drainage base is lowered in time when heavy rain is expected, peaks in the groundwater level (and thus outflow) can be reduced.
Role of controlled drainage practices in mitigating salt stress
The simulations show that a shallow drainage base in winter (0.60 m below GL) does increase the percolation of water by about 23 mm per year on average, compared to conventional drainage (1.20 m below GL). For the year 2003, with high precipitation in April–May, an increased downward flux did not lead to a significant increase in the salt concentrations in the root zone, results that were confirmed by the farmers. Thus the research was not conclusive on this point.
Effect of controlled drainage on nitrogen losses
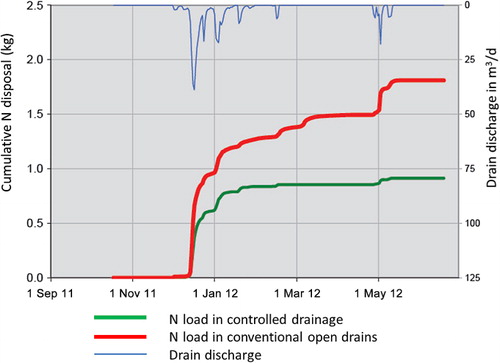
At the same experimental station, the nutrient losses through uncontrolled subsurface drains were already monitored over the period 1994–1996 (Van den Eertwegh Citation2013). Of the total amount of nitrogen supplied as fertilizer, 75% was used for crop production, 10–15% was lost through denitrification to the atmosphere and 10–15% was leached to the surface water through the subsurface drainage system. On the other hand, almost all the phosphorus was used by the crop: with only about 4% ending up in the drainage water. At the same time, additional supply of phosphorus took place through capillary rise of the groundwater. In the winter of 2011–2012, the total nitrogen load in the drainage effluent was again monitored in a controlled as well as a traditional uncontrolled drainage plot (Stuyt, van der Bolt et–al. Citation2013). The results indicated that the cumulative N load from the controlled drainage plot was about 47% lower compared to the uncontrolled system (). Similar results were also obtained in other pilot areas, e.g. in an experimental farm in Rijsbergen, Noord-Brabant, where the cost savings from a reduction in application of N fertilizers are the biggest incentive for the farmer to apply controlled drainage as water savings hardly affect his farm costs (personal communication with farmer on 9 November 2012).
Low-lying peat areas in western part of the Netherlands
Peat lands are characteristic for the Dutch landscape and mainly are used as grassland for pasture. There are two regions with peat: the western peat land region (the ‘Green Heart’ area between the major cities of Amsterdam, the Hague, Rotterdam and Utrecht) and the northern peat land region (Friesland and north-west Overijssel; ). The western peat land area is mainly used as grassland for dairy farming, but it also has a strong recreation function for the inhabitants of the four major cities of the Green Heart. In the northern peat land area, the dominant use is agricultural production, although there are also lakes and marshes used for nature and recreation.
Traditionally, these peat lands are drained by an open drainage system: shallow field drains evacuate the surface water to open collector drains, and water levels are controlled by gates and/or pumps. Drainage plays a major role in the never-ending process of oxidation, resulting in subsidence but greenhouse gas emissions. To reduce subsidence, surface water levels in the traditionally used open drainage system in peat lands are kept shallow, between 30 and 60 cm below GL. This results in waterlogged conditions in winter time, when the drainage capacity is not sufficient to remove all excess water, but also in low groundwater levels in dry periods in summer, when the recharge of water from the open drain is insufficient to replenish the groundwater used by the crop.
To cope with climate change, the concept of submerged subsurface drainage systems is investigated with the aim of gaining better control of the groundwater level in periods of excess rainfall and to act as sub-irrigation during dry summer periods.
Submerged drainage experiments in the Green Heart
To reduce subsidence and to increase the bearing capacity, field trials with submerged subsurface pipe drains were conducted in 11 pilot areas in the Green Heart (51°51′–52°38′ N, 4°43′–5°00′ E). The submerged drains were installed about 10–30 cm below the water level of the open drainage system. During periods with rainfall excess, the submerged drains lower the groundwater level; during periods of rainfall deficit, the drains act as a sub-irrigation system, enabling the surface water to infiltrate to keep the groundwater level high. Thus the groundwater level between the drains is more horizontal with the submerged subsurface drains compared to the water table in a traditional open drainage system. This horizontal water table is the key to reducing soil subsidence, to increasing the bearing capacity in spring and autumn, and to optimizing grass production.
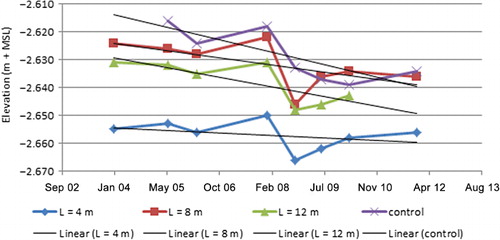
Subsidence rates, bearing capacity and grass production were monitored between 2004 and 2013. The data were combined with field data from elsewhere, laboratory research, literature and interviews with farmers (Den Hartogh Citation2014). Analysis of the measured data shows that subsidence rates were reduced between 17% and 58%. For example, in the pilot area Zegveld, which has a ditch water level of 60 cm below soil surface, subsidence rates were measured for drain spacing (L) of 4, 8 and 12 m (). Compared to the control plot (no submerged drains), submerged drainage reduced the soil subsidence with 58% for L = 4 m, 53% for L–= 8 m and 29% for L = 12 m.
The subsurface drainage systems also increased the bearing capacity of the land, resulting in longer periods that the plots were accessible (bearing capacity above 5 kg/cm2): up to 4 weeks in spring and also 4 weeks in autumn were gained.
The effects on the grass production were mixed, a 3–5% higher grass production in early spring (because of intensified drainage and lower water tables), but the extra infiltration (and thus higher water tables) later in the season reduced not only the subsidence but also the grass production (up to 5%). Overall, no real impact on the grass production was found.
These first results clearly indicate that submerged drainage systems have the potential to cope with extreme rainfall events (both dryer and wetter events), reduce subsidence and increase the bearing capacity of the peat lands.
Sandy and loamy soil areas in the south and east of the Netherlands
The Netherlands has three large sandy areas (): (1) in the middle (Veluwe), (2) in the east (Drenthe, Overijssel and East Gelderland) and (3) in the south (Brabant and Limburg). Characteristic elements are sandy plateaus intersected by sand and peat stream valleys. Originally, large parts of the land in Drenthe and Brabant were covered with peat that, over the last two centuries, was excavated and used for fuel. This has resulted in relatively flat areas with mainly sandy soils. Land use is diverse, varying between multifunctional peri-urban regions, rural (small-scale agriculture, forest and nature) areas with high cultural value in Overijssel, East Gelderland and Limburg, and large-scale agriculture in Drenthe and Brabant.
The hydrology is characterized by infiltration areas and seepage areas. The higher sandy areas act as infiltration areas, where the precipitation surplus percolates to the groundwater that resurfaces as seepage in the valleys between these higher areas. Many streams have been straightened to improve drainage, resulting in excessive drainage upstream and flooding downstream. Agriculture is mainly rain fed, sometimes supplemented by groundwater irrigation. Changing rainfall patterns not only increase the risk of flooding during extreme rainfall events but also lengthen and intensify the periods with precipitation deficits in the growing season. A way to retain water upstream is to introduce real-time control structures to utilize the storage that is available in the canals and streams in the upstream part of a (sub)catchment (Van Overloop Citation2006). To test the new approaches in drainage for this HEZ, controlled drainage experiments in Ospel and Haghorst were conducted to investigate the effects of controlled drainage on the groundwater level and N losses, and computer simulations were used to assess the effects of controlled drainage on neighbouring nature areas.
Controlled drainage experiments in Ospel and Haghorst
Controlled drainage experiments were conducted in the pilot area Ospel, North Limburg, a sandy loam area in south-east of the Netherlands (51°17′44″N, 5°48′53″E). In the pilot area (3.5 ha), three types of drainage systems were installed: (1) conventional uncontrolled drainage with an alternating drain depth of 0.80 and 1.30 below GL, (2) controlled drainage with a deep drainage base of 1.30 m below GL and (3) controlled drainage with a shallow drainage base of 0.80 m below GL. Data collected over a five-year period (2008–2012) confirmed the following (Stuyt, Kselik et–al. Citation2013):
Controlled drainage increases the average depth of the groundwater table and subsequently reduces the peak discharges as there is more storage capacity in the root zone above drain level.
Controlled drainage blocks have a higher N concentration (), but because the peak discharges are lower, the total N load for controlled drainage is lower compared to conventional drainage.
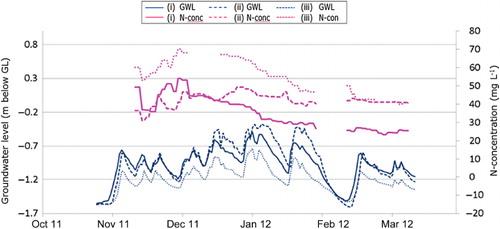
The differences, however, were not very large, probably because the soil profile was not uniform: layers with varying clay and silt content influenced the flow towards the drains and adjacent farm plots, despite the fact that buffer zones were created between plots.
Similar results were observed at a privately owned farm in Haghorst in Brabant, where the farmer installed a controlled drainage/sub-irrigation system on his 30 ha farm (51°30′01″N, 5°12′18″E). Monitoring of water tables in 2011–2012 indicated that the advantages of the controlled drainage are more pronounced for controlling drainage outflows than for controlling groundwater levels in adjacent fields. This is likely due to the lateral drainage caused by the differences in the elevation of the ground surface (Staarink Citation2012; De Buck et–al. Citation2013).
Effects of controlled drainage on nature areas
In the sandy soil areas, agricultural lands are often located next to nature reserve areas. In most of these agricultural lands, the natural drainage is sufficient; currently only 10–20% of these areas are equipped with subsurface drainage systems. To assess the effects of an increase in drainage intensity through the installation of controlled drainage systems, a literature study and model simulations were conducted (Kuijper et–al. Citation2012). The results indicate the following:
To reduce the negative effects of the more intensive drainage in the agricultural lands on the neighbouring nature areas, the drainage base needs to be increased to 0.50–1.00 m below GL in both the winter and summer.
Controlled drainage, in combination with a deeper drainage base, will reduce waterlogging during periods of rainfall excess in the agricultural lands and thus increase yields, and at the same time reduce drought stress in the nature areas during prolonged dry periods.
Unfortunately, this increase in the drainage base will be hard to achieve, because of the rather large natural drainage system especially on the sandy plateaus that are intersected by stream valleys.
Lowering the drainage base (even below the current winter level) to increase the workability in early spring is possible although timing is essential because in-field storage of rainfall in late spring is a prerequisite to avoid drought stress in summer.
Controlled drainage does not automatically result in additional storage of water in the root zone. Note that this contradicts the results of the model simulations that predicted additional water storage in the range of 15–115 mm ().
A decision support system to manage fresh water flushing
As previously mentioned, canal flushing to reduce adverse effects of upward seepage of brackish groundwater is low in efficiency. This is partly caused by the complex water management systems in the older polder areas in the western part of the Netherlands. These systems were developed and expanded over time, and the same is true for the flushing strategies that were mainly developed by trial and error. Water Boards have to respond to changing demands in water management as a result of climate change, in particular prolonged dry periods, in combination with land use changes in the direction of more capital-intensive agriculture. Since the early 1980s, complex hydrological models have been introduced to determine the fresh water demands at regional and local level. Understanding the information generated by these models and the consequences of different management approaches is a challenge.
To assist Water Boards with these complex dilemmas of the distribution of the scarce surface water, ‘€ureyeopener’, a decision support system based on a spreadsheet tool, was developed. €ureyeopener combines the output of complex simulation models for both physical and economic responses to changes in water management practices in a user friendly, accessible way (Stuyt, Delsman et–al. Citation2013). €ureyeopener consist of two modules:
The crop damage module to assess the relation between the salt concentration of surface waters used for irrigation and the yield reduction;
The surface water routing module to assess the water and salt balances for the separate sections of the surface water network and quantify surface water salinity in these sections.
To make the results understandable to non-experts, they are expressed in economic terms, i.e. salt damage and drought damage to crops are expressed in euro per polder units for every year that is simulated.
In 2013, €ureyeopener was used to assist the Water Board of Rijnland in understanding the complexity of (operational) water management in its service area, which roughly cover the Green Heart area (51°51′–52°38′ N, 4°43′–5°00′ E). This is a densely populated deltaic region, predominantly peat lands, with substantial economic interests and many land use functions that require fresh water, especially during prolonged dry spells in summer when fresh water is scarce and water managers have to cope with many dilemmas. As such, €ureyeopener provided a useful platform for the Water Board to share views on possible water management measures with the stakeholders in the area. As the measures are presented in economic terms, the results are tangible for these stakeholders.
€ureyeopener was also used in the northern part of the province of North Holland to model the Anna Paulowna Polder (52°50′–52°54′ N, 4°45′–4°54′ E), an area of about 5000 ha mainly used to grow flower bulbs which is a high capital-intensive type of agriculture that puts high demands on water management (Lu Xiong Citation2014). The main aim was to see if the tool could address the entire, both physical and economic, fresh water supply chain for this rather small polder, especially during water stress periods in dry summers.
In the €ureyeopener spreadsheet, the results of the–simulations with the Netherlands Hydrological Instrument (NHI; http://www.nhi.nu/nhi), the SWAP model and the crop-salt damage functions were combined over a 30-year period (1980–2010). The results confirm that the salinity of the surface water supplied to the polder has a significant impact on the total demand for fresh water to reduce the salt damage to crops. If slightly higher salinity levels are allowed, the fresh water demand can be reduced substantially, mainly because of the reduced need for flushing. On the other hand, if stricter salinity threshold values, that will substantially increase the fresh water demand, are used, it will not significantly lower crop-salt damage.
Based on the results of these two studies, recommendations were formulated to refine both the calculation method of the €ureyeopener spreadsheet model and for the simulations made by NHI and SWAP. However, this requires more locally specific input data. It is an avenue that is worth pursuing to assist water managers in selecting strategies for their regions.
Climate adaptive drainage for all three zones
Controlled drainage aims to reduce peak discharges and water stress by storing water in the field. One of the main challenges in implementing this strategy is the operation of a controlled drainage system as it takes a few days for the groundwater level to adjust after the drainage base has been set to a different level. Thus as previously noted the system needs to be operated based on the weather forecast. To be able to do this, an improved controlled drainage system, the Climate Adaptive Drainage (CAD) system, has been developed (Van den Eertwegh, van Bakel et–al. Citation2013).
The CAD system anticipates hydrological events based on weather forecasts and adjusts the drainage intensity by remote control in such a way that it is possible to reduce peak discharges in periods of rainfall excess (a benefit for the water managers) or store extra water in periods of water stress (a benefit to the farmer). The CAD system consists of three components, i.e. (i) a controlled drainage system (buried field drains), (ii) a remote-controlled adjustable drain outlet and (iii) a telemetry and database system to process the weather forecast. The system has been tested in three pilot areas in Rijsbergen, Marwijksoord and Haaksbergen (). Preliminary results indicate the following:
Table 4. Pilot areas in Rijsbergen, Marwijksoord and Haaksbergen to test the concept of CAD (http://www.futurewater.nl/kad/pilots/).
Peak discharge can be reduced by 12–20%.
For a sample area with one water manager and 50–100 farmers, the yearly benefits (estimated between €190 000 and €270 000) clearly outweigh the yearly cost (estimated between €100 000 and €190 000).
About 50–60% of the area in the Netherlands that is in need of drainage is suitable for the CAD system (between 100 000 and 200 000 ha), mainly in Zeeland, Flevoland, the deep polders in Noord- and Zuid-Holland and the valley bottom areas in the east and south.
Water managers see CAD as an effective yet costly measure to reduce increased peak flows due to climate change.
Farmers have also indicated their willingness to cooperate with CAD because they expect that it will help them reduce drought stress in dry periods.
Concluding remarks
Preliminary results of all these studies indicate that controlled drainage is an effective tool to reduce peak discharges and drought stress. In the marine clay areas, controlled drainage can also help to increase the workability of the land and enhance crop transpiration. The effects on mitigating salt stress, however, are not yet well established. In peat lands, controlled drainage is a good tool for reducing subsidence and increasing workability, but the effects on crop yields are not yet well established. In the higher sandy areas, controlled drainage can increase the groundwater level and thus reduce drought stress, although this effect depends very much on the local circumstances: in areas with natural drainage, these effects are negligible.
Controlled drainage shows promise as a tool to improve the balance between various types of land use, not only between different types of agricultural use but also between agriculture and nature, an often delicate balance. In all studies, controlled drainage resulted in a reduction in nitrogen losses and thus has a positive effect on the quality of drainage effluent. A system that combines controlled drainage with weather forecasting also look promising, both for the water manager and for the farmers. While the evidence clearly shows that controlled drainage has many benefits compared to traditional uncontrolled drainage systems (), it must be recognized that controlled drainage solutions are very location-specific, and that tailor-made solutions are a prerequisite for success. Further research is needed to fill these knowledge gaps related to making controlled drainage a feasible strategy that can be widely adopted, adapted and implemented to successfully cope with water demand and climate change in the Netherlands.
Table 5. Comparison of the effects of conventional drainage and controlled drains at field and drain level (after Stuyt, van der Bolt et al. Citation2013).
Acknowledgement
The data presented in this paper are from numerous research projects in which we and our colleagues from Wageningen University and Alterra have participated for more than 10 years. This paper could not have been written without the data and support provided by these projects.
Disclosure statement
No potential conflict of interest was reported by the authors.
References
- Centraal Bureau voor de Statisitek (CBS). 2014. StatLine,–electronic databank of Statistics Netherlands.– Available from: http://statline.cbs.nlassessed:2-07-2014
- Colenbrander HJ, editor. 1989. Water in the Netherlands. Proceedings and Information/TNO Committee on Hydrological Research; The Hague, no. 37 – 96 pp.
- Daniels EE, Lenderink G, Hutjes RWA, Holtslag AAM. 2013. Spatial precipitation patterns and trends in The Netherlands during 1951–2009. Int J Climatol. 34:1773–1784.10.1002/joc.3800
- De Bakker H. 1982. Soils and their geography. In: de Bakker H, van den Berg MW, editors. Proceedings of the symposium on peat lands below sea level. Wageningen: ILRI Publication 30; p. 85–97.
- De Buck AJ, Stuyt LCPM, van der Schoot JR. 2013. Water conservation and infiltration through controlled drainage – field experiment 2010–2011. In: Stuyt LCPM, editor. Regelbare drainage als schakel in toekomstbestendig waterbeheer [Controlled drainage as a tool for future-proof water management]. Alterra report 2370, Alterra, Wageningen; p. 253–284. Dutch.
- Delta Committee. 2008. Working with water. Available from: http://www.deltacommissie.com/en/advies. Dutch with English Summary.
- Den Hartogh JH. 2014. The impact of submerged drainage on groundwater level, soil subsidence, bearing capacity, and grass production [MSc thesis]. Water Resources Management Group, Wageningen University, Wageningen; 184 pp.
- El-Atfy HE, Abdel-Alim MQ, Ritzema HP. 1991. A modified layout of the subsurface drainage system for rice areas in the Nile Delta, Egypt. Agr Water Manage. 19:289–302.10.1016/0378-3774(91)90022-B
- Koninklijk Nederlands Meteorologisch Instituut (KNMI). 2013. Climatology, daily data from the weather in Netherlands. Available from: http://www.knmi.nl/kd/daggegevens/selectie.cgi
- Koninklijk Nederlands Meteorologisch Instituut (KNMI). 2014. KNMI'14 climate scenarios for the Netherlands – a guide for professionals in climate adaptation. De Bilt (the Netherlands): KNMI; 34 pp.
- Kuijper MJM, Broers HP, Rozemeijer JC. 2012. Effecten van peilgestuurde drainage op natuur [Effects of controlled drainage on nature areas]. Deltares, Report 1206925-000-BGS-0003, Delft; 54 pp.
- Lu Xiong. 2014. From salinization to solution – the €ureyeopener applied in Anna Paulowna, a case study to demonstrate its applicability on a small scale [MSc thesis]. Water Resources Management Group, Wageningen University, Wageningen; 76 pp.
- Oosterbaan RJ. 2006. Agricultural drainage criteria. In: Ritzema, HP, editor. Drainage principles and applications. 3rd ed. Wageningen: ILRI Publication 16, Alterra, Wageningen University and Research Centre, Wageningen; p. 635–690.
- Oude Essink GHP, van Baaren ES, de Louw PGB. 2010. Effects of climate change on coastal groundwater systems: a modeling study in the Netherlands. Water Resour Res. 46:16.
- Prak H. 2002. Waternood: working on integrated water management in rural areas. ICID, Proceedings of the 18th Congress; Paper Q51-R2.08; Montreal, Canada; 16 pp.
- Querner EP. 2003. Can groundwater storage be used to reduce drain discharges? [Is grondwaterberging beter te benutten om afvoeren te verminderen?]. Stromingen. 9–1:23–32.
- Ritzema H. 2009. Drain for gain – making water management worth its salt [PhD thesis]. Wageningen University and UNESCO-IHE Delft, CRC Press/Balkema, Leiden; 208 pp.
- Skaggs RW, Fausey NR, Evans RO. 2012. Drainage water management. J Soil Water Conserv. 67:167A–172A.10.2489/jswc.67.6.167A
- Staarink H. 2012. Controlled drainage and subsurface irrigation – how foreign experiences relate to a drainage system constructed in the Netherlands [BSc thesis]. Water Resource Management Group Wageningen University, Wageningen; 24 pp.
- Staarink H. 2014. Water conservation and controlled drainage – a modelling study for an experimental field in the Netherlands [MSc thesis]. Water Resource Management Group Wageningen University, Wageningen; 89 pp.
- Stuyt LCPM, Delsman JR, Van Bakel PJT, Oude Essink GHP, Kselik RAL, Massop HTL. 2013. €ureyeopener: a simple DSS for instant evaluation of options to manage fresh water scarcity in agriculture. J Water Res Econ (under review).
- Stuyt LCPM, Kselik R, Renaud L, Groenendijk P, Van der Bolt FJE. 2013. Field experiment controlled drainage in Ospel (Limburg), 2008–2012. In: Stuyt, LCPM, editor. Regelbare drainage als schakel in toekomstbestendig waterbeheer [Controlled drainage as a tool for future-proof water management]. Alterra report 2370, Alterra, Wageningen; p. 189–251. Dutch.
- Stuyt LCPM, van der Bolt FJE, Snellen WB, Groenendijk P, Schipper PNM, Harmsen J. 2013. Controlled drainage: principles, performance, practical experiences, changes and risks. In: Stuyt LCPM, editor. Regelbare drainage als schakel in toekomstbestendig waterbeheer [Controlled drainage as a tool for future-proof water management]. Alterra report 2370, Alterra, Wageningen; p. 21–51. Dutch.
- Van de Sandt K, Goosen H. 2010. Klimaatadaptatie in het landelijk gebied [Climate adaptation in rural areas, an exploration for a climate-proof the Netherlands]. Programmabureau Kennis voor Klimaat, Utrecht; 110 pp. Dutch.
- Van de Ven GP, editor. 1996. Man-made lowlands. History of water management and land reclamation in the Netherlands. Utrecht (the Netherlands): Stichting Matrijs; 293 pp.
- Van den Eertwegh G.A.P.H. van den. 2013. Rusthoeve pilot area research on the nutrient balance 1994–1996. In: Stuyt LCPM, editor. Regelbare drainage als schakel in toekomstbestendig waterbeheer [Controlled drainage as a tool for future-proof water management]. Alterra report 2370. Alterra, Wageningen; p. 83–85. Dutch.
- Van den Eertwegh G.A.P.H. van den, van Bakel PJT, Stuyt L, van Iersel A, Kuipers L, Talsma M, Droogers P. 2013. Climate adaptive drainage: an innovative method to reduce peak discharges and water shortages – summary and conclusions phase 2. FutureWater rapport 123, Wageningen; 19 pp. Dutch.
- Van den Noort PC. 1987. Land consolidation in the Netherlands. Land Use Policy. 4:11–13.10.1016/0264-8377(87)90004-4
- Van der Brugge R, Rotmans J, Loorbach D. 2005. The transition in Dutch water management. Reg Environ Change. 5:164–176.10.1007/s10113-004-0086-7
- Van der Molen WH. 1982. Water management in the western Netherlands. In: de Bakker H, van den Berg MW, editors. Proceedings of the symposium on peat lands below sea level. Wageningen: ILRI Publication 30; p. 106–121.
- Van Overloop PJ. 2006. Drainage control in water management of polders in the Netherlands. Irrig Drain Systems. 20:99–109.10.1007/s10795-006-5424-0
- Vlotman WF, Jansen HC. 2003. Controlled drainage for integrated water management. Paper no. 125, 9th International Drainage Workshop; September 10–13; Utrecht, The Netherlands.
- Wahba1 MAS, El-Ganainy M, Abdel-Dayem MS, Gobran Atef., Kandil H. 2001. Controlled drainage effects on water quality under semi-arid conditions in the western delta of Egypt. Irrig Drain. 50: 295–308.10.1002/ird.29