
Abstract
Poor maintenance of drainage systems has been identified as one of Swedish agriculture's weak points, as impaired land drainage can lead to major environmental problems. Drain maintenance work is receiving increasing attention in work conducted within the European Union Water Framework Directive. Moreover, the functionality and maintenance of agricultural ditches will need to be improved to cope with predicted higher pressures on water infrastructure in a future climate. In Sweden, ditch maintenance work is mandatory, but must be carried out with great consideration for the environment. There is currently no simple method available in Sweden for assessing the comprehensive status of open drainage ditches and determining whether remedial measures are needed. This study tested an on-site method, Minnesota Agricultural Ditch Research Assessment for Stability, for evaluating the status of drains and the need for improvements. The study also included an evaluation of physical ditch properties that can be assessed visually on-site and the processes they represent. The results showed that it is viable to evaluate ditch properties such as bank stability, erosion and deposition susceptibility visually on-site. However, more intensive surveys are needed to identify the processes affecting bank stability. For assessing how improvement of drain status affects bank stability and hydraulic properties, Hydrologic Engineering Centre's River Analysis System simulations can be a useful tool when complemented with updated cross-section measurements and existing documentation.
Introduction
The effects of drainage operations can lead to major environmental problems in surface water bodies, such as increased nutrient loads, rapid run-off during some periods and biodiversity losses, which in many cases prevent the water body being classified as having good ecological status. Good maintenance of open ditches is becoming increasingly important in the work of the European Union Water Framework Directive (Hoffman Citation2010). Ditch maintenance is necessary to remove woody vegetation and deposited sediment, stabilise bank slopes and address toe scour problems (Fausey et al. Citation1982). Routine maintenance activities are costly, disrupt the existing ecology and adversely affect water quality (Kallio et al. Citation2010). Thus there is increasing conflict between demands to maintain ditches and demands to protect the environment. Recent statistics presented by the Swedish Board of Agriculture showed that about 80% of arable land in Sweden has satisfactory drainage (SCB Citation2014). This means that there is a need for drainage measures on about 20% of Swedish arable land today. According to the same survey, more drainage measures are needed than are currently planned, as only 6% of land is planned to have either new or renewed drainage within the next five years (SCB Citation2014). The Federation of Swedish Farmers in cooperation with the Ministry of Rural Affairs organised courses on maintenance of open ditches and water courses for contractors in 2009 and 2010. These courses concentrated on practical execution using appropriate technology, legal issues and environmental concerns. In Sweden, farmers have the right and obligation to maintain ditches, but this needs to be done without harming the environment. They are also responsible for monitoring drainage ditch performance. Properly designed ditches should ensure that the velocity of flow does not cause scouring or sedimentation and should have sufficient capacity to carry the design flow, a hydraulic gradient at the appropriate depth, stable side slopes and a low need for maintenance. Some ditches in the countryside are stable, while others require large sums of money for maintenance. Unstable ditches can generate significant quantities of sediment, which degrade the hydraulic capacity and water quality and often lead to eutrophication downstream (Magner et al. Citation2010). This means that a ditch could be converted from a receiver of P to a source of P. Furthermore, an insufficient hydraulic capacity can cause inundation with the consequence that adjacent land will also become contributor of nutrients to the water body.
A method of ditch evaluation is therefore a necessary tool in order to determine whether and how drainage ditches have changed over time. Once the reasons behind impaired function and high transport of sediment and nutrients have been identified, it is possible to implement the right measures at the right place. This could improve both the environmental benefits and the cost-effectiveness of interventions such as boundaries and protection zones, diversion of surface and pressurised water, two-stage ditches, phosphorus retention dams and constructed wetlands.
The overall aim of this study was to develop a method for evaluating the status of drainage ditches and define the need for remedial measures. Specific objectives were to identify ditch properties that can be evaluated visually on-site and the soil erosion processes they represent; to define the parameters that need more intensive surveys and suggest how they can be estimated using simplified methods; and to develop a practical manual for evaluating ditch status. The intended outcome of the study is a useful assessment tool for farmers and advisors.
Materials and methods
Field site
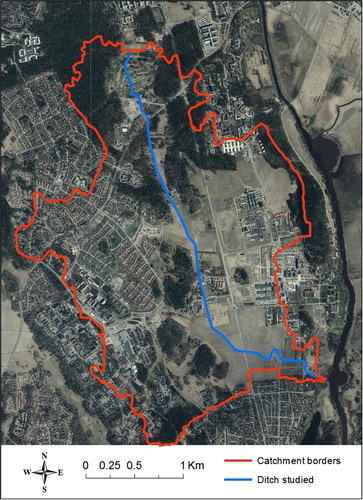
The catchment studied is located south of Uppsala and has its outlet in Fyrisån at Ultuna, 5 km south of Uppsala at 17°39′51.726′′E and 59°48′23.312′′N (). The area of the catchment is 640 ha. Mean annual temperature in the area is 5.5°C (data from Ultuna 1961–1990), but four months of the year (December, January, February and March) have a mean temperature below 0°C (Alexandersson et al. Citation1991). Mean annual precipitation is 528 mm. The geology of the region that includes the catchment area is Quaternary and topographically it is dominated by an esker (a ridge with coarse glacial deposits). In lower areas around the esker, the topography is flat. To the north-west the landscape is dominated by forest and the soil consists of post-glacial sand deposits. To the east, there is predominantly farmland and other open land on well-aggregated silty clay to clay soil (45–60% clay), with parent material consisting of post-glacial sedimentary clay. The land use is dominated by agriculture and agricultural land, but within the area there are also urban settlements which have increased from 7% to 30% of total area during the past 60 years and further expansion is planned. Wetlands are found near the outlet. Run-off from the area, both from the subsurface-drained agricultural land and surface run-off through storm drains from urban areas, is conducted to a drainage ditch. The total length of the ditch studied here was about 4.5 km. The ditch reach closest to the outlet overflows at high flows. In total, there are 13 culverts in the ditch, ranging in diameter from 45 cm to 140 cm. At several places the ditch is in need of repair and some culverts have been broken or displaced. There are also problems with erosion within the water course, mostly in downstream reaches close to the outlet.
Measurements
The ditch profile was measured at 25 locations along its length. For each profile, measurements of cross section and sediment depth were made with a theodolite (Zeiss Ni 2), staff and graded rod. These profiles were compared against construction blueprints for the ditch dating from 1974, to determine whether the ditch profile has changed during the years.
Methodology for evaluation of ditch status
A visual evaluation of ditch status was made using MADRAS (Minnesota Agricultural Ditch Research Assessment for Stability), a method developed for visual ditch stability assessment (Magner et al. Citation2010). The following parameters were included in the assessment: bank stability (erosion from surface run-off, mass failure and seepage), over-widening or undercutting and deposition. Based on the observations, every ditch segment was allocated a score. The score system was composed of three parts, bank stability, over-widening/undercut banks and deposition, with a high score indicating a high impact.
Bank stability was scored based on the occurrence of the following indicators: (1) bank erosion from surface run-off, (2) mass failure and (3) groundwater intrusion. If no indicator was observed, the ditch segment was assessed as being in optimal condition and was awarded 0 points. If one indicator was detected, the ditch segment was assessed as being marginally affected and was given 3 points. If two indicators were found, the segment was deemed affected and given 5 points. If three indicators or 10% of the ditch segment were affected at any point, the ditch status was rated as bad and was given 10 points.
Over-widening/undercut banks were assessed based on the following indicators: (1) bank evenly shaped across the ditch segment, with no undercutting visible; (2) one of the following indicators visible: irregular ditch shape, irregular channel width, vertical ditch bank; (3) two of the following indicators visible: irregular ditch shape, irregular channel width, vertical ditch bank. If no indicator was observed, the ditch segment was considered to be in optimal condition and received 0 points. If one indicator was detected, it was deemed to be marginally affected and was given 3 points. If two indicators were found, the segment was rated affected and given 5 points. If three indicators or 20% of the ditch banks were undercut and had fallen into the channel, the segment was given 10 points.
Deposition was assessed based on the following indicators: (1) no significant deposit; (2) sediment depth exceeding on average 7.5 cm; (3) sediment deposits in the channel; (4) banks in the water channel. The first indicator gave 0 points, the second 3 points, the third 5 points and the fourth indicator gave 10 points.
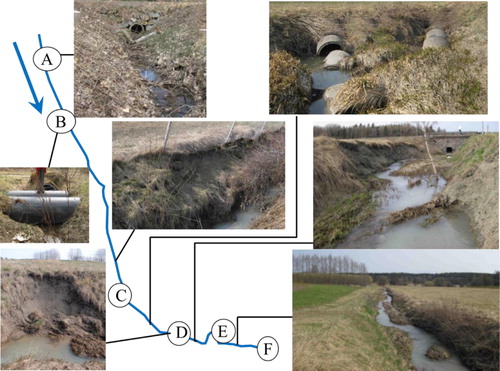
The scores were summed up to a total score of 0–30 points. A ditch was considered to be in good condition when it had an overall score between 0 and 8 and marginally affected ditches fell in the range of 9–15 points. Affected ditches had a score between 16 and 20 points, while a ditch segment with a score of 21 points or more was considered to be in poor condition. The study included six ditch segments that represented different combinations of soils and sizes. A segment was equal to 30 times the ditch width that is long enough to be a representative ditch segment. The lengths of the segments in this study were between 45 m and 120 m. All segments (A–F) were evaluated according to MADRAS (). In addition, observations were made on the degree of vegetation cover in the ditch reaches, surface erosion on adjacent land, culverts and outlets.
Methodology for evaluation of ditch flow capacity
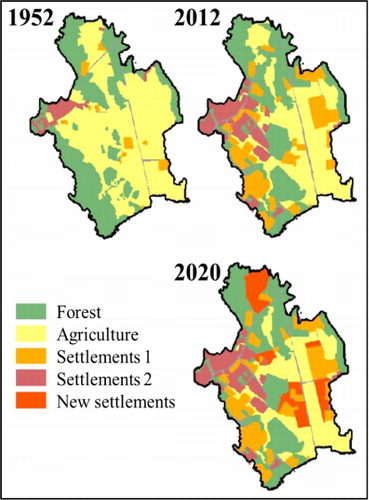
HEC-RAS (Hydrologic Engineering Centre's River Analysis System; USACE Citation2010), was used to model how changes in ditch geometry, water flow rates and ditch status affected the water level in the ditch. HEC-RAS software is available at USACE website (http://www.hec.usace.army.mil/software/hec-ras/downloads.aspx). Three scenarios with different land uses representing the years 1952, 2012 and 2020 were examined, the latter using detailed future development plans. The maps of land use from different years were used to estimate how run-off conditions have changed from installation of the ditch up to the present day and how they will change in the future. The hydraulic design procedure involved evaluating the existing conditions for each channel using HEC-RAS.
HEC-RAS estimates the flow in natural and man-made channels by using the one-dimensional Manning equation (Chow Citation1964). Energy losses are evaluated by friction and contraction/expansion coefficients multiplied by the change in velocity head. Where the water surface profile varies rapidly, the momentum equation is utilised. By using these equations, HEC-RAS can handle hydraulic jumps and e.g. the hydraulics of bridges, and evaluate stream profiles. HEC-RAS can also be used to determine the effects of various obstructions such as bridges, culverts and structures in the flood plain. The software provides a number of outcomes, but in this study we only present water level, critical level for subcritical flow, water velocity and the shear forces of the flowing water in different sections of the channel, with high values indicating an increased risk of erosion.
Results and discussion
The MADRAS assessment of the present ditch status and the HEC-RAS simulations of the ditch for a 10-year recurring flow are presented below. Comparisons of the measured ditch profile at 25 locations along its length with blueprints for the ditch from 1974 showed that the ditch had eroded in various places and had become both wider and deeper.
Flow calculations were made by the time-area method (Svensk Vatten Citation2004) according to the land use in 1952, 2012 and future development plans in 2020. The results showed that the flow has increased by a factor of four since 1952 and will keep increasing with the new development plans, although not as dramatically as in the past ().
MADRAS assessment
The total score for all observed sections (A–F) are presented in and examples of changes in cross section from the original blueprints until the present day are provided in . In the ditch section from the start to point A, the channel banks were almost unaffected by erosion. The most visible signs of erosion were found close to the existing culvert. There was no evidence of groundwater seepage or bank erosion from surface run-off. The channel geometry was not significantly affected by bank slope and the ditch direction was constant in the segment. The vegetation along the ditch was acceptable with regard to erosion control. Grass covered most of the bank surface, but it was somewhat sparser on the east side. A 14-m stretch of the west side had undercut banks due to the ditch stream having begun to meander. According to the MADRAS system, this section of the ditch received 0 points with respect to bank stability, 3 points for over-widening/undercut banks and 0 points for sediment deposition. This gave a total score of 3.
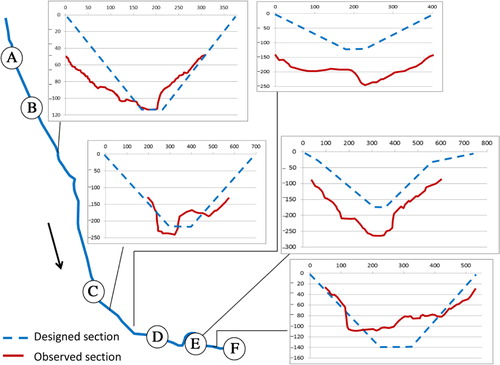
Table 1. Results of the ditch assessment in six segments with total MADRAS scores.
In the ditch section between A and B, the channel bank stability was rated relatively good, despite signs of minor bank failure. There was no evidence of groundwater seepage or bank erosion from surface run-off. The ditch geometry was not significantly affected despite the minor bank failures. A 13-m stretch of ditch bank was undercut on the east side and 3 m was undercut on the west side. Limited amounts of sediment were found in the ditch. Two culverts crossing the ditch restricted the flow, but no clear signs of erosion were observed at those cross points. According to MADRAS, the ditch was given 5 points with respect to bank stability, 3 points for over-widening/undercut banks and 0 points for sediment deposition. This gave a total score of 8.
In the ditch section between B and C, the channel bank stability was much worse despite the fact that the channel direction and banks in general had a good slope. However, there were many signs of bank failures, the vegetation cover was sparse along some reaches and a fence along the channel was destabilised and tilting towards the ditch. Half of the surveyed section was influenced by some bank failure. Collapsed material had a damming effect in some reaches, which seemed to have accelerated erosion processes, as evidenced, e.g., by undercut ditch banks. The channel was undercut in almost all the surveyed section. The channel width varied between 0.7 m and 1.2 m. There were no signs of groundwater seepage or bank erosion from surface run-off. According to the MADRAS system, the ditch was given 5 points with respect to bank stability, 10 points with respect to over-widening/undercut banks and 3 points with respect to sediment deposition. This gave a total score of 18 points.
The ditch section between C and D had a vertical ditch bank with no vegetation cover. Further downstream, damming by collapsed material resulted in slow water flow and a deep channel with undercut banks. Upstream, there were visible signs of sedimentation, with sediment material emerging above the water surface. Downstream, deeper layers of sediment were measured. The banks were very unstable and the original design of the ditch had been greatly altered. Basically, the whole ditch segment was affected by bank failure and sedimentation. The ditch banks were undercut along the entire surveyed section. According to the MADRAS system, the ditch was given 10 points with respect to bank stability, 10 points with respect to over-widening/undercut banks and 10 points for sediment deposition. This resulted in the total maximum score of 30 points.
The ditch section between D and E had a channel width that varied between 0.8 m and 2.4 m and 50% of the section showed signs of being influenced by bank collapse. The ditch geometry was affected by bank failure along the entire section. The channel bank slope varied greatly, with an unacceptable slope with respect to bank stability, and some vertical banks lacked a vegetation cover. The ditch had the character of a two-stage ditch. No signs of groundwater seepage were observed, but there was evidence of surface run-off. Sediment depth was over 75 cm in some areas. According to the MADRAS system, the ditch was given 10 points with respect to bank stability, 10 points with respect to over-widening/undercut banks and 10 points with respect to sediment deposition. The overall score for ditch sections D and E was thus 30 points.
In the ditch section between E and F the ditch banks were missing entirely, so it was not possible to assess this section with the MADRAS system. A channel was observed but the water flowed freely over a large area.
The MADRAS assessment tool was easy to apply once the user understood the system. However, a suitable time for assessment of vegetated ditches under Swedish conditions is in spring (1–2 months), since this is the time with less vegetation cover. This could also be the time with relatively high flows, impairing the evaluation. In the most degraded sections of the ditch studied here, it was somewhat difficult to assess the driving forces behind the degradation, e.g., whether it was shear by the water flow or surface run-off from surrounding land. Therefore, a topographical assessment of areas adjacent to the ditch is necessary in order to understand the different water flow paths and assess the potential for surface run-off.
Based on our implementation experiences, MADRAS is a good, systematic tool for evaluating the state of agricultural ditches. However, it could be helpful to expand the scale of scoring in order to provide a more sensitive scale. In addition, MADRAS is an educational tool for understanding potential degradation processes, ditch design, ditch maintenance and identification of necessary measures.
Assessment of flow impact in the ditch with HEC-RAS
Based on the calculated flows and the measured ditch profiles, the water levels in the ditch were simulated in HEC-RAS. The ditch capacity was also calculated manually with the Manning equation. The results showed that the ditch as it was constructed in 1974 was well-designed for the flow calculated from the land use in 1952. However, historical land use changes have had an impact on flow patterns and hydraulic pressure in the ditch. In 2012, more land was being used for settlements than in 1952 (). The conversion from natural land to hard surfaces has thereby increased. Furthermore, in coming decades the settlements will continue to expand according to Uppsala municipality's development plans. Already today, some culverts are too small for the current flows and if the flow rates continue to increase the situation will be further aggravated in the future.
In order to evaluate the ditch capacity in HEC-RAS, simulated 30-minute rain intensities with a return period of 10 years were used as design flow under the land use of 2012. Upstream in the first section of the ditch the flow was relatively low, and increased slightly from 0.30 m3 s−1 to 0.44 m3 s−1 at accumulation point 2 (see for locations). As several sections started to contribute to flow accumulation in the ditch, the flow increased to 1.14 m3 s−1 at accumulation point 3. Further downstream, contributions of rapid storm water flow from the settlements were included at accumulation point 4, resulting in a total flow of 3.49 m3 s−1. At accumulation point 5, the flow increased to 4.78 m3 s−1. Flow values for the different land use scenarios are presented in . Still only land use was considered for future flows. Probably the expected change to more extreme weather conditions will increase the calculated flows.
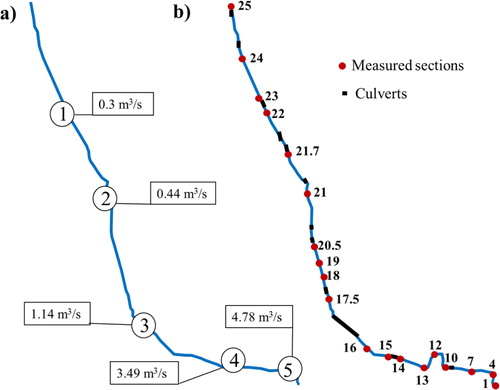
Table 2. Calculated flows in relation to the land use of 1952, 2012 and 2020 at different accumulation points.
In the HEC-RAS simulations the same flow was assumed within the observed ditch sections, although in reality the flow increased continuously towards the outlet.
A number of cross sections of the ditch were simulated, including the 13 existing culverts (). Of the culverts simulated, eight were showed to restrict the flow, resulting in elevation in the water level in the ditch (one example in ). The MADRAS assessment also revealed that banks in the vicinity of culverts showed a certain degree of degradation. The hydraulic shear was high in areas close to culverts due to expansion and contraction of the flow and also in some areas which had more acute ditch slope.
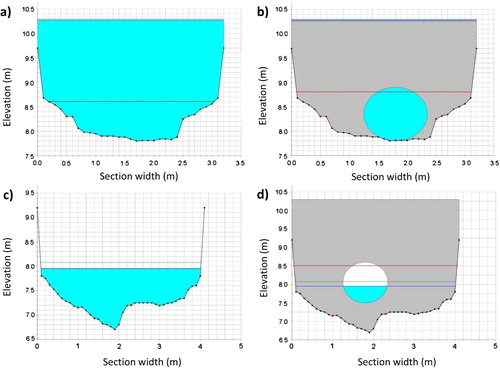
Table 3. Results of HEC-RAS simulations of the ditch sections evaluated, with precipitation data of 30-minute rain intensities with a return period of 10 years used as design flow under the land use of 2012.
In general, areas classified as degraded according to MADRAS did not have extreme values of hydraulic shear in the HEC-RAS simulations (). This means that the force exerted by the flowing water in the channel bed and on the banks was not high enough to cause the effects scored in the MADRAS evaluation. Therefore the flow rate alone cannot explain the degradation of these sections. However, the surface run-off observed in the MADRAS assessment may explain to some extent the observed level of degradation.
Using HEC-RAS in this study was a good complement to the qualitative assessment of MADRAS. The modelling in HEC-RAS facilitated identification of bottlenecks in the ditch system, e.g., in eight culverts out of 13 studied. The model also identified areas in which the hydraulic shear forces were high, which in the long run could be large enough to cause erosion. Erodibility values for the large number of different soils in Sweden are not known, and therefore it is difficult to relate the shear forces calculated by HEC-RAS to actual soil strength.
The decision of using MADRAS and/or HEC-RAS as tools for assessing the status and ditch stability will depend on the purpose of the assessment and the evaluators' skills. MADRAS is a suitable tool for a rapid assessment and highlight stability problems in the ditch, and the method is user-friendly. Nevertheless, HEC-RAS simulation is a good complement in order to achieve a more accurate assessment, understand the reasons behind ditch instability and propose remedial measures. Since, erodibility values for the large number of different soils in Sweden are not known is difficult to relate the shear forces calculated by HEC-RAS in this study to actual soil strength. Therefore, more studies on soil erodibility and soil shear strength of undisturbed soils are necessary.
Acknowledgements
The authors wish to thank the Swedish Farmers' Foundation for Agricultural Research for their financial support of this project.
Disclosure statement
No potential conflict of interest was reported by the authors.
Additional information
Funding
References
- Alexandersson H, Karlström C, Larsson-McCann S. 1991. Temperaturen och nederbörden i Sverige 1961-90 [Temperature and precipitation in Sweden 1961-90], Referensnormaler. SMHI Meteorologi. 81:87.
- Chow VT. 1964. Section 14. Runoff. In: Chow VT, editor. Handbook of applied hydrology. New York: McGraw-Hill; p 21–57.
- Fausey NR, Nolte BH, Beathard PS. 1982. Subsurface drainage maintenance in Ohio. Trans ASAE. 25:997–1001. 10.13031/2013.33654
- Hoffman M. 2010. Kurser kring rensning och underhåll av diken och vattendrag för entreprenörer under 2010 [Courses about maintenance of agricultural ditches and small streams for drainage contractors in 2010]. Vattenstänk nr 1, mars 2010. Jönköping: Jordbruksverkets Vattenenhet.
- Kallio R, Ward A, D'Ambrosio J, Witter JD. 2010. A decade later: the establishment, channel evolution, and stability of innovative two-stage agricultural ditches in the midwest region of the United states. CSBE100209 – Presented at ASABE's 9th International Drainage Symposium (IDS). Hosted by the Canadian Society for Bioengineering (CSBE/SCGAB) Québec City, Canada June 13–17, 2010.
- Magner J, Hansen B, Anderson C, Wilson B, Nieber J. 2010. Minnesota agricultural ditch reach assessment for stability (MADRAS): A Decision Support Tool, CSBE100229. Presented at ASABE's 9th International Drainage Symposium (IDS). Hosted by the Canadian Society for Bioengineering (CSBE/SCGAB) Québec City, Canada June 13–17, 2010.
- SCB. 2014. Dränering av jordbruksmark 2013. Preliminär statistik. Sveriges officiella statistik [Drainage of agricultural land in 2013. Preliminary statistics. Official statistics of Sweden]. Statisiska meddelande, JO 10 SM 1401.
- Svensk Vatten. 2004. Dimensionering av allmänna avloppsvattenledningar [Design of public wastewater conduits network]. Publikation P90, ISSN: 1651–4947, Svenskt Vatten AB.
- USACE. 2010. HEC-RAS river analysis system. Hydraulic reference manual version 4.1, January 2010. U.S. Army Corps of Engineers, Institute for Water Resources. Davids (CA): Hydrology Engineering Center.