
Abstract
The DRAINMOD simulation model was used to investigate combinations of drain depth and spacing for major soils of southern Minnesota to maximize profitability and minimize drained volume and surface runoff. Six soil types (Canisteo, Harps, Nicollet, Normania, Okoboji, and Webster) and three locations (Lamberton, Waseca, and Willmar) were included in the original study and one soil-location combination was reported on, herein (Webster–Waseca). Four drain depths (90, 105, 120, and 135 cm) were used and drain spacings were selected to simulate drainage coefficients from 3.2 to 19 mm/day. Soil input files for DRAINMOD were created using a combination of measured data from field sampling (soil texture and bulk density), data estimated with the Rosetta soil parameter model/van Genuchten equation (water retention curves), and publicly available data (soil permeability). Long-term simulations were conducted for each location using 90 years of historical climate data (1915–2005). Outputs from DRAINMOD were used to create “performance” indices that enable the concurrent consideration of profitability, drainage volumes, and surface runoff, when choosing drain depth and spacing. A spreadsheet design tool was developed to compute and display these indices, based on a few simple user inputs to define cost and crop price. Internal rate of return was used as the basis for profitability considerations. Results obtained indicated that in general, profitability may be increased with increased drain depth and spacing, due to system costs associated with narrower drain spacings. It was found that when considering both profitability and drainage volume, deeper, more widely spaced drainage systems were generally preferable, because of increased profitability and decreased drainage volumes.
Introduction
Artificial subsurface drainage has produced some of the most productive soils in the world and continues to be a common water management practice in the northern Corn belt region in the USA. The 2012 US Census of Agriculture estimated that 20% of the northern Midwestern states of Minnesota, Iowa, Indiana, Illinois, Ohio, and Michigan are artificially drained. Where poor natural drainage exists, the agronomic and environmental benefits of improved subsurface agricultural drainage are many, including improved crop growth and yield, improved soil trafficability and field operations, and a potential for decreased sediment loss, phosphorus loss, and peak surface runoff rates (Skaggs et al. Citation1994). However, potential for increased losses of nitrate-nitrogen and overall water yield exist, where subsurface drainage is implemented (Skaggs et al. Citation1994). Many studies have concluded that drainage design and management practices hold great potential for minimizing unwanted environmental effects associated with subsurface drainage systems (Dinnes et al. Citation2002; Skaggs et al. Citation2005, Citation2006; Skaggs Citation2007; Sands et al. Citation2008; Thorp et al. Citation2008).
Installation of new drainage systems and the augmentation or replacement of old drainage systems continues at a rapid pace in the northern Corn Belt. In Minnesota and elsewhere in the region, the approach to design for new drainage systems has changed little since the mid-1900s, while installation methods have evolved significantly. State drainage guides, if they exist, often lack any significant guidance on either the economics or the environmental effects of drainage design choices (e.g. drain spacing and depth). Producers and contractors have had to resort to developing their own rules-of-thumb for drainage depth and spacing for the soils and locations where they work. What is needed is site-specific design guidance that is based on net return to the producer, but which also allows for the consideration of environmental effects of drainage design choices. This type of information would benefit producers by helping them make drainage investments resulting in maximum returns on investment, while, at the same time, avoid the potential costs and negative consequences associated with over- or under-draining. The methods presented herein were developed to facilitate this type of multiple objective design: maximizing net economic returns, while minimizing deleterious effects of drainage systems. It should also be noted that the valuation of environmental costs associated with artificial drainage systems is complex in its own right and beyond the scope of this work.
Computer modeling is a useful technique to estimate the economic and environmental effects of drainage design choices, and the model, DRAINMOD (Skaggs Citation1978), is particularly well suited for the purpose of multiple-objective design. DRAINMOD was calibrated and validated for drainage practices at Waseca, Minnesota by Luo et al. (Citation2010), who showed that there are potential opportunities to reduce the unwanted effects of agricultural drainage without sacrificing productivity, through prudent drainage design choices.
The objective of this work was to develop a modeling based tool to facilitate consideration of both profitability and environmental impact during subsurface drainage design, by expanding on the work conducted by Luo et al. (Citation2010) in Minnesota, USA.
Methods
A simulation approach was used to evaluate an optimum drainage design approach for Minnesota. Computer model inputs were developed for six soils and three locations in southern Minnesota. This paper presents the optimum design techniques using a single, representative soil at one location. Assessing the differences among soils and locations is the beyond the scope of this paper.
The DRAINMOD model
The field hydrology model, DRAINMOD (Skaggs Citation1978), has been used to predict the effects of drainage design and management on hydrology and crop yield for over two decades. DRAINMOD computes infiltration, surface runoff, subsurface drainage, deep seepage, and water table depth on a daily basis for a point midway between two subsurface drains. The model also estimates annual relative yield for a crop using a stress-day approach, considering the effects of planting delay, wet and drought stresses and salinity, on yield reduction. Soil freeze/thaw and snow accumulation and snowmelt capabilities were subsequently added to DRAINMOD (Luo et al. Citation2000, Citation2001). These developments increased the applicability of the model (e.g. Sands Citation2003) in the northern Corn Belt, where these processes routinely occur.
Luo et al. (Citation2010) conducted calibration and validation of DRAINMOD for the Webster silty clay loam (typic Endoaquolls) for the south-central Minnesota city of Waseca. The parameters from this calibration were used as foundational values for this study.
Soil selection, sampling, and testing
We envisioned a drainage design planning tool applicable for major soils of southern Minnesota. To this end, a comprehensive search for major soil series and map units was conducted for southern Minnesota, where most artificially drained agricultural land exists. Soil occurrence and physical characteristic data were obtained from the National Soil Database made available by the Natural Resource and Conservation Service. The following soils were included in the study: Canisteo, Webster, Okoboji, Nicollet, Normania, and Harps, representing over 800,000 ha in southern Minnesota. These soils are generally silty clay loams to clay loams, and are ubiquitous in the landscape of southern Minnesota. Replicated samples were obtained for these six soils from locations in southern Minnesota.
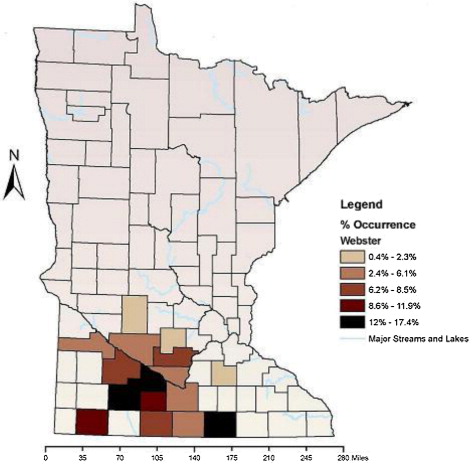
Laboratory tests were conducted on these soils at the University of Minnesota, Saint Paul Campus. Basic physical properties, such as texture and pH, were conducted at the Research Analytical Laboratory at the University of Minnesota. Additional tests, such as soil water retention and bulk density, were conducted in the Soils Lab of the Department of Bioproducts and Biosystems Engineering. These soil properties were required as inputs to the Rosetta (Schaap Citation2000) and DRAINMOD models. The Rosetta model, a pedotransfer model for developing soil parameters, was developed at the US Salinity Laboratory (ARS-USDA), and has been widely used both in the USA (Hawsa et al. Citation2005; Nolan et al. Citation2007) and abroad (Huang et al. Citation2006; Suleiman Citation2008; Salazar Citation2009). Water content was determined using pressure plates at 1/10 bar, 1/3 bar (field capacity), 3 bar, 6 bar, and 15 bar (permanent wilting point). Data from these tests were used with the Rosetta model/van Genuchten equation (van Genuchten Citation1980), to construct water retention curves and estimate saturated hydraulic conductivity for input to the model. The statewide occurrence of the Webster soil in Minnesota, used to illustrate our approach, is displayed in .
DRAINMOD simulations
The DRAINMOD simulation model was used in this project to evaluate the efficacy of various drainage designs (i.e. drain depth and spacing). The location selected to represent the Minnesota River Basin was Waseca. DRAINMOD input files (crop, soil, and weather) were created and are described in previous work (Luo et al. Citation2010). Weather files were created with available rainfall and temperature data, and potential evapotranspiration estimated using the Hargreaves-Samani method (Samani Citation2000). For this exercise, a continuous corn crop was assumed.
Long-term (90-year) simulations were conducted using five drain spacings (23, 29, 35, 40, and 46 m) and four drainage depths (90, 105, 120, and 135 cm), and undrained conditions. The drainage depth and spacing combinations were selected to provide a range of drainage coefficients (Sands Citation2003), or discharge rates, from 3.2 to 19 mm/day. These drainage coefficients bracket the typical drainage coefficients and drainage depths used in the region (13 mm/day). The required drain spacings were unique for each soil, but the drainage depths were consistent across all soil types. The deepest/narrowest depth/spacing combination corresponded to 19 mm/day and the shallowest/widest combination corresponded to the 3.2 mm/day drainage coefficient, for all soils. In this way, the array of combinations is bracketed by these two drainage coefficients. Model results for Waseca, Minnesota, and for the Webster soils, are presented and discussed, herein.
Profitability and environmental indices
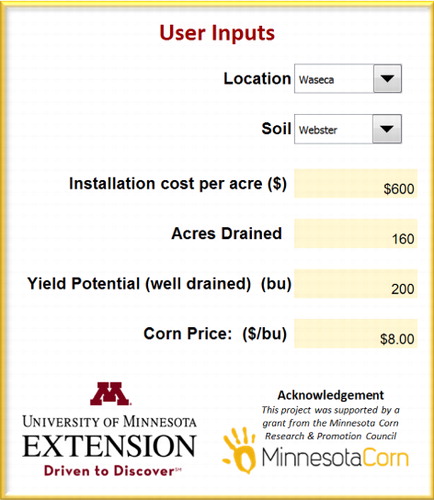
DRAINMOD outputs were used to create “performance indices” such that yield impact, profitability, drainage, and surface runoff volume could be considered and compared together when choosing drain depth and spacing. A spreadsheet design tool was developed to display these indexes, based on a few simple user inputs, as shown in . The user provides the general inputs, and these indices are then computed for all drainage spacing-depth combinations based on previously obtained model outputs.
Drainage system costs for various drainage design scenarios were a mixture of user input (initial cost per unit area) and scale factors to approximate the increase in cost for narrower and deeper drainage systems. Initial costs per unit area are input by the user and represent the base cost for the widest drain spacing and shallowest drain depth. Cost scale factors that increased cost for narrower and deeper drainage systems were developed based on interviews with several drainage contractors in Minnesota, USA. Narrower drain spacing and deeper drain depth result in higher system initial costs but not on a linear basis. The drain spacing scale factor provided for an approximate 60% increase in cost from the widest to the narrowest drain spacing. The drain depth scale factor, which represents additional power and labor requirements for deeper drainage systems, increased the cost at approximately 1% per 15-cm increase in drainage depth. While it is recognized that systems costs are highly site-specific, these scale factors provide a reasonable way to represent installation and material cost increases, based on the user input cost per area.
Estimated costs and modeled yield benefits were applied over a 15-year time period for the purposes of computing the internal rate of return (IRR), used as a measure by which to compare the profitability of various drainage design combinations (drain spacing and depth combinations). IRR (Gronchi Citation1986) can be defined as the condition, where for a sum of investments and revenues (a0,…,an), an interest rate, r, can be defined such that:
The IRR was computed for each spacing-depth combination using the simulated average annual crop yield increase and system costs based on user inputs. The quantity, a0, represents the initial cost of the drainage system, as described above. The vector, aj (j = 1, n), represents the annual revenues due to crop yield increase (or decrease), compared to the undrained scenario, and n, the life of investment. Annual revenue was computed by the following (units indicated within brackets): % yield change × potential yield [vol/unit area] × crop price [$/vol] × land area drained [area]. The % yield change was computed by the model based on the difference between drained and undrained yields; the other parameters are user inputs.
Simulated average annual drainage volume and surface runoff were used to represent environmental response by which to compare drainage system design. For the soils studied, reduced drainage generally results in increased long-term mean surface runoff, which is considered to be less desirable. Alternatively, increases in subsurface drainage design drainage rates result in higher long-term mean subsurface drainage volumes and commensurate increases in nitrate-nitrogen losses to surface waters, and is also, considered to be less desirable.
Drainage design relative “performance” indices were created by standardizing crop yield response, IRR, drainage and surface runoff depth values, by dividing by the smallest values among all drainage combinations for the particular output of choice. In the formulation of the indices, the smallest value for any particular index takes on a value of 1.0 and all other values represent a fractional increase from the base value. Standardization of the output parameters was an important step because what is critical is the relative difference between one drain spacing × depth combination and another, and making choices of one combination, relative to another. Moreover, the standardization step was a way to make the performance outputs dimensionless, enabling the comparison of disparate criteria (e.g. profitability vs. drainage volume). For the yield and profitability indices, larger values of the index are more preferable. For the environmental indices, larger values are considered to be less desirable.
Results and discussion
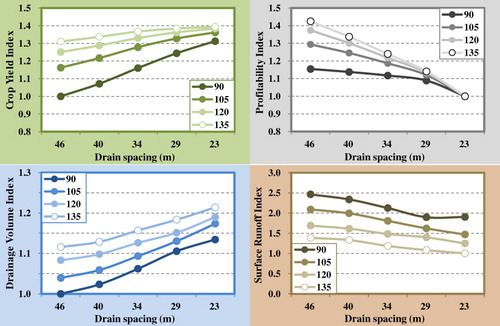
displays a basic set of model outputs and the IRR computed for the Webster soil at Waseca. Relative crop yield varied from 43% for the undrained scenario to 99% for the 23-m drain spacing and 135-cm drain depth (the largest drainage coefficient simulated). The IRR displayed in ranges from a value of 1.3 to 1.84. Deeper systems appeared to be more profitable (higher drainage coefficient achieved with less drainage investment) as well as wider-spaced drainage systems.
Table 1. Primary DRAINMOD outputs for the Webster soil with various drain spacings and depths.
Mean annual precipitation for the 90-yr simulation period was 780 mm. Mean (90-yr mean) annual drainage volumes for the Webster soil at Waseca ranged from 12 to 15 cm (15–20% of long-term mean precipitation) from the smallest to the largest drainage coefficients (). Predicted 90-yr mean annual surface runoff varied inversely with mean annual drainage volume, and ranged from 1.5 to 3.6 cm, from the largest to the smallest drainage coefficients, respectively ().
The model outputs and computed values in , were converted to performance indices, which are displayed in . We can draw some important relative information from . Namely, the highest crop yield is 39% greater than the lowest. The highest profitability is 42% greater than the lowest, but does not correspond to the scenario where crop yield is the largest. Additionally, there is a 21% increase in mean annual drainage volume and a 2.5-fold increase in mean annual runoff volume, among the range of drainage scenarios simulated.
Table 2. Four performance indices for the Webster soil with various drain spacings and depths.
The goal of optimal drainage design as proposed herein is to attempt to increase profitability while, at the same time, decrease unwanted environmental effects. The performance indices shown in present the drainage designer with several interesting challenges. If one attempts to select drain depth and spacing to increase the profitability index, the drainage volume index decreases, which is a favorable situation. However, the greatest profitability does not occur where the drainage volume index is at its smallest value. For the surface runoff index, the challenge is that almost any increase in profitability comes at the expense of greater surface runoff. Thus, an optimum selection of drainage depth and spacing should either look for gains in profitability where less than commensurate environmental effects occur (or are in fact, reduced), or conversely, seek to reduce environmental effects where impacts on profitability are small. Even with the indices presented in , selection of an optimum drainage depth and spacing is not an altogether straightforward task.
We considered two objective functions that combine the performance indices, as a means of simplifying the information conveyed by the indices to guide the designer. First, we considered the index obtained by dividing the profitability index by the drainage volume index, or:
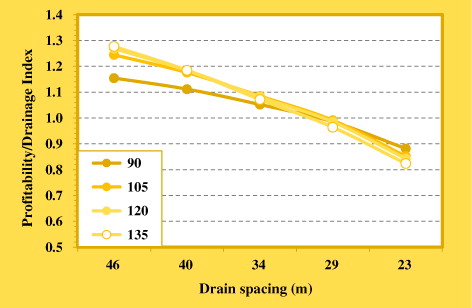
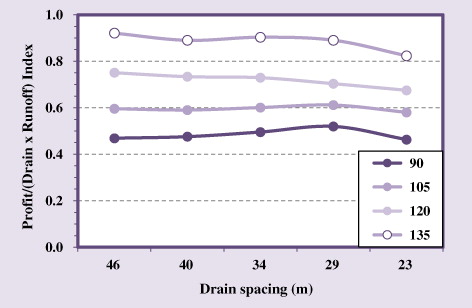
The values for this index for the Webster soil at Waseca are visualized in . The value of Index 1 increases when profitability increases, drainage volume decreases, or some combination of these two. From , we see that the value of the index is approximately the same for all drainage depths and spacings, up through 35-m drain spacing. As drain spacing increases beyond 35 m, Index 1 values for the 90-cm drain depth taper off. The deeper drain depths appear to perform similarly as spacing increases. At the largest drain spacing, the deepest drain depth exhibits the largest value of Index 1. The use of Index 1 would suggest that one may be justified in choosing any value of Index 1 that is greater than any other value of the index, because either profitability or environmental effects would be moving in the desired direction.
We then constructed another index to also incorporate the effects of drainage on surface runoff as follows:
Reductions in either runoff or drainage will cause Index 2 to increase, as will increases in profitability. However, because surface runoff and subsurface drainage tend to be negatively correlated on artificially drained soils, the behavior of Index 2 will reflect the environmental variable exhibiting the largest change. displays the values of Index 2 for the Webster soil at Waseca. The flatness of the curve illustrates the effect of the negative correlation between drainage volume and surface runoff. If one wished to include both drainage and surface runoff as drainage design objectives, Index 2 suggests that drainage depth is primary parameter to consider in minimizing the effects of surface runoff and drainage volume, with drain spacing being of lessor importance (but wider spacing is slightly more favorable).
The result of the application of the indices presented herein lead to design choices of deeper drainage depth and greater drain spacing (for the Webster soil at Waseca). The resulting drainage system (e.g. 46-m spacing and 135-ctam depth) is the most profitable system, based on the IRR methods employed herein, but is not the drainage system which exhibits the lowest drainage volume or surface runoff volume. However, the performance indices illustrate that choosing a drainage depth/spacing to reduce either drainage or runoff volume further, would result in a greater than commensurate reduction of profitability for the resulting system. Hence, one could argue that the 46-m by 135-cm system is the most reasonable compromise of profitability and environmental effects.
Acknowledgment
The authors wish to thank the Minnesota Corn Research and Promotion Council for funding this work.
Disclosure statement
No potential conflict of interest was reported by the authors.
References
- Dinnes DL, Karlen DL, Jaynes DB, Kaspar TC, Hatfield JL, Colvin TS, Cambardella CA. 2002. Nitrogen management strategies to reduce nitrate leaching in tile-drained Midwestern soils. Agron J. 94:153–171. 10.2134/agronj2002.0153
- Gronchi S. 1986. On investment criteria based on the Internal rate of return. Oxford Economic Papers, New Series. 38:174–180.
- Hawsa N, Suresh P, Raoa C, Simunekc J, Poyera I. 2005. Single-porosity and dual-porosity modeling of water flow and solute transport in subsurface-drained fields using effective field-scale parameters. J Hyd. 313:257–273. 10.1016/j.jhydrol.2005.03.035
- Huang M, Gallichand J, Dang T, Shao M. 2006. An evaluation of EPIC soil water and yield components in the gully region of Loess Plateau, China. J Agric Sci. 144:339–348. 10.1017/S0021859606006101
- Luo W, Sands GR, Youssef M, Strock JS, Song I, Canelon D. 2010. Modeling the impact of alternative drainage practices in the northern Corn-belt with DRAINMOD-NII. Agric Water Manage. 97:389–398. 10.1016/j.agwat.2009.10.009
- Luo W, Skaggs RW, Cheschier GM. 2000. DRAINMOD modifications for cold conditions. Trans ASAE. 43:1569–1582. 10.13031/2013.3057
- Luo W, Skaggs RW, Madani A, Cizikci S, Mavi A. 2001. Predicting field hydrology in cold conditions with DRAINMOD. Trans ASAE. 44:825–834.
- Nolan B, Healy R, Taber P, Perkins K, Hitt K, Wolock D. 2007. Factors influencing ground-water recharge in the eastern United States. J Hyd. 332:187–205. 10.1016/j.jhydrol.2006.06.029
- Salazar O. 2009. Modeling water discharge and nitrogen loads from drained agricultural land at field and watershed scale [dissertation]. Uppsala: Swedish University of Agricultural Sciences.
- Samani Z. 2000. Estimating solar radiation and evapotranspiration using minimum climatological data. J Irrig Drain Eng. 126:265–267.
- Sands GR. 2003. Drainage coefficient. In Stewart BA, Howell TA, editors. Encyclopedia of water science. New York: Marcel Dekker; p. 118–120.
- Sands GR, Song I, Busman LM, Hansen B. 2008. The effects of subsurface drainage depth and intensity on nitrate loads in the northern cornbelt. Trans ASABE. 51:937–946. 10.13031/2013.24532
- Schaap MG. 2000. ROSETTA model. United States Salinity Laboratory (USSL), ARS-USDA. http://www.ussl.ars.usda.gov/MODELS/rosetta/rosetta.htm
- Skaggs RW. 1978. A water management model for shallow water table soils. Technical Report No. 134. Raleigh, NC: University. of North Carolina Water Resources Res. Inst.
- Skaggs RW. 2007. Criteria for calculating drain spacing and depth. Trans ASABE. 50:1657–1662. 10.13031/2013.23971
- Skaggs RW, Breve MA, Gilliam JW. 1994. Hydrologic and water quality impacts of agricultural drainage. Crit Rev Environ Sci Tech. 24:1–32. 10.1080/10643389409388459
- Skaggs RW, Youssef MA, Chescheir GM. 2006. Drainage design coefficients for eastern United States. Agric Water Manage. 86:40–49.
- Skaggs RW, Youssef MA, Chescheir GM, Gilliam JW. 2005. Effect of drainage intensity on nitrogen losses from drained lands. Trans ASABE. 48:2169–2177. 10.13031/2013.20103
- Suleiman A. 2008. Modeling daily soil water dynamics during vertical drainage using the incoming flow concept. Catena. 73:312–320. 10.1016/j.catena.2007.12.002
- Thorp KR, Jaynes DB, Malone RW. 2008. Simulating the long-term performance of drainage water management across the midwestern United States. Trans ASABE. 51:961–976. 10.13031/2013.24534
- van Genuchten M Th. 1980. A closed-form equation for predicting the hydraulic conductivity of unsaturated soils. Soil Sci Soc Am J. 44:892–898. 10.2136/sssaj1980.03615995004400050002x