
ABSTRACT
Farmers in arid regions often use saline irrigation water because fresh water supplies are limited. A field study was conducted to evaluate the effects of irrigation water salinity and N application rate on soil properties and N2O emission in a drip-irrigated cotton field. The experiment included three levels of irrigation water salinity (0.35, 4.61, or 8.04 dS m−1) and two N application rates (0 or 360 kg N ha−1). The results showed that soil moisture, salinity, and concentrations increased significantly as water salinity increased, whereas soil pH and
concentrations decreased. N2O emissions on the first day, the first two days, and the first three days in the fertilized plots accounted for 19.5–26.3%, 68.1–70.5%, and 80.6–89.7% of total N2O emissions over the six days, respectively, while the corresponding proportions in the unfertilized plots were 13.5–23.2%, 40.5–51.7%, and 59.5–70.7%, respectively. In the unfertilized plots, N2O emission flux and cumulative N2O emission both increased as water salinity increased. In the fertilized plots, N2O emission rate and cumulative N2O emission were both highest in the 4.61 dS m−1 treatment and lowest in the 0.35 dS m−1 treatment. Correlation analysis showed that soil moisture,
, and
were positively correlated with N2O emission rate. In contrast, soil salinity and pH had no significant correlation with N2O emission rate. Our study demonstrates that irrigation with brackish or saline water (SW) significantly increased N2O emission. To reduce the adverse effects of brackish or SW irrigation on soil N2O emission, farmers should evaluate management practices such as additional irrigation before cultivation in spring, or the alternate use of fresh and SW during irrigation.
Introduction
Nitrous oxide is one of the most important greenhouse gases, having up to 310 times the global warming potential of CO2 over a 100-year time frame (IPCC Citation2007). Nitrous oxide also contributes to the destruction of stratospheric ozone (Montzka et al. Citation2003). Agricultural soils contribute approximately 50% of atmospheric N2O emissions (IPCC Citation2001). This amount is equivalent to a global warming potential of 1.0 Pg C yr−1 (Robertson et al. Citation2004).
Nitrification and denitrification are the two processes responsible for the vast majority of N2O emissions from soil (Robertson & Groffman Citation2007). As substrates for nitrification and denitrification, ammonium-nitrogen and nitrate-nitrogen
have important effects on N2O emission rates (Ellis et al. Citation1998). Field management practices (e.g. irrigation, fertilization, and crop type), climate conditions, and soil characteristics are also reported to affect N2O emissions from agricultural soils (Bond-Lamberty & Thomson Citation2010; Peng et al. Citation2011; Scheer et al. Citation2014).
Soil N2O emissions vary greatly depending on the agricultural system. For example, N2O emissions ranged from 0.2% to 0.3% of fertilizer N in rainfed maize fields in northeast China (Ni et al. Citation2012). In comparison, N2O emissions accounted for 0.4–2.6% of fertilizer N from irrigated cotton (Gossypium hirsutum L.) fields in Australia (Scheer et al. Citation2008). Irrigation has significant influence on N2O emissions. Irrigation management, which affects both soil water dynamics and microbial C and N turnover, has the potential to affect the exchange of greenhouse gasses between the biosphere and the atmosphere (Holst et al. Citation2008). Scheer et al. (Citation2012) reported that N2O fluxes were, respectively, 72% and 67% less in medium and low irrigation treatments than in a high irrigation treatment in a wheat field. Jiao et al. (Citation2006) reported that intermittent irrigation increased total growing-season N2O emissions by 24% compared with continuous flood irrigation in a rice system.
Fertilizer N is essential for increasing crop yields, and it can have significant impact on N2O emission (Bouwman et al. Citation2002). Generally, there is a linear relationship between N2O emission and N application rate in agricultural soils (Hoogendoorn et al. Citation2008). However, McSwiney and Robertson (Citation2005) observed nonlinear increases in N2O emission across a nine-point fertilizer gradient (0, 34, 67, 101, 134, 168, 202, 246, and 291 kg N ha−1) in Michigan over a three-year period for continuous corn (Zea mays L.). The authors observed that N2O emission increased as N fertilizer increased from 0 to 101 kg N ha−1, declined somewhat at rates of 168 and 202 kg N ha−1, and then increased again at rates of 246 and 291 kg N ha−1. The relationship between N fertilizer rate and N2O emission is complicated by factors that affect soil N saturation such as C availability and soil C/N ratio (Matzner & Borken Citation2008).
Farmers often use poor quality water for irrigation in Xinjiang Province in northwest China. In this region, saline water (SW) is increasingly used for drip irrigation of cotton, a highly salt tolerant plant (Chen et al. Citation2010). Drip irrigation is highly efficient because the application of water and N fertilizer can be controlled to meet the requirements of the crop at each physiological growth stage (Mohammad Citation2004). The concentrations of Na+ and Cl− in SW are high, making it different than ordinary fresh water (FW). SW irrigation may cause an accumulation of soluble salts in agricultural soils (Zartman & Gichuru Citation1984). The electrical conductivity (EC) and the water-holding capacity of soil increase with the increasing salinity of irrigation water (Tedeschi & Dell’Aquila Citation2005; Huang et al. Citation2011). Accumulation of soluble salts negatively affects the mineralization and nitrification processes of the N cycle and may also affect the production of N2O in soils (Adviento-Borbe et al. Citation2006; Reddy & Crohn Citation2014). There are conflicting reports about the effect of salt concentrations on N dynamics in relation to N2O emission (Dalal et al. Citation2003). Inubushi et al. (Citation1999) reported that salt concentration had no significant effect on N2O emission. However, other studies showed that increases in salt concentration significantly stimulated N2O emission (Tsuneda et al. Citation2005; Reddy & Crohn Citation2014; Kong Citation2015). Other researchers observed that the effect of salt on N2O emission varies depending on salt concentration. For example, Shang et al. (Citation2009) reported no significant change in N2O production as water salinity increased from 2.5 to 7.5 g L−1; however, there was a large increase in N2O production when water salinity increased from 7.5 to 10 g L−1. Some researchers (Azam & Müller Citation2003; Adviento-Borbe et al. Citation2006; Zeng et al. Citation2013) have reported that environmental conditions affect the relationship between salt concentration and N2O emission. For example, Azam and Müller (Citation2003) demonstrated that N2O emissions decreased as salt concentrations increased under dry soil conditions (20%, w/w), but the opposite pattern was observed under moist conditions (40%, w/w).
The purposes of this study were (i) to investigate the effect of irrigation water salinity and N application rate on soil physicochemical properties and N2O emissions, and (ii) to determine the interactive effects of SW irrigation and N fertigation on N2O emissions in a drip-irrigated cotton production system.
Materials and methods
Study site
The field experiment was conducted during the 2014 growing season at the Shihezi University Experiment Station, Xinjiang, China (44°18′N, 86°02′E). The region is classified as a temperate arid zone with a continental climate. Average daily temperatures during the observation period (June–August 2014) ranged from 12.8°C to 31.7°C and total precipitation was 40.1 mm. The mean soil temperature (5 cm depth) ranged from 17.9°C to 28.7°C, with an average of 23.3°C. The soil in the study area is classified as a Calcaric Fluvisol (i.e. alluvial, gray desert soil). The experimental field used for this study has been irrigated with SW since 2009. The experimental design included two saline irrigation treatments (EC of water: 4.61 and 8.04 dS m−1) plus a non-salinized control (EC of water: 0.35 dS m−1). The crop was continuous cotton (Gossypium hirsutum L.). At the beginning of the 2009 season, soil samples taken at 0–0.2 m soil depth. Physical and chemical properties of the soil were as follows: pH, 7.9; organic matter, 16.8 g kg−1; total N, 1.1 g kg−1; available P, 25.9 mg kg−1; available K, 253 mg kg−1.
Experimental design and treatments
The experimental design was a 3 × 2 factorial design with three salinity levels of irrigation water and two N application rates. The irrigation water salinity and nitrogen fertilizer application rate were the same as in the previous experiment in all plots both years. The irrigation water salinities were 0.35, 4.61, or 8.04 dS m−1 (referred to as FW, brackish water (BW) or SW, respectively). The N fertigation rates were either 0 or 360 kg N ha−1 (abbreviated N0 and N360, respectively). The 360 kg N ha−1 rate is commonly used by local farmers. The saline irrigation water was prepared using equal amounts of NaCl and CaCl2.
The treatments were arranged in completely randomized block design with three replications for each treatment. In each plot, there were two 1.2 m × 16 m, with a 0.6-m separation distance (). Four rows of cotton plants were planted in each bed, with a row space of 0.3 m (inner-row) or 0.6 m (inter-row) and the soil surface was covered with plastic film. The irrigation drip line was installed in inner-row under the plastic film. Cotton (Gossypium hirsutum L., cv. Xinluzao 48) was planted on 29 April 2014. The cotton plants were sown at 0.1-m intervals within each row to obtain a population of 22,000 plants ha−1. Water was applied by drip irrigation at a rate of 2.7 L/h per emitter and the drippers were 0.4 m apart. The plots were drip-irrigated with 30 mm FW after sowing to improve germination and seedling establishment. During the cotton growing season, 450 mm water was applied to all treatments through the drip-irrigation system. The plots were irrigated eight times and each irrigation event lasted two days. The irrigation amount and frequency were consistent with the schedule of local farmers used for FW-irrigated cotton fields in the area (). The plots were all irrigated on the same dates and with equal watering depths. The amount of water applied to each plot was controlled using a water meter. Triple super phosphate (105 kg P2O5 ha−1) and potassium sulfate (60 kg K2O ha−1) were applied at sowing. The N fertilizer was applied with irrigation through the drip-irrigation system. The fertilizer was applied in five equal amounts on 22 June, 30 June, 9 July, 17 July and 2 August (). The N fertilizer (urea) solution was kept in a 15-L plastic container and pumped into the irrigation system.
Figure 1. Layout of the experimental plot (inner-row and inter-row) and location of the chambers.
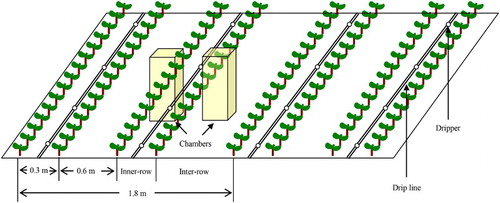
Table 1. The amounts of irrigation water, N fertilizer application rates, and dates of N2O sampling under three water salinity treatments in field experiment (2014).
N2O sampling and analysis
The N2O gas samples were collected using a static closed chamber technique (Mosier & Hutchinson Citation1981). The volume of the chambers was 0.11 m3 (0.53 m length × 0.23 m width × 0.90 m height). The chambers were covered with tinfoil to slow the temperature rise and equipped with two internal battery-operated fans to mix the air. The chambers were also equipped with a small, silicone-sealed vent for sampling and another vent for measuring chamber temperature. The chambers were placed synchronously in both inner-row and inter-row for each experimental plot (). The average N2O flux emitted from the inner-row and inter-row was considered as the statistical value for each plot. A stainless steel base was permanently inserted to a depth of 5 cm into the soil before sampling. On each sampling date, a stainless steel sampling chamber was put into the groove in each chamber base, and the groove was sealed with distilled water.
Soil N2O sampling was conducted at one day intervals in the first six days (24–29 June) after N fertigation (the N fertilizer was applied with irrigation through the drip-irrigation system), and then at eight day intervals in the other periods (30 June–13 August) (Li et al. Citation2015). The dates of N2O sampling are shown in . Gas sampling was carried out from 09:00 to 11:00 every day. All measurements lasted for 30 min, and gas samples were extracted from each chamber 0, 10, 20, and 30 min after capping. About 200 mL of gas was extracted from the chamber with a syringe at each sampling time. The gas samples were then transferred to polyethylene-coated aluminum gas bags (Guangming Research & Design Institute of Chemical Industry, Dalian, China). The N2O concentration in the gas samples was measured in a laboratory using an HP5890 gas chromatograph (Agilent Technologies, Palo Alto, America) fitted with an electron capture detector. The N2O emission rate and the cumulative N2O emission were calculated according to the methods of Guo et al. (Citation2013).
Soil physical and chemical analyses
Soils samples (0–0.2 m depth) were collected with a soil auger on the same dates that we collected N2O samples. Soil mineral N, soil pH, soil salinity, and soil moisture were measured daily in the first six days after N fertigation (24–29 June), and then at eight day intervals in the other periods (30 June–13 August). The soil moisture (i.e. gravimetric water content) was measured by drying the soil at 105°C for 24 h. The EC of the soil was measured using a conductivity meter with 1:5 soil:water extracts (EC1:5). Soil pH was measured using a pH meter with 1:2.5 soil:water extracts. Mineral N concentrations were determined by extracting the fresh soil samples for 1 h with 2 M KCl (1:10) and then filtering the extracts through a 0.45 mm membrane. The
concentrations in the extracts were measured using a Smart Chem 140 discreet auto-analyzer (Analytik Jena AG, Jena, Germany).
Data analyses
Statistical analyses were carried out using SPSS statistical software (version 11.5, SPSS Inc, 2003) with two-way analysis of variance (ANOVA) at a significance level of 0.05. Water salinity and N were the independent variables. A Duncan multiple range test was carried out to determine if significant (p < .05) differences occurred between individual treatments.
Results
Soil moisture
Variations in soil moisture content (0–0.2 m depth) in the first six days after N fertigation (24–29 June) are shown in . Averaged across the six days, soil moisture contents were significantly lower in the N0 plots (FW, 17.1%; BW, 17.8%; SW, 18.2%) than in the N360 plots (FW, 18.2%; BW, 18.7%; SW, 18.8%). The variability in soil moisture was greater between the N0 and N360 plots (0.6–1.1%) than between the salinity treatments at each fertilization level (1.1% at N0 and 0.6% at N360). There appears to be a compounded effect of N treatment and salinity. Soil moisture content did not increase as much in the N360 plots as in the N0 plots.
Figure 2. Changes in soil moisture during one irrigation cycle from 24 June to 29 June (irrigation and N fertigation on 22–23 June). Abbreviations: FW (0.35 dS m−1), BW (4.61 dS m−1), SW (8.04 dS m−1), N0 (unfertilized), and N360 (360 kg N ha−1). Values are the mean of three replicates. Error bars represent SD.
The effects of water salinity and N rate on soil moisture across the whole observation period (i.e. 18 June–13 August) are summarized in . In the N0 plots, the average soil moisture content increased from 17.9% in FW to 18.5% in BW and 18.9% in SW. In the N360 plots, the average soil moisture content increased from 18.6% in FW to 18.9% in BW and 19.3% in SW.
Figure 3. Soil moisture content across the growing season (18 June–13 August) as affected by irrigation and N fertigation. Abbreviations: FW (0.35 dS m−1), BW (4.61 dS m−1), SW (8.04 dS m−1), N0 (unfertilized), and N360 (360 kg N ha−1). Values are the mean of three replicates. Error bars represent SD. Solid arrows indicate fertigation events. Dashed arrows indicate irrigation events.
Soil salinity
Variations in soil salinity (0–0.2 m salinity) in the first six days after N fertigation (24–29 June) are shown in . Averaged across both N treatments, soil salinities were 232% greater in BW and 320% greater in SW than in FW. Averaged across all three water salinities, soil salinity was 10% greater in the N360 plots than in the N0 plots.
Figure 4. Changes in soil salinity (EC) during one irrigation cycle from 24 June to 29 June (irrigation and N fertigation on 22–23 June). Abbreviations: FW (0.35 dS m−1), BW (4.61 dS m−1), SW (8.04 dS m−1), N0 (unfertilized), and N360 (360 kg N ha−1). Values are the mean of three replicates. Error bars represent SD.
The effects of water salinity and N rate on soil salinity across the whole observation period (18 June–13 August) are summarized in . Soil salinity generally increased with time in both BW and SW. In contrast, there was little change in soil salinity in FW. The average soil salinity was greatest in SW, being 30% higher than that in BW and 465% higher than that in FW. Averaged across all three water salinities, soil salinity was significantly greater by 5.2% in the N360 plots than in the N0 plots (p < .05).
Figure 5. Soil salinity (EC) across the growing season (18 June to 13 August) as affected by irrigation and N fertigation. Abbreviations: FW (0.35 dS m−1), BW (4.61 dS m−1), SW (8.04 dS m−1), N0 (unfertilized), and N360 (360 kg N ha−1). Values are the mean of three replicates. Error bars represent SD. Solid arrows indicate fertigation events. Dashed arrows indicate irrigation events.
Soil pH
Soil pH ranged from 7.60 to 8.52 in the first six days (24–29 June) after N fertigation (). In general, soil pH was lowest in SW, being 3.0% less than FW and 2.9% less than BW. Averaged across all three water salinities, soil pH was 1.9% lower in the N360 plots than in the N0 plots, but there was no significant difference between the N0 and N360 treatments (p > .05).
Figure 6. Changes in soil pH during one irrigation cycle from 24 June to 29 June (irrigation and N fertigation on 22–23 June). Abbreviations: FW (0.35 dS m−1), BW (4.61 dS m−1), SW (8.04 dS m−1), N0 (unfertilized), and N360 (360 kg N ha−1). Values are the mean of three replicates. Error bars represent SD.
Soil pH varied from 7.72 to 8.36 across the entire observation period (). In general, soil pH was highest in FW and lowest in SW. The N application rate had no significant effect on soil pH.
Figure 7. Soil pH across the growing season (18 June to 13 August) as affected by irrigation and N fertigation. Abbreviations: FW (0.35 dS m−1), BW (4.61 dS m−1), SW (8.04 dS m−1), N0 (unfertilized), and N360 (360 kg N ha−1). Values are the mean of three replicates. Error bars represent SD. Solid arrows indicate fertigation events. Dashed arrows indicate irrigation events.
Soil  and
and
Soil concentrations in the N0 plots remained stable during the first six days after N fertigation (24–29 June). In contrast,
concentrations in the N360 plots decreased rapidly (). Averaged across all three water salinities,
concentrations were 140% greater in the N360 plots than in the N0 plots. Soil
concentrations were also significantly affected by irrigation water salinity in both unfertilized and fertilized plots. Averaged across N0 and N360,
concentrations in FW were 8.9% less than in BW and 19.1% less than in SW.
Figure 8. Changes in soil and
concentrations during one irrigation cycle from 24 June to 29 June (irrigation and N fertigation on 22–23 June). Abbreviations: FW (0.35 dS m−1), BW (4.61 dS m−1), SW (8.04 dS m−1), N0 (unfertilized), and N360 (360 kg N ha−1). Values are the mean of three replicates. Error bars represent SD.
The changes in soil concentrations in the first six days after N fertigation (24–29 June) were similar to those described above for
, except that soil
concentrations in the N360 plots reached a maximum on day 2 of the irrigation cycle and then decreased rapidly with time. Soil
concentrations were significantly higher by 192% in the N360 plots than in the N0 plots. Irrigation water salinity also significantly affected
concentrations. In the N0 plots,
concentrations were 20.3% greater in FW than in SW. There was no significant difference in
concentration between BW and FW. In the N360 plots,
concentration decreased significantly as irrigation water salinity increased. The
concentration in FW was 10.5% higher than in BW and 25.6% higher than in SW.
Variations in soil and
concentrations across the growing season are shown in . Nitrogen application significantly increased
and
concentrations. Averaged across all three water salinity treatments,
concentrations were 124% greater in the N360 plots than in the N0 plots. Soil
concentrations were 209% higher in the N360 plots than in the N0 plots. Irrigation water salinity had a significant effect on both
and
concentration. In the N0 plots, no significant differences in
and
concentrations were observed among the three irrigation water salinity treatments. In contrast,
concentration in the N360 plots increased significantly in the order FW < BW < SW. Soil
concentrations increased in the order BW, SW < FW.
Figure 9. Soil and
concentrations across the growing season (18 June to 13 August) as affected by irrigation and N fertigation. Abbreviations: FW (0.35 dS m−1), BW (4.61 dS m−1), SW (8.04 dS m−1), N0 (unfertilized), and N360 (360 kg N ha−1). Values are the mean of three replicates. Error bars represent SD. Solid arrows indicate fertigation events. Dashed arrows indicate irrigation events.
N2O emission
Similar temporal trends in soil N2O emission rates for the N360 plots and N0 plots were observed for each treatment during the first six days (24–29 June) after N fertigation (). For different N application rates in the present study, N2O emissions on the first day, the first two days, and the first three days in the N360 plots accounted for 19.5–26.3%, 68.1–70.5%, and 80.6–89.7% of total N2O emissions over the six days, respectively, while the corresponding proportions in the N0 plots were 13.5–23.2%, 40.5–51.7%, and 59.5–70.7%, respectively. Soil N2O emission rates were also significantly affected by water salinity, N0: SW > BW > FW and N360: BW > FW > SW.
Figure 10. Changes in soil N2O emission flux during one irrigation cycle from 24 June to 29 June (irrigation and N fertigation on 22–23 June). Abbreviations: FW (0.35 dS m−1), BW (4.61 dS m−1), SW (8.04 dS m−1), N0 (unfertilized), and N360 (360 kg N ha−1). Values are the mean of three replicates. Error bars represent SD.
The effects of irrigation water salinity and N rate on soil N2O emission rates across the growing season are shown in . The N2O emission rates increased significantly as N application rate increased. On average, N2O emission rates were 169% higher in the N360 plots than in the N0 plots. Irrigation water salinity had significant effects on N2O emission. In the N0 plots, N2O emission rates increased as irrigation water salinity increased. In the N360 plots, N2O emission rates were greatest in BW and least in FW.
Figure 11. Soil N2O emission flux across the growing season (18 June to 13 August) as affected by irrigation and N fertigation. Abbreviations: FW (0.35 dS m−1), BW (4.61 dS m−1), SW (8.04 dS m−1), N0 (unfertilized), and N360 (360 kg N ha−1). Values are the mean of three replicates. Error bars represent SD. Solid arrows indicate fertigation events. Dashed arrows indicate irrigation events.
Correlation analyses were conducted to determine the relationship between the soil properties and N2O emission rate (). Soil salinity were positively correlated with soil moisture, concentration, and
concentration, but negatively correlated with soil pH. Soil N2O emission rate had a significant positive relationship with soil moisture,
concentration, and
concentration. Soil salinity and pH (7.5–8.5) had no significant relationship with N2O emission rate.
Table 2. Correlation between soil N2O emission rate and selected soil properties (n = 72).
Cumulative N2O emission
The cumulative N2O emission during the observation period in different treatments ranged from 0.13 to 0.41 kg ha−1 (). In general, cumulative N2O emission increased sharply as the N application rate increased. Averaged across all three water salinities, the cumulative N2O emission was 173% greater in the N360 plots than in the N0 plots. Cumulative N2O emission was significantly affected by water salinity, N rate, and salinity × N interaction (p < .001). In the N0 plots, cumulative N2O emission increased as water salinity increased; however, the differences between BW and SW were not significant. In the N360 plots, the cumulative N2O emission was highest in BW and lowest in FW.
Figure 12. Effects of irrigation water salinity and N rate on cumulative N2O emission. Error bars indicate the standard error of the mean (n = 3). Bars with different letters are significantly different at p < .05 (Duncan's Least significant difference test).
Discussion
Soil properties in the first few centimeters nearest the soil surface significantly affect gas emissions by influencing gas production and diffusion (Ball et al. Citation1997). Among them, salinity is an important factor affecting gas production by influencing soil microbial activity (Tsuneda et al. Citation2005; Moussa et al. Citation2006). Many researchers have reported on the interaction between salt concentration and soil microbial activity. Investigations have shown that saline conditions broadly suppress soil microbial communities and their biochemical activities (Rietz & Haynes Citation2003; Yuan et al. Citation2007). Decreases in abundance and diversity of nitrifier and denitrifier with increasing salt concentrations are well documented (Yoshie et al. Citation2004; Bernhard et al. Citation2005).
Salinity not only affects the activity of the soil microbial activity, but also changes the soil moisture. In our study, soil moisture contents tended to increase as irrigation water salinity increased from 0.35 to 8.04 dS m−1 ( and ). Similarly, Min et al. (Citation2014) observed that soil water content increased as the salinity of the irrigation water increased. This suggests that both brackish and SW irrigation can increase soil moisture in the root zone, mainly because evapotranspiration rates are lower for SW than for FW (Malash et al. Citation2008). Water salinity and N rate affects soil moisture as well as N2O emission. One study showed N2O emission can be significantly affected by small changes in soil moisture (Smith et al. Citation2003). Increases in soil moisture reduce O2 concentrations, thus inducing nitrifier denitrification and denitrification (Silva et al. Citation2008). Our correlation analysis indicated that soil moisture was significantly and positively correlated with N2O emission rate (). This is similar to the observation of Wang and Cai (Citation2008), who reported that N2O production in soil increased slightly with an increase in soil moisture from 40% to 70% of saturated water content. Furthermore, Kiese and Butterbach-Bahl (Citation2002) also demonstrated that N2O emissions were positively correlated with soil moisture content.
Soil pH affects N2O emissions by altering N transformations and microbial communities (Bäckman et al. Citation2003; Nicol et al. Citation2008). In a recent study about the effect of pH on N2O emission, Law et al. (Citation2011) observed that the N2O emission rate of an enriched ammonia-oxidizing bacteria culture was pH dependent. This was most likely due to the effect of pH on the ammonia oxidation rate. This is important for N2O emissions because ammonia oxidation is the rate-limiting step, providing substrate for denitrification. In this study, soil pH (7.5–8.5) decreased as both irrigation water salinity and N application rate increased ( and ). Our results agree with observations that soil pH decreased as soil salt concentrations increased, mainly due to the accumulation of strong acidic ions (e.g. and Cl−) in salinized soil (Fan et al. Citation2009). However, there was no significant correlation between soil pH and N2O emission (). This suggests that N2O emission is not sensitive to soil pH within the range of 7.5–8.5. This is important because nitrifying bacteria are known to have a narrow optimal range between pH 7.5 and 8.6. A previous study also showed that the optimum pH for long-term denitrification was between 6.6 and 8.3 (Šimek et al. Citation2002).
Soil mineral N ( and
) is the most important factor influencing N2O emission. Salinity affects mineral N concentration as well as N2O emission. Inubushi et al. (Citation1999) reported that at high salt levels and 45% soil water-holding capacity,
concentration tended to increase or remain the same across time. In contrast,
concentrations tended to decrease. This indicated that nitrification was inhibited at high salt concentration. Total N2O emission was positively correlated with nitrification rate as calculated by the increase in soil
concentration. Our results indicated that soil
concentrations increased as irrigation water salinity increased ( and ). This result supports the idea that nitrification is inhibited by high water salinity, allowing
to accumulate in soil (Akhtar et al. Citation2012). Our observations are similar to those of Irshad et al. (Citation2005) who reported significantly greater
concentrations in salt-affected soil than in normal soil. In contrast, irrigation water salinity significantly decreased
concentrations ( and ). Lodhi et al. (Citation2009) also observed that the amount of
decreased as soil salinity increased under different temperature and moisture regimes. One explanation is that organic matter decomposition was inhibited by increasing soil salinity, causing a substantial decline in potentially mineralizable N (Rietz & Haynes Citation2003). Soil
and
concentrations were significantly and positively correlated with N2O emission when soil moisture content was 50–60% of field capacity (). This suggests that in this study, nitrification and denitrification had equally important roles in N2O emission. Pihlatie et al. (2004) also observed that nitrification and denitrification made similar contributions to N2O emission in loamy sand soils with 60–100% water-filled pore space.
Our results also showed that irrigation with brackish and SW can cause salt accumulation in the soil surface, soil salinity increased as irrigation water salinity increased ( and ). This is in agreement with earlier findings that brackish or SW irrigation could increase soil salinity (Ahmed et al. Citation2012; Min et al. Citation2014). Soil salinity increased may also lead to the change of N2O emission. In this study, both N2O emission flux and cumulative N2O emission were highest in BW and lowest in FW (, and ). A trend of increased N2O emission with increasing soil salinity was similar to that observed by Ruiz-Romero et al. (Citation2009) who reported elevated N2O emission in soil with ECe 56 dS m−1 compared to 12 dS m−1. In addition, Craft et al. (Citation2009) demonstrated that potential denitrification rates decreased as one moved from tidal freshwater marshes (102 ng g−1 h−1) to salt marshes (21 ng g−1 h−1) in southeastern Georgia. In grassland soil, amendment with 0.2 mol L−1 KCl increased cumulative N2O emission to 1442 μg N kg−1 compared with 40 μg N kg−1 in an unamended control (Cheng et al. Citation2013). However, amendment with 0.4 mol L−1 KCl reduced cumulative N2O emission to 40 μg N kg−1 or less. Salinity affects normal N transformations in soil by retarding several biological or microbial processes responsible for maintaining the NH4/NO3 balance (Lodhi et al. Citation2009). Soil microbes responsible for transforming to
are negatively affected by elevated salinity, reducing the conversion of
to
(Irshad et al. Citation2005; Kumar et al. Citation2007). Salt also inhibits nitrification, leading to incomplete nitrification and the accumulation of NO2 in soil. The accumulation of NO2 in soil leads to an increase in N2O production. On the other hand, N2O reductase (NOS) is very sensitive to the environment. When salinity is high, nitrite toxicity can inhibit NOS activity, resulting in increased N2O production (Shang et al. Citation2009).
Disclosure statement
No potential conflict of interest was reported by the authors.
Additional information
Funding
References
- Adviento-Borbe MAA, Doran JW, Drijber RA, Dobermann A. 2006. Soil electrical conductivity and water content affect nitrous oxide and carbon dioxide emissions in intensively managed soils. J Environ Qual. 35:1999–2010. doi: 10.2134/jeq2006.0109
- Ahmed CB, Magdich S, Rouina BB, Boukhris M, Abdullah FB. 2012. Saline water irrigation effects on soil salinity distribution and some physiological responses of field grown Chemlali olive. J Environ Manage. 113:538–544. doi: 10.1016/j.jenvman.2012.03.016
- Akhtar M, Hussain F, Ashraf MY, Qureshi TM, Akhter J, Awan AR. 2012. Influence of salinity on nitrogen transformations in soil. Commun Soil Sci Plan. 43:1674–1683. doi: 10.1080/00103624.2012.681738
- Azam F, Müller C. 2003. Effect of sodium chloride on denitrification in glucose amended soil treated with ammonium and nitrate nitrogen. J Plant Nutr Soil Sci. 166:594–600. doi: 10.1002/jpln.200321163
- Bäckman JSK, Hermansson A, Tebbe CC, Lindgren PE. 2003. Liming induces growth of a diverse flora of ammonia-oxidising bacteria in acid spruce forest soil as determined by SSCP and DGGE. Soil Biol Biochem. 35:1337–1347. doi: 10.1016/S0038-0717(03)00213-X
- Ball BC, Horgan GW, Clayton H, Parker JP. 1997. Spatial variability of nitrous oxide fluxes and controlling soil and topographic properties. J Environ Qual. 26:1399–1409. doi: 10.2134/jeq1997.00472425002600050029x
- Bernhard AE, Donn T, Giblin AE, Stahl DA. 2005. Loss of diversity of ammonia-oxidizing bacteria correlates with increasing salinity in an estuary system. Environ Microbiol. 7:1289–1297. doi: 10.1111/j.1462-2920.2005.00808.x
- Bond-Lamberty B, Thomson AM. 2010. Temperature-associated increases in the global soil respiration record. Nature. 464:579–582. doi: 10.1038/nature08930
- Bouwman AF, Boumans LJM, Batjes NH. 2002. Emissions of N2O and NO from fertilized fields: Summary of available measurement data. Global Biogeochem Cycles. 16:6-1–6-13.
- Chen WP, Hou ZA, Wu LS, Liang YC, Wei CZ. 2010. Evaluating salinity distribution in soil irrigated with saline water in arid regions of northwest China. Agric Water Manage. 97:2001–2008. doi: 10.1016/j.agwat.2010.03.008
- Cheng Y, Cai Z, Chang SX, Wang J, Zhang J. 2013. Effects of soil pH and salt on N2O production in adjacent forest and grassland soils in central Alberta, Canada. J Soil Sediment. 13:863–868. doi: 10.1007/s11368-013-0663-9
- Craft C, Clough J, Ehman J, Joye S, Park R, Pennings S, Guo H, Machmuller M. 2009. Forecasting the effects of accelerated sealevel rise on tidal marsh ecosystem services. Frontiers Ecol Environ. 7:73–78. doi: 10.1890/070219
- Dalal RC, Wang W, Robertson GP, Parton WJ. 2003. Nitrous oxide emission from Australian agricultural lands and mitigation options: a review. Soil Res. 41:165–195. doi: 10.1071/SR02064
- Ellis S, Yamulki S, Dixon E, Harrison R, Jarvis SC. 1998. Denitrification and N2O emissions from a UK pasture soil following the early spring application of cattle slurry and mineral fertiliser. Plant Soil. 202:15–25. doi: 10.1023/A:1004332209345
- Fan Q, Zhang Y, Chen Z, Wang LN, Lou YL. 2009. Effects of soil salinity accumulating and ion constitution on pH in the soil of protected field. Agric Res Arid Areas. 27:16–20 ( Chinese).
- Guo YL, Luo LG, Chen GX, Kou YP, Xu H. 2013. Mitigating nitrous oxide emissions from a maize-cropping black soil in northeast China by a combination of reducing chemical N. Soil Sci Plant Nutr. 59:392–402. doi: 10.1080/00380768.2013.775006
- Holst J, Brüggemann N, Butterbach-Bahl K. 2008. Effects of irrigation on nitrous oxide, methane and carbon dioxide fluxes in an Inner Mongolian steppe. Adv Atmos Sci. 25:748–756. doi: 10.1007/s00376-008-0748-3
- Hoogendoorn CJ, de Klein CAM, Rutherford AJ, Letica S, Devantier BP. 2008. The effect of increasing rates of nitrogen fertiliser and a nitrification inhibitor on nitrous oxide emissions from urine patches on sheep grazed hill country pasture. Anim Prod Sci. 48:147–151. doi: 10.1071/EA07238
- Huang CH, Xue X, Wang T, De Mascellis R, Mele G, You QG, Tedeschi A. 2011. Effects of saline water irrigation on soil properties in northwest China. Environ Earth Sci. 63:701–708. doi: 10.1007/s12665-010-0738-5
- Inubushi K, Barahona MA, Yamakawa K. 1999. Effects of salts and moisture content on N2O emission and nitrogen dynamics in Yellow soil and Andosol in model experiments. Biol Fert Soil. 29:401–407. doi: 10.1007/s003740050571
- IPCC. 2001. Climate Change 2001: the scientific basis. Contribution of working group I to the third assessment report of the Intergovernmental Panel on Climate Change. Cambridge (UK): Cambridge University Press.
- IPCC. 2007. Changes in atmospheric constituents and in radioactive forcing. Cambridge (UK): Cambridge University Press.
- Irshad M, Honna T, Yamamoto S, Eneji AE, Yamasaki N. 2005. Nitrogen mineralization under saline conditions. Commun Soil Sci Plan. 36:1681–1689. doi: 10.1081/CSS-200059116
- Jiao Z, Hou A, Shi Y, Huang G, Wang Y, Chen X. 2006. Water management influencing methane and nitrous oxide emissions from rice field in relation to soil redox and microbial community. Commun Soil Sci Plan. 37:1889–1903. doi: 10.1080/00103620600767124
- Kiese R, Butterbach-Bahl K. 2002. N2O and CO2 emissions from three different tropical forest sites in the wet tropics of Queensland, Australia. Soil Biol Biochem. 34:975–987. doi: 10.1016/S0038-0717(02)00031-7
- Kong Q. 2015. Impact of ammonium and salinity concentrations on nitrous oxide emission in partial nitrification system. KSCE J Civil Eng. 19:873–879. doi: 10.1007/s12205-014-0035-z
- Kumar U, Kumar V, Singh JP. 2007. Effect of different factors on hydrolysis and nitrification of urea in soils. Arch Agron Soil Sci. 53:173–182. doi: 10.1080/03650340601138818
- Law Y, Lant P, Yuan Z. 2011. The effect of pH on N2O production under aerobic conditions in a partial nitritation system. Water Res. 45:5934–5944. doi: 10.1016/j.watres.2011.08.055
- Li YK, Li B, Guo WZ, Wu XP. 2015. Effects of nitrogen application on soil nitrification and denitrification rates and N2O emissions in greenhouse. J Agric Sci Technol. 17:519–530.
- Lodhi A, Arshad M, Azam F, Sajjad MH. 2009. Changes in mineral and mineralizable N of soil incubated at varying salinity, moisture and temperature regimes. Pak J Bot. 41:967–980.
- Malash NM, Flowers TJ, Ragab R. 2008. Effect of irrigation methods, management and salinity of irrigation water on tomato yield, soil moisture and salinity distribution. Irrig Sci. 26:313–323. doi: 10.1007/s00271-007-0095-7
- Matzner E, Borken W. 2008. Do freeze–thaw events enhance C and N losses from soils of different ecosystems? A review. Eur Soil Sci. 59:274–284. doi: 10.1111/j.1365-2389.2007.00992.x
- McSwiney CP, Robertson GP. 2005. Nonlinear response of N2O flux to incremental fertilizer addition in a continuous maize (Zea mays L.) cropping system. Global Change Biol. 11:1712–1719. doi: 10.1111/j.1365-2486.2005.01040.x
- Min W, Hou ZA, Ma LJ, Zhang W, Ru SB, Ye J. 2014. Effects of water salinity and N application rate on water- and N-use efficiency of cotton under drip irrigation. J Arid Land. 6:454–467. doi: 10.1007/s40333-013-0250-3
- Mohammad MJ. 2004. Squash yield, nutrient content and soil fertility parameters in response to methods of fertilizer application and rates of nitrogen fertigation. Nutr Cycl Agroecosyst. 68:99–108. doi: 10.1023/B:FRES.0000019036.64212.9c
- Montzka SA, Fraser PJ, Butler JH, Cunnold DM, Daniel JS, DErwent RG, Lal S, McCulloch A, Oram DE, Reeves CE, et al. 2003. Controlled substances and other source gases, Chapter 1 of the Scientific Assessment of Ozone Depletion: 2002. Scientific Assessment of Ozone Depletion: 2002, Global Ozone Research and Monitoring Project. Geneva: World Meteorological Organization. Report No. 47.
- Mosier AR, Hutchinson GL. 1981. Nitrous oxide emissions from cropped fields. J Environ Qual. 10:169–173. doi: 10.2134/jeq1981.00472425001000020009x
- Moussa MS, Sumanasekera DU, Ibrahim SH, Lubberding HJ, Hooijmans CM, Gijzen HJ, Van Loosdrecht MCM. 2006. Long term effects of salt on activity, population structure and floc characteristics in enriched bacterial cultures of nitrifiers. Water Res. 40:1377–1388. doi: 10.1016/j.watres.2006.01.029
- Ni K, Ding W, Zaman M, Cai Z, Wang Y, Zhang X, Zhou B. 2012. Nitrous oxide emissions from a rainfed-cultivated black soil in Northeast China: effect of fertilization and maize crop. Biol Fert Soils. 48:973–979. doi: 10.1007/s00374-012-0709-y
- Nicol GW, Leininger S, Schleper C, Prosser JI. 2008. The influence of soil pH on the diversity, abundance and transcriptional activity of ammonia oxidizing archaea and bacteria. Environ Microbiol. 10:2966–2978. doi: 10.1111/j.1462-2920.2008.01701.x
- Peng Q, Qi YC, Dong YS. 2011. Soil nitrous oxide emissions from a typical semiarid temperate steppe in: inner Mongolia: effects of mineral nitrogen fertilizer levels and forms. Plant Soil. 342:345–357. doi: 10.1007/s11104-010-0699-1
- Pihlatie M, Syvasolo E, Simojoki A, Esala M, Regina K. 2004. Contribution of nitrification and denitrification to N2O production in peat, clay and loamy sand soils under soil moisture conditions. Nutr Cycl Agroecosys. 70:135–141. doi: 10.1023/B:FRES.0000048475.81211.3c
- Reddy N, Crohn DM. 2014. Effects of soil salinity and carbon availability from organic amendments on nitrous oxide emissions. Geoderma. 235–236:363–371. doi: 10.1016/j.geoderma.2014.07.022
- Rietz DN, Haynes RJ. 2003. Effects of irrigation-induced salinity and sodicity on soil microbial activity. Soil Biol Biochem. 35:845–854. doi: 10.1016/S0038-0717(03)00125-1
- Robertson GP, Field CB, Raupach MR. 2004. Abatement of nitrous oxide, methane, and the other non-CO2 greenhouse gases: the need for a systems approach. In: The global carbon cycle: integrating humans, climate and the natural world. Washington, DC: Island. p. 493–506.
- Robertson GP, Groffman PM. 2007. Nitrogen transformations. In: Paul EA, editor. Soil Microbiology, Bio-chemistry, and Ecology. New York, NY: Springer. p. 341–364.
- Ruiz-Romero E, Alcántara-Hernández R, Cruz-Mondragon C, Marsch R, Luna-Guido ML, Dendooven L. 2009. Denitrification in extreme alkaline saline soils of the former lake Texcoco. Plant Soil. 319:247–257. doi: 10.1007/s11104-008-9867-y
- Scheer C, DelGrosso S, Parton W, Rowlings D, Grace P. 2014. Simulating N2O emissions from irrigated cotton wheat rotations in Australia using DAYCENT: Mitigation options by optimized fertilizer and irrigation management. EGU General Assembly Conference Abstracts; Vienna, Austria. 16, 3172.
- Scheer C, Grace PR, Rowlings DW, Payero J. 2012. Nitrous oxide emissions from irrigated wheat in Australia: impact of irrigation management. Plant Soil. 359:351–362. doi: 10.1007/s11104-012-1197-4
- Scheer C, Wassmann R, Kienzler K, Ibragimov N, Eschanov R. 2008. Nitrous oxide emissions from fertilized, irrigated cotton (Gossypium hirsutum L.) in the Aral Sea Basin, Uzbekistan: influence of nitrogen applications and irrigation practices. Soil Biol Biochem. 40:290–301. doi: 10.1016/j.soilbio.2007.08.007
- Shang HL, Peng YZ, Zhang JR, Ye L, Zhao KF. 2009. Effects of salinity concentration on N2O production during nitrification. Environ Sci. 30:1079–1083 ( Chinese).
- Silva CC, Guido ML, Ceballos JM, Marsch R, Dendooven L. 2008. Production of carbon dioxide and nitrous oxide in alkaline saline soil of Texcoco at different water contents amended with urea: a laboratory study. Soil Biol Biochem. 40:1813–1822. doi: 10.1016/j.soilbio.2008.03.004
- Šimek M, Jisova L, Hopkins DW. 2002. What is the so-called optimum pH for denitrification in soil? Soil Biol Biochem. 34:1227–1234. doi: 10.1016/S0038-0717(02)00059-7
- Smith KA, Ball T, Conen F, Dobbie KE, Massheder J, Rey A. 2003. Exchange of greenhouse gases between soil and atmosphere: interactions of soil physical factors and biological processes. Eur J Soil Sci. 54:779–791. doi: 10.1046/j.1351-0754.2003.0567.x
- Tedeschi A, Dell'Aquila R. 2005. Effects of irrigation with saline waters, at different concentrations, on soil physical and chemical characteristics. Agric Water Manage. 77:308–322. doi: 10.1016/j.agwat.2004.09.036
- Tsuneda S, Mikami M, Kimochi Y, Hirata A. 2005. Effect of salinity on nitrous oxide emission in the biological nitrogen removal process for industrial wastewater. J Hazard Mater. 119:93–98. doi: 10.1016/j.jhazmat.2004.10.025
- Wang L, Cai Z. 2008. Nitrous oxide production at different soil moisture contents in an arable soil in China. Soil Sci Plant Nutr. 54:786–793. doi: 10.1111/j.1747-0765.2008.00297.x
- Yoshie S, Noda N, Tsuneda S, Hirata A, Inamori Y. 2004. Salinity decreases nitrite reductase gene diversity in denitrifying bacteria of wastewater treatment systems. Appl Environ Microbiol. 70:3152–3157. doi: 10.1128/AEM.70.5.3152-3157.2004
- Yuan BC, Li ZZ, Liu H, Gao M, Zhang YY. 2007. Microbial biomass and activity in salt affected soils under arid conditions. Appl Soil Ecol. 35:319–328. doi: 10.1016/j.apsoil.2006.07.004
- Zartman RE, Gichuru M. 1984. Saline irrigation water: effects on soil chemical and physical properties. Soil Sci. 138:417–422. doi: 10.1097/00010694-198412000-00005
- Zeng WZ, Xu C, Wu JW, Huang JS, Ma T. 2013. Effect of salinity on soil respiration and nitrogen dynamics. Ecol Chem Eng Sci. 20:519–530.