
ABSTRACT
Poland has the largest agricultural area within the Baltic Sea drainage basin and reducing the risk of phosphorus (P) and nitrogen (N) leaching from Polish soils to water is therefore essential. Increased acidity is known to reduce soil fertility and may trigger P leaching from non-calcareous soils. As part of advisor training, 25 farms each in Pomerania and north-western Mazovia were visited and 1500 ha arable soil, including 180 ha grassland soil, were monitored in 2013–2014. The soil was mainly coarse textured, but 25% of the Pomeranian farms were dominated by silty or clayey soils. More or less regular drainage systems were found on 20% of the farms, while 50% had simpler, older (>30 years) systems with a few single pipes. The farmers often used only ammonium sulphate or other acidifying N mineral fertiliser. Median pH on the Pomeranian farms, analysed in potassium chloride solution [pH(KCl)], was 5.2 and liming was advised for fields on most (72%) of these farms. Soil P content, measured by double-lactate extraction (PDL), was positively and significantly correlated (Pearson coefficient 0.57; p < .001) with soil pH and was generally higher for pig farms. Mean PDL (P given in elemental form) tended to be lower on dairy farms and arable farms and was significantly lower (mean 51 mg PDL kg−1 soil) on mixed farms (with just a few cows and poultry) than on pig farms (mean 122 mg PDL kg−1 soil). Farm-gate balances indicated deficits of P and potassium (K) on many of the small mixed farms in Pomerania and the soil can be expected to be nutrient depleted. In contrast, the pig farms demonstrated surplus farm-gate P balances (mean 27 kg ha−1). The P leaching risk is discussed relative to soil threshold values and to results from Swedish long-term field experiments.
Introduction
Poland is one of the most important countries for agriculture in the European Union (EU), for example, it is the third largest producer of cereals in the E28, and is also largely water deprived (EUROSTAT Citation2015). However, Poland has the largest agricultural area within the Baltic Sea drainage basin (e.g. Rydén et al. Citation1993) and mitigating phosphorus (P) and nitrogen (N) leaching from Polish soils to water is therefore essential in order to counteract eutrophication of the Baltic Sea. Besides problems with low soil fertility, which reduce crop yield (Csathó & Radimszky Citation2012), Poland has issues of increased soil acidity, which has been demonstrated to cause enhanced P desorption at pH <6 from non-calcareous and medium- or fine-textured soils (Gustafsson et al. Citation2012). Increased risk of P leaching may consequently accompany low soil pH, especially if P uptake is low in a poor-yielding crop. Dystric Glossic Retisols, an acid, low fertility soil (WRB Citation2015), is frequently found in Polish lowlands. In sloping landscape, Stagnic Luvisols and Eutric Cambisols are common (Świtoniak Citation2014; Świtoniak et al. Citation2015; Waroszewski et al. Citation2015). For soil classification, pH can be measured in 1 M potassium chloride solution [pH(KCl)], for fast results with a pH electrode (Brady & Weil Citation1996), a method also adopted for topsoil monitoring at farm level in Poland. For soil samples at laboratories involved in nationwide monitoring, pH can instead be measured in soil solution (1:1) with distilled water (USDA Citation2015).
The presence of artificial drainage systems is another important factor for P leaching. Such systems may alter water quality as a result of changes in hydrology and stabilisation of the groundwater level (Skaggs et al. Citation1994). Working tile drains change soil hydrology by improving water infiltration over a larger soil surface than in undrained soil. Improved drainage is generally followed by moderated P concentrations in water (Turtola & Paajanen Citation1995; Simard et al. Citation2001). Filtering of soil particles in infiltrating water together with less soil surface erosion may be other vital reasons for field drainage (e.g. Heathwaite & Dils Citation2001).
After long-term high P fertilisation, the soil P status can be expected to be enhanced (Saarela et al. Citation2004) but accumulation of P in agricultural soils may also follow from inefficient P uptake by the crop, for example, caused by deteriorated soil structure. Soil P tests, originally aimed at assessing plant-available P, are used worldwide for risk assessment of P losses from arable land, including the acid soils of northern Europe and Baltic states (Eriksson et al. Citation2013). The so-called double-lactate method (PDL) according to Riehm (Citation1942), with extraction at low pH (3.60) and a high (0.02 M) concentration of calcium lactate, is in use, for example in Poland and Latvia. Plant-available potassium (KDL) is analysed after extraction with the same solution. A similar extraction method according to Egnér et al. (Citation1960) with the calcium ions exchanged for ammonium ions at lower (0.01 M) concentration has similar low pH (3.75). This method (PAL and KAL) is routinely used in, for example Lithuania, Norway and Sweden and, with minor modification, also in, for example Hungary. The final P concentration in the extract is either analysed at high temperature by inductively coupled plasma mass spectrometry (ICP-MS) (Sweden) or spectrophotometry (Poland). The two nutrients are expressed as P2O5 and K2O in southern Baltic regions but as single elements in most other countries. To further evaluate the P leaching risk, more or less readily dissolved forms of elements involved in sorbing P, iron (Fe) and aluminium (Al) can be analysed in the same extract. In the USA, another strongly acid extract (Mechlich 3) with pH 2.75, containing 0.27 M ammonium salts together with the complex-forming compound ethylenediaminetetraacetic acid (EDTA) is in use.
Soil P and K mapping is a planning tool for nutrient management by farmers. Indications of expected changes in soil P status are important from both an environmental and yield perspective. However, on fields with slopes and depressions, repeated soil sampling and soil P tests may be resource demanding. Phosphorus efficiency, estimated from a farm-gate balance, is another approach to indicate the direction of change in soil PAL concentration, since approximately half the P surplus ends up in the soil in this form according to Swedish long-term fertility experiments (Eriksson et al. Citation2015). There are many international studies on N farm-gate balances, especially for organic and dairy farms, but few on P and K balances, especially in connection with soil mapping. Many farms with different types of production need to be involved to indicate any general trend, since history and soil management may vary widely between farms.
Knowledge of agricultural nutrient flows, soil quality and soil hydrology is essential for estimating the risk of high P leaching from agricultural land. Assessment of soil quality and observations of soil hydrology also form the basis for farmers’ own self-evaluation of the impact of their production on water quality. In the present study, two focus areas in northern Poland were studied with the aim of determining the risk of high P losses to water at farm scale. In order to facilitate comparisons with data from long-term field experiments in other neighbouring countries with similar soil and climate, a set of soil samples from a large pig farm was tested using the pH(KCl), and PDL methods at a Polish laboratory and using the PAL method at a Swedish laboratory.
Materials and methods
Comparison of pH and soil phosphorus analysis methods
A total of 151 soil samples, 121 from topsoil (0–25 cm) and 30 from subsoil (25–60 and 60–90 cm depth), were taken on a large pig farm (RT-90 57900, 1550000) with undulating topography in West Pomerania Province, northern Poland, in summer 2014. The samples represented hills, slopes and depressions (322 ha) and for the topsoil a sample density of 0.38 ha−1. Most topsoil samples were categorised as ‘light’ (82% of samples), ‘medium’ (10%) or ‘very light’ (8%), based on the share of particles <0.02 mm after suspension (Szulc Citation2002). Based on parallel particle analysis of sand, silt and clay fractions (mean 69:17:14) with the pipette method (ISO DIN 11277 Citation1998), the soils were classified according to USDA (Citation2015) as loamy sands, sands or sandy loams, which comprised 70, 25 and 30% of samples, respectively. Analysed in a corresponding way, subsoils were mostly (67%) categorised as loamy sands and sandy loams, with the remainder sands. The topsoil texture classification demonstrated no clear relationship to topography. All soil samples were pre-treated in accordance with ISO 11464 (Citation1994) before analysis of soil pH(KCl) (PN-ISO Citation1997), (ISO 10390:Citation2005) and PDL (PN-R-Citation1996). These analyses were performed at the IUNG Laboratory, Soil Science and Plant Cultivation, National Research Institute, Pulawy, Poland. In parallel, all samples were analysed for PAL (SS-ISO 028310 Citation1993 and SS-ISO 028310T1 Citation1995) at a commercial Swedish laboratory (Agrilab, Uppsala) frequently used for farmers’ own monitoring work. These samples were also analysed for Fe and Al in the same extract (FeAL and AlAL) according to Ulén (Citation2006). In order to sufficiently cover low soil P concentrations, another 41 loamy soil samples from Latvia and Lithuania (Eriksson et al. Citation2013) were used in the evaluation of soil P method.
Soil sampling and analysis on 50 farms
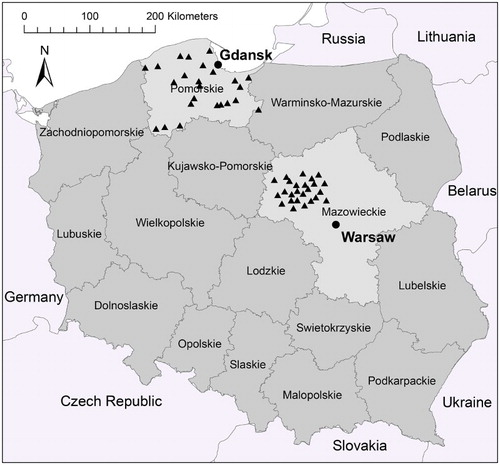
On 50 small to medium-sized (6–98 ha) farms () in two focus areas (Pomerania and north-western Mazovia, Poland), the topsoil of each field was sampled in autumn 2013 and spring 2014, giving in total 853 samples. Each was a composite sample representing 20 subsamples of mineral soil or 40 subsamples of grassland soil, together with a few organic soils. All soil samples, which were chosen to represent only one crop, were taken manually with a soil sampler in a cross, square or zigzag pattern (PN-R-04031:Citation1997) and sent to one of three chemical-agricultural laboratories, the Regional Agrochemical Stations in Gdańsk and Kielce and the CDR Brwinów Branch, Radom. In total, 1500 ha arable soil, which included 180 ha grassland soil, were monitored, with a mean sample density of 0.57 ha−1. All soil samples were pre-treated in accordance with ISO 11464 and analysed for pH(KCl) (PN-ISO 10390:Citation1997). The mineral soils were analysed for PDL (PN-R-04023:Citation1996), including spectrophotometric determination (ECS Citation1996) and KDL (PN-R-04022 Citation1996). The organic soils were extracted in 0.5 M HCl (PN-R-04024:Citation1997) before analysis of P and K in accordance with Polish standards.
Figure 1. Sites of the 25 farms (filled triangles) studied in each of the two focus areas, Pomerania and north-western Mazovia in Poland.
Joint farm walk
As part of advisor training, each farm was visited three times and on one of these visits a joint walk was held, during which systematic observations were recorded (Ramnerö Citation2015). The farms represented different types of production (). According to the Polish method of soil texture determination, the dominant soil texture was ‘medium’ (43% of evaluated agricultural area) or ‘light’ (approx. 40%), with a small proportion of ‘heavy’ (13%) and a very small proportion of ‘very light’ (approx. 1%) soils, based on the share of particles <0.02 mm after suspension. Besides, a small proportion (slightly more than 2%) represented organic soils (Pietrzak Citation2014). These results were roughly interpreted in accordance with USDA nomenclature and are presented as mean value for each farm in . Field topography on each farm was assessed from internet maps (http://geoportal.gov.pl) showing elevation distance for each metre. The general topography was also appraised when walking on the farm. Hydro-technical parameters such as presence of artificial drainage systems and the farmers’ own reports of any recurring ponded water conditions were recorded, as were soil tillage practices. Number of animals expressed as livestock units (LIU) and farm-gate balances were estimated according to Pietrzak (Citation2013), based on information given by the farmers to the advisors.
Table 1. Farm code, farm area (A, arable land), dominant soil texture class, existence of slope (S), artificial tile drain system, observations of water-ponded conditions (Pond. water) on the fields, usual season (spring or autumn) for ploughing before spring crops, livestock (LIU) density, mean topsoil concentrations of phosphorus extracted in double lactate (PDL) and pH measured in potassium chloride solution (pHKCl).
Data analysis, statistics and estimates
All soil P and K concentrations given as oxides were recalculated to elemental form. The risk index ‘degree of P saturation in the AL extract (DPSAL)’ was estimated on a molar basis according to Ulén (Citation2006) for the large pig farm. All statistical analyses were performed in Minitab 16 (Minitab Citation2010). Mean and standard deviation were estimated for all parameters on each farm, for farms with the same type of production and for all farms in the Pomerania and north-western Mazovia focus areas. For soil P and K parameters, this comprised only samples representing mineral soils, with the limited area of organic soils excluded. Results from five farm-gate balances were also not included in the assessment, since these either represented a very special form of production (e.g. a horse farm) or were appraised as doubtful. The differences in soil pH, soil concentration (P and K) and use efficiency from farm-gate balances (P and K) between farms with different agricultural enterprises and the two focus areas were assessed with a two-sample t-test. Correlations (Pearson) were considered significant at p < .05 and the direction of any relationship evaluated with linear regression.
Results and discussion
Comparison of pH and soil phosphorus analysis methods
Inter-calibration ((a)) of the two pH methods tested for the large Pomeranian farm revealed a 1.0 unit higher value with the method, but only in the range of 5.0–5.4 pH(KCl). This difference is commonly generalised as a ‘rule of thumb’. In the range of 5.5–6.0 pH(KCl), the difference was slightly less (0.9–0.8) units, while in a higher range (
6.0–7.5), the difference was less again (0.8–0.5 pH units). Consequently, care should be taken when comparing results obtained with these two different pH methods at higher pH, at least for Polish soils.
Figure 2. (a) compared with pH(KCl) for 151 soil samples from a pig farm. Coefficient of determination (r2) = 0.93. (b) PAL compared with PDL for soil from the same Polish (Po) farm, together with a set of (LiLa) Lithuanian and Latvian soils. The regression line corresponded to PAL = 4.65 + 2.042PDL, with r2 = 0.89.
The inter-calibration between the PDL method and PAL method ((b)) covering the PDL range 15–430 (mg kg−1, all values as P, not P2O5) with Polish, Latvian and Lithuanian soils demonstrated a regression line with the following equation:
Higher PAL values were obtained than in a previous inter-calibration (Schick et al. Citation2013), which encompassed German and Polish soils (range of 75–359 mg PDL kg−1) but had no samples at all with less than ‘satisfactory’ P status (corresponding to PAL < 137 mg kg soil−1). Both datasets represented the same range of ‘slightly acid’ soils (measured as ) and the difference probably partly depended on different P solubility related to concentration and cation charge (Egnér et al. Citation1960). Another reason for the differing results is probably the final P determination with ICP-MS, which includes some organic P, unlike spectrophotometric determination (Maguire et al. Citation2005). The equation found in the present study had a high coefficient of determination (r2 = 0.89). Soil PDL was recalculated to PAL according to this equation before being compared with results from P leaching studies in Swedish field experiments.
Phosphorus risk assessment on the large pig farm
Soil P concentration in topsoil from the large pig farm was high in terms of both mean and median values (). Soil PAL values above 120 mg kg−1 fall into the two highest classes (IVb and V) of six in Swedish soil nutrient assessments and are considered to have a risk of elevated P leaching (SEPA Citation2015). In all, 81% of the topsoil samples and 20% of the subsoil samples fell into these highest classes (). The DPSAL threshold value of 30, which was set from degree of P saturation using Mechlich 3 extraction (Mechlich Citation1983) (DPSM3) on US livestock farms (Butler & Coale Citation2005), gave similar shares of risk soil, namely 83% of topsoils and 26% of subsoils (). Those sites with high DPSAL also in the subsoil should be regarded having a particularly high risk of P leaching (Ulén Citation2006).
Table 2. Total number (no.) of soil samples, phosphorus (P) in ammonium lactate extract (PAL) as mean and median values, percentage of soil samples >120 mg PAL kg soil−1, corresponding to the Swedish soil P classes IVb or V, degree of phosphorus saturation in the AL extract (DPSAL, %) as mean and median values and percentage of soil samples exceeding a DPSAL threshold value of 30 in topsoil and subsoil.
Topography, drainage system and tillage practices on farms in the two focus areas
The field topography was mainly flat, but with gentle slopes on most fields on 56% of the farms. There was no artificial drainage system on 30% of farms, while 50% had frequent single drainage pipes and 20% (mostly with clayey and silty soils) had full drainage systems at least in some fields. Only three farms had drainage systems younger than 20 years and the tile drains were on average more than 30 years old. However, nearly all were reported to function well. There were few visible signs of surface erosion on fields and only 16% of the farmers reported ponded water conditions in any field. Since few regular observations of turbid water were documented, and only in Pomerania, erosion problems seem to be limited to a few farms in this focus area. Soil erosion and notable slope processes have been reported for agricultural soils in the Brodnica and Chełmno lake districts of Pomerania (Świtoniak et al. Citation2015). In the present study, 16% of the farms performed spring tillage before sowing a spring crop, but late autumn tillage was the prevalent soil preparation method before spring sowing. Converting to spring tillage where possible is important in reducing N leaching, a conclusion also demonstrated with simplified N-leaching estimates based on Swedish experiments and available as an Excel sheet for advisors (Ulén et al. Citation2013). Moreover, even if visible soil erosion was a minor problem, frequent waterlogging, wet fields and flooding caused by poor management of watercourses were reported in pre-interviews with the farmers. Local and regional management of large ditches and streams therefore poses a future challenge in areas with flat topography.
Soil pH and phosphorus soil P status on farms in the two focus areas
Median pH on all Mazovian farms was 6.2 (corresponding to 6.9) and on all Pomeranian farms 5.2 (corresponding to
6.2), based on farm averages and analysed in potassium chloride solution [pH(KCl)]. Liming was advisable for fields on most (72%) of the Pomeranian farms. Mixed farms typically had only a few cows and some poultry and were a frequent production form among the farms studied. For these generally small farms with low livestock density, many mineral soils had soil pH(KCl) around 5.0 (). Many farmers applied acidifying N mineral fertilisers in the form of ammonium sulphate or urea as the main N fertiliser (in Mazovia 50% of farms and in Pomerania 70%), since other fertilisers were expensive. Soil P content was positively and significantly correlated (Pearson coefficient 0.57; p < .001) with soil pH. Acid soils were less common on pig and dairy farms than on arable farms (), demonstrating the neutralising effect of manure (Eghball Citation1999). Soil PAL (mean 255 mg kg−1 soil) on pig farms tended to be higher than on arable farms. Soil PAL was significantly lower (mean 105 mg PAL 100 kg−1 soil) on mixed farms compared with dairy and pig farms. However, the direct relationship between number of LIU per hectare and soil PAL was weak ((a)) for these soils of unknown management history.
Figure 3. Soil P concentration on each farm estimated as extracted in ammonium lactate (PAL) in Mazovia and in Pomerania, related to: (a) number of LIU, with only a very marginal correlation coefficient (p < .1) for the Pomeranian soils and (b) soil pH in potassium chloride solution. The two latter parameters were positively correlated (Pearson correlation coefficient 0.56; p < .001, coefficient of determination r2 = 0.32). Points within the two circles represent farms with an elevated risk of high P leaching, that is, farms with very low pH or high soil PAL concentration.
Swedish long-term fertility experiments have shown relationships between PAL topsoil status and a risk of high P leaching, but this relationship has different shapes depending on soil type (Svanbäck et al. Citation2013). For some soils, the relationship increases exponentially above the 120–250 PAL value. Topsoils with PAL higher than 250 mg kg−1 soil were suggested here as having a very high P leaching risk ((b)). Including measurements of subsoil texture and DPSAL might have given a more detailed risk assessment in a corresponding way to that of the large pig farm.
Swedish long-term fertility experiments at a high soil P level (equally high as on the Polish pig farms studied here) have demonstrated that further addition of manure increases P leaching even more than expected, possibly owing to a combined effect of manure P and soil P (Svanbäck et al. Citation2013). The mechanism for increased P leaching at low soil pH with fine-textured soils is unknown, but has been verified in Swedish long-term experiments (Gustafsson et al. Citation2012). Based on acidity and soil texture of the topsoil, there may be an enhanced risk of P leaching on 12% of Pomeranian farms, even if soil P status is simultaneously low. In view of the poor plant development on acid soils, such farms with coarser soil texture may also have a P leaching risk in principle ((b)).
Farm-gate balances
Farm P surplus varied widely, and both positive and negative values were common, as found in this and other studies (). On all pig farms, there was a surplus of P and K and also of N, which varied between 200 and 340 kg ha−1 (not given in ). However, 31% of all farms were estimated to have a P deficit. Mean P surplus was highest for pig farms (mean area 42 ha) and lowest for mixed farms (mean area 23 ha) and this was also the case for mean soil P and K concentration. Farm-gate P balances on dairy farms were intermediate compared with values reported in Danish, Finnish, German and Portuguese studies (Nielsen & Kristensen Citation2005; Haas et al. Citation2007; Fanguerio et al. Citation2008; Huhtanen et al. Citation2011), and in a previous EU review (Swensson Citation2003). Mean farm-gate balances on mixed farms and soil P concentrations were low, as found in a previous Hungarian study (D'Haene et al. Citation2006, Citation2007). Potassium depletion may develop on 16% of the Polish farms studied here, especially on 35% of the mixed farms in Pomerania which had low import and export of nutrients.
Table 3. Mean (SD in brackets) phosphorus (P) and potassium (K) surplus from farm-gate balances, number (No.) of farms studied, animal livestock expressed as number of units (LIU) per hectare, mean (SD in brackets) soil PAL and KDL, country and reference. The studies encompassed one, three or several years. Soil PDL (Polish) was recalculated to PAL from the inter-calibration.
Soil P concentration and P farm-gate surplus on the Polish farms studied were significantly positively correlated (p < .05) (), as reported previously for 21 intensively managed dairy farms in SW Ireland with an annual deficit/surplus ranging between −3 and +47 kg P ha−1 (Ruane et al. Citation2014). That study, which covered four years, also demonstrated significantly higher soil test P values (measured as Morgan's test) for farms with higher P farm-gate balances.
Figure 4. Farm mean soil PDL concentration (mineral soils) and farm-gate P surplus/deficit (kg ha−1 arable land) in 2013. Pearson correlation coefficient 0.46 (p = .02), coefficient of determination (r2) = 0.19. Soil PDL tended to be higher in Mazovia than in Pomerania, but the difference was not significant.
Half the farms studied in Mazovia and Pomerania had a manure pad on which the manure was stored. The remaining farms stored their manure as compost in piles, either on the fields in which it is later spread or somewhere on the yard. Five of 12 arable farms in Mazovia imported manure from farms with animals and this resulted in a mean input of 12 kg P ha−1, or 26% of the manure produced. In Pomerania, exchange of manure between farms was minor, even though manure pads and urine pits were more common there than in Mazovia. In general, more export of manure from pig farms and intensive dairy farms is needed in order to use the manure as a P source effectively and not build up soil PAL to a higher level than at present on some farms and to avoid soil depletion on other farms.
Besides avoiding any future surplus P, complementary methods are needed to mitigate P leaching on livestock-intensive farms which have already reached high soil P levels. Such methods involve adding chemicals either directly to slurry (e.g. Brennan et al. Citation2011) or to the soil (O'Connor et al. Citation2005). Biochar has been suggested to be useful for increasing carbon storage and reducing climate change (Karhu et al. Citation2011), but contains much P and has been demonstrated to increase soluble P in soil water (Parvage et al. Citation2012). The use of magnetised biochar enriched in Fe (Chen et al. Citation2011) or the same amendment enriched in magnesium (Yao et al. Citation2013) might be a possibility to avoid this drawback.
In summary, acid soils are a problem for arable cropping and probably also to some extent for P leaching. Average soil P levels were moderate on the farms studied, but farm-gate balances indicated increasing P level for many farms with the highest soil P concentrations and depletion for small farms with low livestock density. More export of manure from pig farms to arable and small mixed farms is needed according to the farm-gate balances. These balances may be seen as an important tool for assessing environmental impact and can serve as an indicator of sustainable nutrient management. However, the analysis to be repeated in order to cover years with other production conditions (e.g. weather).
Acknowledgements
This study was funded by the private foundation BalticSea 2020, which is gratefully acknowledged. Many thanks also to Karin S. Tonderski, University of Linköping, Katarzyna Radtke, PODR, Ewa Strzeszewska, MODR, and Justyna Fila and Marek Krysztoforski, CDR, Radom, without whom this study would not have been possible.
Disclosure statement
No potential conflict of interest was reported by the authors.
References
- Brady NC, Weil RR. 1996. The nature and properties of soils. 11th ed. Upper Saddle River, NJ: Prentice-Hall Inc. ISBN 0-13-243189-0.
- Brennan RB, Fenton O, Grant J, Healy MG. 2011. Impact of chemical amendment of dairy cattle slurry on phosphorus, suspended sediment and metal loss to runoff from a grassland soil. Sci Total Environ. 409:5111–5118. doi: 10.1016/j.scitotenv.2011.08.016
- Butler JS, Coale F. 2005. Phosphorus leaching in manure-amended Atlantic Coastal Plain soils. J Environ Qual. 34:370–381.
- Chen B, Chen Z, Lv S. 2011. A novel magnetic biochar efficiently sorbs organic pollutants and phosphate. Bioresour Technol. 102(2):716–723. doi: 10.1016/j.biortech.2010.08.067
- Csathó P, Radimszky L. 2012. Sustainable agricultural NP turnover in the 27 European countries. In: Lichtfouse E, editor. Organic fertilisation, soil quality and human health. Volume 9 of the series Sustainable Agriculture Reviews. New York: Springer Science+ Business Media B.V, ISBN 978-94-007-4113-3; p. 161–186.
- D'Haene K, Magyar M, De Neve S, Pálmai O, Nagy J, Német T, Hofman G. 2006. Nitrogen and phosphorus balance of Hungarian farms as management tools for sustainable agriculture. Commun Soil Sci Plan. 37(15–20):2759–2768. doi: 10.1080/00103620600832027
- D'Haene K, Magyar M, De Neve S, Pálmai O, Nagy J, Német T, Hofman G. 2007. Nitrogen and phosphorus balances of Hungarian farms. Eur J Agron. 26(3):224–234. doi: 10.1016/j.eja.2006.10.005
- ECS. 1996. Water quality. Determination of phosphorus. Ammonium molybdate spectrometric method. In: European Standard EN 1189. Brussels: European Committee for Standardisation; p. 18.
- Eghball B. 1999. Liming effects of beef cattle feedlot manure or compost. Commun Soil Sci Plan. 30(19–20):2563–2570. doi: 10.1080/00103629909370396
- Egnér H, Riehm H, Domingo WR. 1960. Investigations on chemical soil analysis as the basis for estimating the nutrient status of soils. II. Chemical methods of extraction for phosphorus and potassium determinations. Kungl Lantbrukshogskolans Ann. 26:199–215.
- Eriksson AK, Gustafson JP, Hesterberg D. 2015. Phosphorus speciation of clay fractions from long-term fertility experiments in Sweden. Geoderma. 241–242:68–74. doi: 10.1016/j.geoderma.2014.10.023
- Eriksson AK, Ulén B, Berzina L, IItal A, Janssons V, Sileika AS, Toomsoo A. 2013. Phosphorus in agricultural soils around the Baltic Sea – comparison of laboratory methods as indices for phosphorus leaching to waters. Soil Use Manage Suppl. 29:5–14. doi: 10.1111/j.1475-2743.2012.00402.x
- EUROSTAT. 2015. Agriculture, forestry and fishery statistics 2014 edition. Luxenburg: Publication office of the European Union. ISBN:978-92-79-43201-9.
- Fanguerio D, Pereira J, Coutinho J, Moreira N, Trindade H. 2008. NPK farm-gate nutrient balances in dairy farms from Northwest Portugal. Eur J Agron. 28:625–634. doi: 10.1016/j.eja.2008.01.007
- Gustafsson JP, Mwamila LB, Kergoat K. 2012. The pH dependence of phosphate sorption and desorption in Swedish Agricultural soils. Geoderma. 189–190:304–311. doi: 10.1016/j.geoderma.2012.05.014
- Haas G, Deittert C, Köpke U. 2007. Farm-gate nutrient balance assessment of organic dairy farms at different intensity levels in Germany. Renew Agric Food Syst. 22:223–232. doi: 10.1017/S1742170507001780
- Heathwaite AL, Dils RM. 2001. Characterising phosphorus loss in surface and subsurface hydrological pathways. Sci Total Environ. 251–251:523–538.
- Huhtanen P, Nousianen J, Turtola E. 2011. Dairy farm management model 2: evaluation of different strategies to mitigate phosphorus surplus. Agric Syst. 104:383–391. doi: 10.1016/j.agsy.2011.01.001
- ISO 11464. 1994. Soil Quality – pretreatment of samples for physico-chemical analysis. Geneva: International Organization for Standardization; 9 p.
- ISO DIN 11277. 1998. Bodenbeschaffenheit: Bestimmung der Partikelgrößenverteilung in Mineralböden–Verfahren mittels Siebung und Sedimentation. Beuth, Berlin: Deutsches Institut für Normung.
- Karhu K, Mattila T, Bergström I, Regina K. 2011. Biochar addition to agricultural soil increased CH4 uptake and water holding capacity – results from a short-term pilot field study. Agric Ecosyst Environ. 140(1–2):309–313. doi: 10.1016/j.agee.2010.12.005
- Maguire RO, Chardon WJ, Simard RR. 2005. Assessing potential environmental impact of soil phosphorus by soil testing. In: Sims JT, Sharpley AN, editors. Phosphorus – agriculture and the environment. Madison: Soil Science Society of America; p. 869–919.
- Mechlich A. 1983. Mechlich 3 soil extractant: a modification of Mechlich 2 extractant. Commun Soil Sci Plan. 9:455–476. doi: 10.1080/00103627809366823
- Minitab. 2010. Meet Minitab 16. Minitab Inc.; p. 122.
- Nielsen AH, Kristensen IS. 2005. Nitrogen and phosphorus surpluses on Danish dairy and pig farms in relation to farm characteristics. Livest Prod Sci. 96:97–107. doi: 10.1016/j.livprodsci.2005.05.012
- O'Connor GA, Brinton S, Silveira ML. 2005. Evaluation and selection of soil amendments for field testing to reduce P losses. Soil Crop Sci Soc Fl. 64:22–34.
- Parvage MM, Ulén B, Eriksson J, Strock J, Kirchmann H. 2012. Phosphorus availability in soils amended with wheat residue char. Biol Fert Soils. 49(2):245–250. doi: 10.1007/s00374-012-0746-6
- Pietrzak S. 2013. Nutrient balance at farm gate. In: Ulén B, Pietrzak S, Tonderski KS, editors. Self-evaluation of farms for improved nutrient management and minimized environmental impact, Institute of Technology and Life Sciences, Falenty Poland (in Polish). ISBN 978-83-62416-65-3. Available from: www.balticsea2020.org/images/Bilagor/2014%20Guide%20-%20Self-evaluation%20of%20farms.pdf (In English); p. 7–31.
- Pietrzak S. 2014. Rating pH and soil fertility on farms of Pomorskie and Mazowieckie participating in the project “Self-assessment and risk analysis by the farmers for the loss of nutrients, and low-cost remedies” (In Polish). Report from Institute of Technology and Life Sciences, Falenty; 30 p.
- PN-ISO 10390:1997. The quality of the soil – determination of pH. (In Polish).
- PN-R-04022:1996. Analysis of the chemical-agricultural soil. Determination of plant available potassium in mineral soils. (In Polish).
- PN-R-04023:1996. Analysis of the chemical-agricultural soil. Determination of available phosphorus in mineral soils. (In Polish).
- PN-R-04024:1997. Analysis of the chemical-agricultural soil. Determination of the content of available phosphorus, potassium, magnesium, and manganese in organic soils. (In Polish).
- PN-R-04031:1997. Analysis of the chemical-agricultural soil. Sampling. (In Polish).
- Ramnerö B. 2015. Self-evaluation of the risk of enhanced nutrient leaching by Polish farmers [master thesis]. Agronomy programme Plant and Soil Sciences Uppsala 2015:15. Available from: http://stud.epsilon.slu.se
- Riehm H. 1942. Bestimmung der laktatlöslichen Phosphorsäure in karbonathaltigen Böden. Die Phosphorsäure. 1:167–178.
- Ruane EM, Treacy M, McNamar K, Humpreys J. 2014. Farm-gate phosphorus balances and soil phosphorus concentrations on intensive dairy farms in the south-west of Ireland. Irish J Agric Food Res. 53:195–119.
- Rydén L, Migula P, Andersson M. 1993. The Baltic Sea river basin – land water and climate. In Environmental Science. Baltic University Press. Available from: www.balticuniv.uu.se; p. 95–98.
- Saarela I, Järvi A, Hakkola H, Rinne K. 2004. Phosphorus status of diverse soils in Finland as influenced by long-term P fertilisation 2. Changes of soil test values in relation to P balance with references to incorporation depth of residual and freshly applied P. Agric Food Sci. 13:276–294. doi: 10.2137/1239099042643099
- Schick J, Kratz S, Rückamp D, Shwiekh R, Haneklaus S, Schnug E. 2013. Comparison and inter-calibration of different soil P tests used in the Baltic Sea countries. Knowledge report. Baltic Manure; [cited 2015 Aug]. 47 p. Available from: www.balticmanure.eu/download/Reports/method_cali-bration_final_web.pdf.
- [SEPA] Swedish Environmental Protection Agency. 2015. Risk för läckage av kväve och fosfor från åkermark. [Risk of leaching of nitrogen and phosphorus from arable land]; [cited 2015 Nov]. Available from: http://www.naturvardsverket.se/Stod-i-miljoarbetet/Vagledningar/Miljoovervakning/Bedomningssgrunder/Odlingslandskap/Akermarkenskvalitet/Risk-for-lackage-av-kva-ve-och-fosfor/.
- Simard RR, Beauchemin S, Haygarth PM. 2001. Potential for preferential pathways of phosphorus transport. J Environ Qual. 29:97–105. doi: 10.2134/jeq2000.00472425002900010012x
- Skaggs RW, Brevé MA, Gilliam JW. 1994. Hydrologic and water quality impacts of agricultural drainage. Crit Rev Environ Sci Technol. 24:1–32. doi: 10.1080/10643389409388459
- SS-ISO 028310 1993. Soil surveys – extraction and determination of phosphorus, potassium, calcium, magnesium and sodium from the soil with ammonium lactate/acetic acid solution (AL method) edition 1, 1993-05-12.
- SS-ISO 028310T1, 1995. Soil surveys – extraction and determination of phosphorus, potassium, calcium, magnesium and sodium from the soil with ammonium lactate/acetic acid solution (AL method) – technical corrigendum, edition 1, 1995-01-05.
- SS-ISO 10390, Swedish standard 2005. Soil analysis – determination of pH: soil quality – determination of pH.
- Svanbäck A, Ulén B, Etana A, Bergström L, Kleinman PJA, Mattsson L. 2013. Influence of soil phosphorus and manure on phosphorus leaching in Swedish topsoils. Nutr Cycl Agroecosys. 96:133–147. doi: 10.1007/s10705-013-9582-9
- Swensson C. 2003. Analysis of mineral element balances between 1997 and 1999 from dairy farms in the south of Sweden. Eur J Agron. 20:63–69. doi: 10.1016/S1161-0301(03)00074-1
- Świtoniak M. 2014. Use of soil profile truncation to estimate influence of accelerated erosion on soil cover transformation in young morainic landscapes, North-Eastern Poland. Catena. 116:173–184. doi: 10.1016/j.catena.2013.12.015
- Świtoniak M, Mroczek P, Bednarek R. 2015. Luvisols or Cambisols? Micromorphological study of soil truncation in young morainic landscapes – case study: Brodnica and Chełmno Lake Districts (North Poland) Catena. doi:10.1016/j.catena.2014.09.005
- Szulc W. 2002. Soil texture. In: Mercik S, editor. Agricultural chemistry. Theoretical and practical basis. Warsaw: Warsaw Agricultural University; p. 139–154. (In Polish).
- Turtola E, Paajanen A. 1995. Influence of improved subsurface drainage on phosphorus losses and nitrogen leaching from a heavy clay soil. Agr Water Manage. 28:295–310.
- Ulén B. 2006. A simplified risk assessment for losses of dissolved reactive phosphorus through drainage pipes from agriculture soils. Acta Agric Scand B Plant and Soil. 56:307–314.
- Ulén B, Pietrzak S, Tonderski KS. 2013. Self-evaluation of farms for improved nutrient management and minimised environmental impact, Institute of Technology and Life Sciences, Falenty, Poland; [cited 2015 Nov]. Available from: www.balticsea2020.org/images/Bilagor/2014%20Guide%20-%20Self-evaluation%20of%20farms.pdf.
- USDA. 2015. Soil Survey Technical Note 8 Use of Reaction (pH) in Soil Taxonomy; [cited 2015 Aug]. Available from: wps/portal/nrcs/detail/soils/ref/?cid=nrcs142p2_053575.
- Waroszewski J, Kabala C, Jezierski P. 2015. Relief-induced soil differentiation at the sandstone-mudstone contact in the Stołowe Mountains, SW Poland. Z Geomorphol. 59(Suppl. 1):209–224. doi: 10.1127/zfg_suppl/2015/S-00181
- WRB. 2015. World reference base for soil resources 2014. International soil classification system for naming soils and creating legends for soil maps Update 2015. Food and Agricultural Organisation of the United Nations. World soil resources report 106, Rome. ISBN 978-92-5-108369-7 (print); E-ISBN 978-92-5-108370-3 (PDF), 192 pp.
- Yao Y, Gao B, Chen J, Yang L. 2013. Engineered biochar reclaiming phosphate from aqueous solutions: Mechanisms and potential application as a slow-release fertilizer. Environ Sci Technol. 47(15):8700–8708.