
ABSTRACT
Upland rice is a valuable base population for protecting against genetic erosion and broadening the gene pool of rice germplasms, and rice is also the staple food of more than 100 million people across the world. Therefore, an experiment was conducted to elucidate the performances of 27 globally diverse blast-resistant upland rice genotypes in terms of morphological, physiological and yield trait characteristics and to determine the correlations between and assess the diversity among these characteristics. All of the genotypes were evaluated in a randomised complete block design with three replications. Analysis of variance revealed 18 traits with significant to highly significant variations among themselves. The BRRI dhan42, BRRI dhan43, Ja Loy, C, Choke Tang and Chirikata 2 genotypes matured early, and the Chirikata 2, C, Choke Tang, BRRI dhan43 and Padi Beleong genotypes were best in terms of yield. The greatest heritability was recorded for the numbers of filled grains/panicle and the yield/plant, which demonstrated that these traits can be successfully transferred to the offspring if selection for these characteristics is performed in a hybridisation programme. The 27 genotypes were grouped into six clusters based on the contributing morphological, physiological and yield characteristics. The first four principal components accounted for 40, 59, 70 and 79% of the total variation, respectively, which indicated abundant genetic differences between these genotypes. The Chirikata 2, C, Choke Tang and BRRI dhan43 were selected as the best genotypes and could be used as valuable resources for high-yielding, early maturing, blast-resistant cultivars and parental sources for hybridisation programmes for challenging environments in the future.
Introduction
Rice (Oryza sativa L.) is the most widely consumed grain in the world and plays vital roles in combating global hunger and aiding food security, poverty alleviation and socio-economic development in most Asian countries. Upland rice refers to rice cultures that are grown on undulated land areas in which the soils are well drained, and the rice depends completely on rainfall for its water requirements (Fageria et al. Citation2011). Upland rice comprises 11% of total global rice production and is cultivated on approximately 14 million hectares (Sohrabi et al. Citation2012). In Brazil, the mean yield of upland rice is approximately 2 t/ha compared to approximately 5 t/ha for lowland or irrigated rice (Fageria et al. Citation2013). In Nigeria, although the production of rice has increased due to a marked expansion in the area, the productivity per unit area has remained at approximately 1.5 t/ha (Vange Citation2009). Generally, the grain yields of upland rice are low and range from 0.5 to 1.5 t/ha in Asia, are approximately 0.5 t/ha in Africa and range from 1.0 to 4.0 t/ha in Latin America (IRRI Citation1975).
Upland rice has several favourable characteristics compared with high-yielding varieties, which include drought tolerance, increased nutritional and medicinal values, and the possession of resistance genes against biotic and abiotic stresses. Specifically, coloured upland rice is rich in minerals, vitamins and antioxidants, such as α-tocopherol (Ahmad Citation2014). Water is becoming increasingly scarce, and its declining availability and high cost threatens traditional irrigated rice production systems (Anwar et al. Citation2010). Fifteen of the 75 million hectares of Asia's irrigated rice may experience severe water shortages by 2025 (Tuong and Bouman Citation2003). Therefore, water scarcity may seriously affect irrigated traditional rice production systems (IWMI Citation2000). Thus far, different water-saving technologies have been developed for rice, for example, saturated soil cultures (Borell et al. Citation1997), alternate wetting and drying (Tabbal et al. Citation2002), ground cover systems (Lin et al. Citation2002) and systems of rice intensification (Stoop et al. Citation2002). However, none of these approaches has emerged as a suitable substitute. One approach may be the growing of rice as an upland crop like wheat or maize (Anwar et al. Citation2010). Despite low yields, traditional upland rice cultivars are being grown successfully due to their drought tolerance (Anwar et al. Citation2010). These cultivars are also important in cropping systems due to the lack of requirements for irrigation facilities and the lower cost of production (Fageria et al. Citation2014).
The evaluation and characterisation of upland rice should be performed to facilitate its use as breeding materials and to improve yields. Morpho-physiological characterisation is the first priority for improving upland rice germplasms in terms of increasing yields, quality and stress tolerance (both biotic and abiotic). Morphological and physiological characterisation is a traditional and general approach to assessing variation and genetic diversity but is also very important for the selection and utilisation of appropriate parents in breeding programmes (Hien et al. Citation2007). Genetic variation is the basis of plant breeding and provides a great array of genotypes that can be selected to develop new varieties or breeding materials (Pandey et al. Citation2009). Knowledge about heritability helps plant breeders to predict the nature of the succeeding generations that make appropriate selections and assess the magnitudes of genetic improvements due to selection (Tuhina-Khatun et al. Citation2007). Crop plant diversity is necessary to manage the continuing genetic erosion and to address the issues of genetic conservation to successfully meet future food requirements. To boost the yield potential of upland rice, it is necessary to identify cultivars with improved yields and other desirable agronomic characteristics, including disease resistance, to overcome the global problem of hunger and starvation, especially in African countries (Osman et al. Citation2012). The present study was therefore conducted to select potential genotypes to achieve higher yields and identify the most important characteristics for breeding programmes by exploiting genetic variation, heritability and diversity analyses of the yields and related attributes of 27 blast-resistant genotypes.
Materials and methods
Experimental location, experimental design and planting material
The experiment was conducted at the net house of Experimental Field #10 of the Universiti Putra Malaysia (UPM) from August to December 2013. The experimental site is located between 3°02′N and 101°42′E at an altitude of 31 m above sea level. The study was designed as a randomised complete block design (RCBD) with three replications. Metal tanks were used for the planting of the rice genotypes. The tanks were filled with well-pulverised soil.
Rice genotypes and seedling raising, transplantation and management practices
Twenty-seven blast-resistant upland rice genotypes () selected from our previous study (Tuhina-Khatun et al. Citation2015) that originated from 11 diverse agro-ecological zones were used in this study. Thirty sun-dried seeds of each genotype were treated with 70% ethanol for 90 s to control seed-borne diseases and then placed on moist filter paper in petri dishes for germination. After germination, 10-day-old seedlings were transplanted into the metal tanks. Only one seedling per hill was transplanted, and each replicate consisted of two hills for each genotype. The inter-plant and inter-row distances were maintained at 20 cm. The management practices, including irrigation, fertilisation, weeding and spraying, were performed following standard agronomic practices (WARDA – IRRI).
Table 1. Name, origin, grain colour and reactions patterns of 27 blast-resistant upland rice genotypes.
Data collection
The following parameters were included in the data collection: days to flowering (DF, days), days to maturity (DM, days), plant height (PH, cm), flag leaf length (FL, cm), leaf chlorophyll contents at 67 and 97 days after transplantation (CC67 and CC97, respectively), total number of tillers/plant (TT, no), number of effective tillers/plant (ET, no), panicle length (PL, cm), number of filled grains/panicle (FG, no), number of unfilled grains/panicle (UFG, no), grain length (GL, mm), grain breadth (GB, mm), grain length/breadth ratio (L/B), straw yield/plant (SY, g), harvest index (HI, %), 100-grain weight (100 GW, g) and yield/plant (Y, g). The chlorophyll contents of the leaves were measured in terms of the silicon photon-activated diode (SPAD) values at 67 and 97 days after transplantation using a portable SPAD meter (MINOLTA™ SPAD-502, Minolta camera Co., Osaka, Japan). The GL and GB were calculated with a digital Leica EZ4D microscope using Leica Application Suite software version 2.1.0. The grain sizes and shapes were determined according to the criteria of Singh et al. (Citation2000) as follows:
The remaining parameters were recorded based on the standard evaluation system (SES) introduced by the International Rice Research Institute (IRRI Citation1996).
Statistical analyses
Analyses of variance and comparisons of the means were performed with SAS software version 9.2. The diversity analysis was conducted with NTSYS-PC software (version 2.1) and Minitab software (version 15). The genetic parameters, including the genotypic and phenotypic variances, the genotypic and phenotypic coefficients of variance, the heritability (broad sense) and the expected genetic advance (GA), were calculated according to the formula given by Burton and DeVane (Citation1953) and Johnson et al. (Citation1955).
Results
Variation in the morphological traits
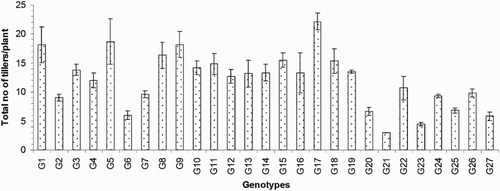
The days to flowering (DF) varied from 70 to 99 days and averaged 88 days. The G3 was the earliest flowering genotype, and G11 was the latest flowering (). The days to maturity (DM) varied from 100 to 129 days and averaged 118 days. Genotypes G26 (100 days), G25 (101 days), G22 (102 days), G20 (103 days), G4 (105 days) and G3 (105 days) matured early, and G18 (129 days), G7 (129 days), G11 (129 days), G19 (129 days), G17 (128 days) and G15 (127 days) were late to mature (). Regarding the agronomic traits, the plant heights (PH) ranged from 71.30 to 142.97 cm and averaged 100.76 cm. Genotype G8 exhibited the shortest PH, and genotype G4 exhibited the tallest PH (). The flag leaf length (FL) values ranged from 20.17 to 46.93 cm and averaged 29.45 cm. The genotypes with the tallest plant heights also exhibited the highest FL, including G4 (46.93 cm) and G3 (45.22 cm), and the dwarf varieties exhibited the lowest FL, including G8 (20.17 cm) and G11 (20.60 cm) (). Regarding the morphological characteristics, the total number of tillers/plant (TT) exhibited considerable variation between the different genotypes. The lowest TT was that of the genotype G21 (3.00), and the greatest TT was that of G17 (22.17; ). The average TT was 12.09.
Figure 1. Days to flowering and days to maturity of 27 blast-resistant genotypes. Each column represents mean with standard error of each genotype; n = 3. G1, Black Banni; G2, Blau Noc; G3, Chirikata 2; G4, Choke Tang; G5, Chokoto 14; G6, IPPA; G7, IR 3257-13-56; G8, IR 5533-13-1-1; G9, IR 5533-14-1-1; G10, IR 5533-15-1-1; G11, IR 5533-50-1-10; G12, IR 5533-55-1-11; G13, IR 5533-56-1-12; G14, IR 5533-PP 854-1; G15, IR 9559-3-1-1; G16, IR 9559-4-1-1; G17, IR 9559-PP 871-1; G18, IR 9669-22-2-6; G19, IR 9669-PP 823-1; G20, Ja Hau; G21, Ja No Naq; G22, C; G23, F1 seed (BR16 × Karingam); G24, BR26; G25, BRRI dhan42; G26, BRRI dhan43; G27, BRRI dhan48.
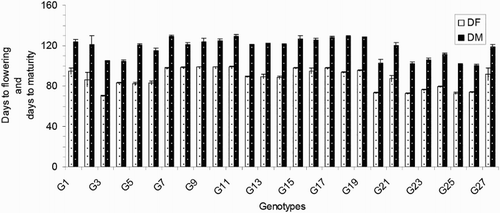
Figure 2. Plant height of 27 blast-resistant genotypes. Each column represents mean with standard error of each genotype; n = 3. G1, Black Banni; G2, Blau Noc; G3, Chirikata 2; G4, Choke Tang; G5, Chokoto 14; G6, IPPA; G7, IR 3257-13-56; G8, IR 5533-13-1-1; G9, IR 5533-14-1-1; G10, IR 5533-15-1-1; G11, IR 5533-50-1-10; G12, IR 5533-55-1-11; G13, IR 5533-56-1-12; G14, IR 5533-PP 854-1; G15, IR 9559-3-1-1; G16, IR 9559-4-1-1; G17, IR 9559-PP 871-1; G18, IR 9669-22-2-6; G19, IR 9669-PP 823-1; G20, Ja Hau; G21, Ja No Naq; G22, C; G23, F1 seed (BR16 × Karingam); G24, BR26; G25, BRRI dhan42; G26, BRRI dhan43; G27, BRRI dhan48.
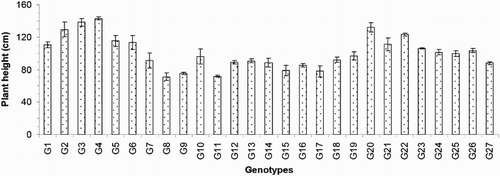
Figure 3. Flag leaf length of 27 blast-resistant genotypes. Each column represents mean with standard error of each genotype; n = 3. G1, Black Banni; G2, Blau Noc; G3, Chirikata 2; G4, Choke Tang; G5, Chokoto 14; G6, IPPA; G7, IR 3257-13-56; G8, IR 5533-13-1-1; G9, IR 5533-14-1-1; G10, IR 5533-15-1-1; G11, IR 5533-50-1-10; G12, IR 5533-55-1-11; G13, IR 5533-56-1-12; G14, IR 5533-PP 854-1; G15, IR 9559-3-1-1; G16, IR 9559-4-1-1; G17, IR 9559-PP 871-1; G18, IR 9669-22-2-6; G19, IR 9669-PP 823-1; G20, Ja Hau; G21, Ja No Naq; G22, C; G23, F1 seed (BR16 × Karingam); G24, BR26; G25, BRRI dhan42; G26, BRRI dhan43; G27, BRRI dhan48.
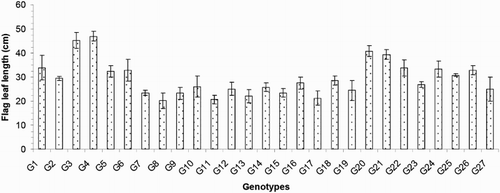
Figure 4. Total number of tillers/plant of 27 blast-resistant genotypes. Each column represents mean with standard error of each genotype; n = 3. G1, Black Banni; G2, Blau Noc; G3, Chirikata 2; G4, Choke Tang; G5, Chokoto 14; G6, IPPA; G7, IR 3257-13-56; G8, IR 5533-13-1-1; G9, IR 5533-14-1-1; G10, IR 5533-15-1-1; G11, IR 5533-50-1-10; G12, IR 5533-55-1-11; G13, IR 5533-56-1-12; G14, IR 5533-PP 854-1; G15, IR 9559-3-1-1; G16, IR 9559-4-1-1; G17, IR 9559-PP 871-1; G18, IR 9669-22-2-6; G19, IR 9669-PP 823-1; G20, Ja Hau; G21, Ja No Naq; G22, C; G23, F1 seed (BR16 × Karingam); G24, BR26; G25, BRRI dhan42; G26, BRRI dhan43; G27, BRRI dhan48.
Variation in the physiological traits
The relative leaf tissue chlorophyll contents 67 (CC67) days after transplantation (DATs) varied from 36.57 to 45.07 and averaged 40.73, and the 97 DAT values ranged from 37.65 to 49.48 and averaged 42.06 (). Genotype G21 produced the greatest chlorophyll contents at both 67 and 97 DATs with values of 45.07 and 49.48, respectively. The lowest chlorophyll contents were recorded in the G6 (36.57) and G8 (37.65) genotypes on 67 and 97 DATs, respectively. The straw yields/plant (g) ranged from 7.45 to 36.43 g and averaged 17.92 g. The HI ranged from 3.76% to 48.40% and averaged 19.11%.
Variation in the yields and yield-contributing traits
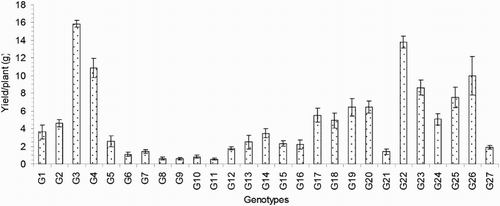
The numbers of effective or productive tillers/plant (ET) varied from 2.50 to 13.33 and exhibited significant variation between the genotypes in the present study. The average value of this trait was 7.64. Compared to the others, genotype G21 exhibited the lowest ET, and genotype G3 exhibited the highest ET (). The important yield trait of panicle length ranged from 13.76 to 33.29 cm and averaged 20.37 cm (). Genotype G23 had the longest PL (33.29 cm), and that of G7 was the shortest (13.76 cm). The average number of filled grains/panicle (FG) was 29.34, and this value ranged from 4.17 to 85.95. The maximum FG was observed for genotype G23 (85.95; ), and the minimum FG value was observed for genotype G8 (4.17). The maximum number of unfilled grains/panicle (UFG) was observed in genotype G25, and the minimum value was observed in genotype G5; these values were 65.07 and 17.37, respectively. The mean UFG value was 32.55 (). The grain length (GL) and grain breadth (GB) (mm) varied significantly among the 27 resistant genotypes. Genotype G5 produced the longest (8.33 mm) GL, and the broadest GB was observed in genotype G9 (2.83 mm). Genotype G7 exhibited the shortest (5.37 mm) GL, and G23 exhibited the narrowest (1.90 mm) GB among all of the genotypes. The average GL and GB were 6.30 and 2.33 mm, respectively (). Among the 27 rice genotypes, only a single genotype, that is, G5, had a very long grain size, one genotype (G7) had a short grain size, and the remaining genotypes had medium-sized grains (). Regarding the grain shapes, five genotypes had long grains, and the other genotypes exhibited medium grain shapes. The highest 100-grain weight (100 GW) was observed for genotype G5 at the value of 2.81 g, and the lowest value was observed for genotype G2 at 1.38 g (). The yield/plant (Y) vary significantly from 0.57 to 15.86 g and averaged 4.69 g. Genotype G3 produced the greatest (15.86 g) Y, and genotype G11 produced the lowest (0.57 g) Y (). The other high-yielding genotypes were G22 (13.77 g), G4 (10.85 g), G26 (9.99 g), G23 (8.66 g) and G25 (7.53 g).
Figure 5. Number of effective tillers/plant of 27 blast-resistant genotypes. Each column represents mean with standard error of each genotype; n = 3. G1, Black Banni; G2, Blau Noc; G3, Chirikata 2; G4, Choke Tang; G5, Chokoto 14; G6, IPPA; G7, IR 3257-13-56; G8, IR 5533-13-1-1; G9, IR 5533-14-1-1; G10, IR 5533-15-1-1; G11, IR 5533-50-1-10; G12, IR 5533-55-1-11; G13, IR 5533-56-1-12; G14, IR 5533-PP 854-1; G15, IR 9559-3-1-1; G16, IR 9559-4-1-1; G17, IR 9559-PP 871-1; G18, IR 9669-22-2-6; G19, IR 9669-PP 823-1; G20, Ja Hau; G21, Ja No Naq; G22, C; G23, F1 seed (BR16 × Karingam); G24, BR26; G25, BRRI dhan42; G26, BRRI dhan43; G27, BRRI dhan48.
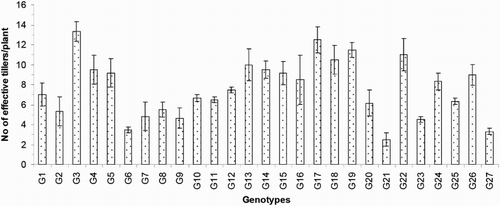
Figure 6. Number of filled grains/panicle and unfilled grains/panicle of 27 blast-resistant genotypes. Each column represents mean with standard error of each genotype; n = 3. G1, Black Banni; G2, Blau Noc; G3, Chirikata 2; G4, Choke Tang; G5, Chokoto 14; G6, IPPA; G7, IR 3257-13-56; G8, IR 5533-13-1-1; G9, IR 5533-14-1-1; G10, IR 5533-15-1-1; G11, IR 5533-50-1-10; G12, IR 5533-55-1-11; G13, IR 5533-56-1-12; G14, IR 5533-PP 854-1; G15, IR 9559-3-1-1; G16, IR 9559-4-1-1; G17, IR 9559-PP 871-1; G18, IR 9669-22-2-6; G19, IR 9669-PP 823-1; G20, Ja Hau; G21, Ja No Naq; G22, C; G23, F1 seed (BR16 × Karingam); G24, BR26; G25, BRRI dhan42; G26, BRRI dhan43; G27, BRRI dhan48.
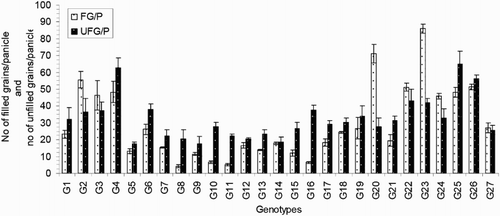
Figure 7. 100 grain weight of 27 blast-resistant genotypes. Each column represents mean with standard error of each genotype; n = 3. G1, Black Banni; G2, Blau Noc; G3, Chirikata 2; G4, Choke Tang; G5, Chokoto 14; G6, IPPA; G7, IR 3257-13-56; G8, IR 5533-13-1-1; G9, IR 5533-14-1-1; G10, IR 5533-15-1-1; G11, IR 5533-50-1-10; G12, IR 5533-55-1-11; G13, IR 5533-56-1-12; G14, IR 5533-PP 854-1; G15, IR 9559-3-1-1; G16, IR 9559-4-1-1; G17, IR 9559-PP 871-1; G18, IR 9669-22-2-6; G19, IR 9669-PP 823-1; G20, Ja Hau; G21, Ja No Naq; G22, C; G23, F1 seed (BR16 × Karingam); G24, BR26; G25, BRRI dhan42; G26, BRRI dhan43; G27, BRRI dhan48.
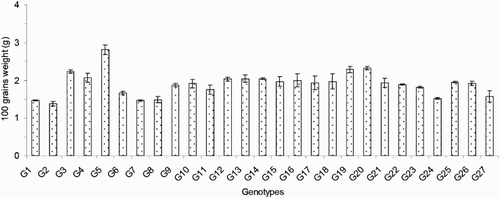
Figure 8. Yield/plant of 27 blast-resistant genotypes. Each column represents mean with standard error of each genotype; n = 3. G1, Black Banni; G2, Blau Noc; G3, Chirikata 2; G4, Choke Tang; G5, Chokoto 14; G6, IPPA; G7, IR 3257-13-56; G8, IR 5533-13-1-1; G9, IR 5533-14-1-1; G10, IR 5533-15-1-1; G11, IR 5533-50-1-10; G12, IR 5533-55-1-11; G13, IR 5533-56-1-12; G14, IR 5533-PP 854-1; G15, IR 9559-3-1-1; G16, IR 9559-4-1-1; G17, IR 9559-PP 871-1; G18, IR 9669-22-2-6; G19, IR 9669-PP 823-1; G20, Ja Hau; G21, Ja No Naq; G22, C; G23, F1 seed (BR16 × Karingam); G24, BR26; G25, BRRI dhan42; G26, BRRI dhan43; G27, BRRI dhan48.
Interrelations among the 18 morpho-physiological, yield and yield-contributing traits
The levels of association among the 18 traits varied significantly at different points (). The greatest positive r value (0.89; P < .01) indicated a very strong correlation between DF and DM. The morphological characteristics of DF (0.36**) and DM (0.49**) were highly significantly positively correlated with TT; in contrast, PH and FL were highly significantly negatively correlated with TT. Most of the traits exhibited negative relationships with DF with the exceptions of DM, TT, SY and GB. The second highest positive r value (0.85**; P < .01) was observed between FG and HI. The important morphological trait PH was highly significantly negatively correlated with DF (−0.68**) and DM (−0.62**) and not significantly associated with TT (−0.22NS). In this analysis, we noticed that the physiological trait HI was highly significantly related to nearly all of the studied traits with the exceptions of the non-significant associations of this trait: CC97, SY, ET, GL and 100 GW. Importantly, the characteristic with the strongest contribution to yield, FG, was highly significantly positively correlated with PH, FL, TT, HI, PL, UFG and Y. The Y parameter, which is vital among all of the plant characteristics, exhibited positive correlations with all of the traits except DF, DM and TT. Among the 153 correlation coefficients, 105 (approximately 68.63%) indicated positive relationships, and 48 (31.37%) of these values were negative. Moreover, 51.63% of these values indicated significant to highly significant relationships, and 48.37% indicated non-significant relationships.
Table 2. Pearson's correlation coefficient among 18 morpho-physiological and yield traits of 27 blast-resistant upland rice genotypes.
Determination of the genetic variations
The results revealed a wide range of variability in the 18 quantitative traits among the 27 blast-resistant genotypes (). The phenotypic variance (σ2P) of all of the traits was higher than the genotypic variance (σ2G). Similarly, the phenotypic coefficient of variation (PCV) was higher than the genotypic coefficient of variation (GCV). The highest PCV was recorded for the traits of FG and Y (75.09% and 90.80%, respectively). In contrast, the lowest PCV belonged to the characteristics of CC67 (6.67%) and CC97 (7.43%). The GCV ranged from 4.78% (CC67) to 86.57% (Y). The next-highest GCV were those of FG (72.53%), HI (66.38%), UFG (36.83%) and SY (35.83%). The majority of the traits in the present study exhibited high heritability. Heritability greater than 80% was recorded for the characteristics of DF (87%), DM (86%), PH (84%), HI (86%) and GL (83%). Furthermore, the greatest heritability and greatest genetic advances (GA) were also observed for FG (h2B: 93% and GA: 144.29) and Y (h2B: 91% and GA: 170.02). In this study, the genetic advance (GA) values ranged from 7.05% for CC67 to 170.02% for Y.
Table 3. Estimation of genetic parameters of 18 agronomic, physiological, yield and yield-contributing traits.
Cluster analysis
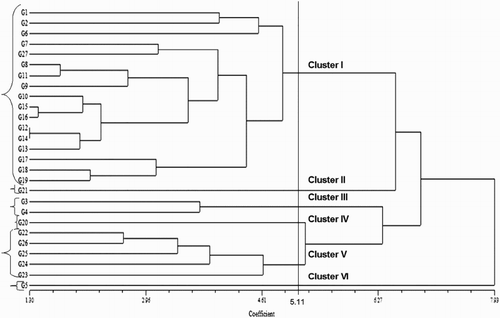
The Euclidean distances were calculated using the standardised morphological data, and a UPGMA dendrogram was constructed using these values for the 27 blast-resistant upland rice genotypes. Six major groups were observed among the 27 genotypes based on multivariate analysis and a 5.11 dissimilarity coefficient value (). The value of 5.11 was set only for the convenience of explanation in this case. Cluster I contained the greatest number of genotypes (17 or 62.96% of all of the genotypes). Cluster V contained the second highest number at five members. Clusters II, III, IV and VI consisted of one, two, one and one genotypes, respectively ().
Table 4. Groups of 27 upland rice genotypes according to cluster analysis.
Figure 9. Cluster analysis of 27 blast-resistant upland rice genotypes based on morphological, physiological and yield associated characters. The unweighted pair group method with arithmetic mean (UPGMA) algorithm was used for clustering. G1, Black Banni; G2, Blau Noc; G3, Chirikata 2; G4, Choke Tang; G5, Chokoto 14; G6, IPPA; G7, IR 3257-13-56; G8, IR 5533-13-1-1; G9, IR 5533-14-1-1; G10, IR 5533-15-1-1; G11, IR 5533-50-1-10; G12, IR 5533-55-1-11; G13, IR 5533-56-1-12; G14, IR 5533-PP 854-1; G15, IR 9559-3-1-1; G16, IR 9559-4-1-1; G17, IR 9559-PP 871-1; G18, IR 9669-22-2-6; G19, IR 9669-PP 823-1; G20, Ja Hau; G21, Ja No Naq; G22, C; G23, F1 seed (BR16 × Karingam); G24, BR26; G25, BRRI dhan42; G26, BRRI dhan43; G27, BRRI dhan48.
Principal component analysis
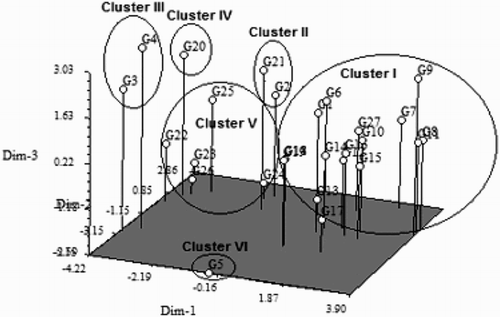
The PCA results generally confirmed the findings of the cluster analysis. In the PCA, the genotypes also clustered into six groups (), and there were only a few differences between groups I and III with respect to the cluster analysis. These findings demonstrated that the data obtained from this experiment were accurate, precise and reliable. The PCA analysis revealed that the first four principal components accounted for approximately 79.0% of the total variation, and the correlations between these components were very high. The first, second, third and fourth principle components explained approximately 40.0%, 59.0%, 70.0% and 79.0% of the variation observed in the eigenvector analysis (). In the first PC, PH (0.31), FL (0.29), HI (0.34), PL (0.28), FG (0.33) and Y (0.31) were the most important contributing traits; similarly, TT (0.31), SY (0.26), ET (0.39) and Y (0.32) were the most important parameters in the fourth PC.
Table 5. Eigenvectors and eigenvalues of the first four principle components of 18 traits.
Figure 10. Three dimensional graph of 27 blast-resistant upland rice genotypes based on morphological, physiological and yield associated characters (Principal Component Analysis). G1, Black Banni; G2, Blau Noc; G3, Chirikata 2; G4, Choke Tang; G5, Chokoto 14; G6, IPPA; G7, IR 3257-13-56; G8, IR 5533-13-1-1; G9, IR 5533-14-1-1; G10, IR 5533-15-1-1; G11, IR 5533-50-1-10; G12, IR 5533-55-1-11; G13, IR 5533-56-1-12; G14, IR 5533-PP 854-1; G15, IR 9559-3-1-1; G16, IR 9559-4-1-1; G17, IR 9559-PP 871-1; G18, IR 9669-22-2-6; G19, IR 9669-PP 823-1; G20, Ja Hau; G21, Ja No Naq; G22, C; G23, F1 seed (BR16 × Karingam); G24, BR26; G25, BRRI dhan42; G26, BRRI dhan43; G27, BRRI dhan48.
Genetic distance estimation
The genetic differentiation between the six major groups is presented in . The distance coefficients ranged from 9.43 (cluster II vs. III) to 35.75 (cluster III vs. V). The next higher pairwise Euclidean distances were those of cluster III with VI (32.02) and cluster II with VI (31.16). In contrast, clusters I and VI (9.48) and clusters II and IV (12.48) exhibited the smallest pairwise distance coefficient values.
Table 6. Intra (bold) and inter cluster distance among six groups of 27 blast-resistant upland rice genotypes.
Discussion
The 27 blast-resistant genotypes () varied significantly in terms of all 18 of the examined characteristics. These findings indicate the existence of wide variation in all of these traits in the population. The most important morphological traits for crop improvement are the days to flowering and the days to maturity. In breeding programmes, early maturing genotypes with high yield potentials are preferable for the development of varieties with short growth durations that can fit into diversified cropping patterns. The medium growth cycle (100–129 days) of our studied genotypes could facilitate the cultivation of other crops during the fallow period by upland farmers (). The growth durations of the upland rice varieties vary with early maturation (90–105 days), medium duration maturation (105–130 days) and late maturation (130–150 days) (Jacquot and Courtois Citation1987). Generally, upland rice has a long growth cycle. In this study, we identified some promising rice genotypes, including BRRI dhan43, BRRI dhan42, C, Ja Hau, Choke Tang and Chirikata 2, which have growth cycles of less than 105 days and are thus indicated for use on the same lands that are used for the cultivations of other crop within the same year. These genotypes could ultimately increase farmers’ incomes. Plant height is also a major agronomic characteristic that indirectly affects rice plant yields. Traditionally, upland rice varieties are tall in stature, susceptible to lodging at maturity, respond poorly to nitrogen fertiliser, and therefore produce low yields. For high-yielding varieties, moderate plant heights are desirable. In the present case, the improved upland rice lines that originated from the Philippines exhibited lower plant heights than the traditional genotypes. On average, medium (71.30–142.97 cm) plant heights were recorded in our investigation (). Our findings accord with the findings of Sohrabi et al. (Citation2012). This author observed the genetic variations in 50 upland rice genotypes in terms of 12 quantitative traits and recorded a mean plant height of 136.36 cm. The important finding of the present investigation was the tallest genotype showed the highest flag leaf length, while the dwarf genotype exhibited the shortest flag leaf length ( and ). The total number of tillers/plant unveiled wider variation among different genotypes (). The values for the physiological trait of the chlorophyll content per leaf (36.57–45.07 on 67 DAT and 37.65–49.48 on 97 DAT) observed in our study () were greater than those observed in a study conducted by Anwar (Citation2012). This author stated that the relative chlorophyll contents ranged from 31.55 to 35.74 for the aerobic rice variety AERON 1 according to different weed control strategies. In another experiment conducted by Naher (Citation2009), the relative chlorophyll contents of two varieties ranged from 34 to 43, which agree with the results of the present study. The lower SY (7.45–36.45 g) and HIs (3.76–48.40%) of the genotypes examined here () could be among the reasons for the lower yields of upland rice compared with HYV. The biological yield of a cereal crop is the total yield of the plant tops and is an indication of the photosynthetic capability of the crop (Yoshida Citation1981). Rice cultivars with higher yields are associated with greater dry matter production, and increases in the dry matter and grain harvest indices contribute equally to yield increases (Hasegawa Citation2003). However, in another study of six traditional and improved varieties of upland rice by Saito et al. (Citation2006), the total dry matters values ranged from 5.6 to 8.9 t/ha, and the harvest indices ranged from 25 to 36%, and these values are very close to our findings. The average number of ET was 7.64 (), which is twofold higher than that observed in a study by (Ferdous Citation2012). This author reported panicle numbers per plant that ranged from 2 to 6 and averaged 3 among 35 upland rice genotypes. The low tillering capacity of most upland varieties is the main limitation that prevents higher yields (Chang et al. Citation1972). The important yield trait panicle length showed a wide range of variation among the 27 upland rice genotypes (). The FGs were comparatively low among our studied genotypes (). The primary yield-contributing characteristic FG directly influences the yields of rice plants. Annual upland rice variety should have 150–200 spikes per panicle, five to eight panicles per plant, very sturdy stems, erect upper leaves and droopy lower leaves and should be 130-cm tall with deep, thick roots and a 100-day growth duration. Moreover, these plants should be resistant to multiple diseases and insects and have yield potentials of 3–4 Mg/ha (Fageria Citation2007). The grain character 100 grain weight showed little fluctuation among all genotypes (). Most of the genotypes belonged to medium shape and size grain in the present case (). The Y of the 27 genotypes varied widely from 0.57 to 15.86 g/hill or 0.15 to 3.97 t/ha (). Because the yields of upland rice varieties are limited to 0.50–1.50 t/ha in Asia, we identified some of blast-resistant upland rice genotypes with yields greater than 2.0 t/ha, that is, Chirikata 2, C, Choke Tang, BRRI dhan43 and F1 seed (BR16 × Karingam), which had yields of 3.96, 3.44, 2.71, 2.50 and 2.17 t/ha, respectively. These genotypes could replace the low-yielding varieties of upland rice that have generally been cultivated by Asian farmers over generations.
Yield is a complex and quantitatively inherited trait that depends on other yield-contributing characteristics that are influenced by genetic effects. Therefore, knowledge of the correlation coefficients between different traits is essential for the design of an effective hybridisation programme. The highly significant and strong positive correlations between DF and DM and between PH and FL () indicated the possibility of selecting these traits for further improvements of future generations. A positive (0.32**) and significant correlation was also found between the days to 50% flowering and the days to maturity by Mazid (Citation2013). The FG was positively and highly significantly correlated with the HI, PL and Y, and these findings are consistent with and supported by those of Ullah et al. (Citation2011) and Mazid (Citation2013). The vital plant characteristic Y was significantly and positively correlated with nearly all of the traits. Similar findings have also been observed by many researchers (Lasalita-Zapico et al. Citation2010; Abarshahr et al. Citation2011; Sohrabi et al. Citation2012; Mazid Citation2013). These researchers have recorded significant positive correlations of the majority of the morphological traits with yield in rice plants. Correlations between traits are important because they help the breeder select important characteristics from the studied traits (Sohrabi et al. Citation2012). The majority of traits, including yield and yield-component traits, are influenced by interactions between the genotype and environment, and therefore, the use of correlation coefficients makes selection easy for plant breeders (Ahmadikhah et al. Citation2008). The correlation coefficients implied that DF, DM, SY, HI, ET, PL, FG and 100 GW () should be considered during selection to improve yields and other desirable agronomic characteristics.
The genetic analysis of quantitative traits is a pre-requisite for plant breeding programmes and can lead to a systematic method of design and the appropriate planning of plant breeding strategies. The current study suggests that the PCV was greater than the GCV for all of the traits (). Similar results were reported for all traits observed in another study (Osman et al. Citation2012). This study reported that the environmental effect on any trait is indicated by the magnitude of the differences between the genotypic and phenotypic coefficients of variation, that is, large differences reflect a substantial environmental effect, and small differences indicate a strong genetic influence. In the present study, the small differences between the PCV and GCV for most of the traits, including DF, DM and GL, indicated some degree of environmental influence on the phenotypic expressions of these characteristics. These small differences also suggest that selection based on these characteristics would be effective in future crossing programmes. The variables DF, DM, PH, HI, FG, GL and Y exhibited greater higher heritabilities and thus indicated the presence of additive gene actions. The FG and Y characteristics exhibited very high heritabilities coupled with the greatest genetic advance, which suggests that these traits were mainly under genetic control and that they can be scored according to their phenotypic performances. In a separate study of 19 upland rice accessions, Vange (Citation2009) estimated high heritability and genetic advances for the parameters of days to 50% heading, days to maturity, flag leaf area, panicle weight, panicle length, no. of branches per panicle, no. of seeds/panicle and seed weight/panicle at seed yield.
The 27 upland rice genotypes clustered into six groups based on the dendrograms from the cluster analysis and PCA ( and ). The groupings from the hierarchical cluster analysis exhibited a dendrogram topology and cluster memberships that were similar to those produced based on the PCA analysis, which confirmed the accuracy of the constructed dendrogram. Similarly, Worede et al. (Citation2014) calculated a similar clustering pattern based on hierarchical cluster analysis and principal component analysis for 24 rice genotypes. The multivariate analysis of the quantitative traits identified the most similar genotypes as 12 × 14, 15 × 16 and 8 × 11 based on the dissimilarity coefficients, which suggests that hybridisation within these genotypes would not be effective because their genetic make-ups are almost too similar (). However, the 12 × 5 and 14 × 5 genotype crossings will be effective because these genotypes were identified as the most divergent. Fifty-eight rice varieties were grouped into four clusters based on 18 morphological characters in a study by Ahmadikhah et al. (Citation2008). The presence of strong differences among the 27 genotypes in the present study was also further confirmed by PCA. The first four principal components accounted for 79% of the total variation, which indicated very strong correlations between the examined characteristics (). Similarly, Worede et al. (Citation2014) explained 61.2% of the total variability using the first and second PCs. Approximately 82.7% of the total variation among 32 upland rice varieties was also explained by Lasalita-Zapico et al. (Citation2010). Our investigation highlighted that the genotypes that originated from the Philippines could be hybridised with the genotypes from Malaysia, Thailand, Vietnam, India or Bangladesh and vice versa to create broader genetic variation to improve yield and other favourable characteristics ().
The present study revealed the existence of a considerable level of diversity between the 27 blast-resistant genotypes. The greatest heritability and greatest genetic advance were recorded for the parameters of the number of filled grains/panicle and the yield/plant, which implies that these characteristics could be used to select upland accessions to achieve notable improvements in cultivation in changing environments, particularly in conditions of water scarcity in the tropics. The genotypes Chirikata 2, C, Choke Tang, BRRI dhan43 and BRRIdhan42 possess high yield potentials, mature early, and exhibit disease resistance and thus could be cultivated in blast-endemic areas. Furthermore, genotype crossings of IR 5533-55-1-11 × Chokoto 14 and IR 5533-PP 854-1 × Chokoto 14 could result in heterotic expression and substantial large variability in the segregating generations.
Disclosure statement
No potential conflict of interest was reported by the authors.
Additional information
Funding
References
- Abarshahr M, Rabiei B, Lahigi HS. 2011. Assessing genetic diversity of rice varieties under drought stress conditions. Not Sci Biol. 3:114–123.
- Ahmad F. 2014. Genetic diversity analysis of coloured upland rice germplasms using SSR markers, quantitative traits, and nutritional quality [MS Thesis]. Institute of Tropical Agriculture, Universiti Putra Malaysia.
- Ahmadikhah A, Nasrollanejad S, Alishah O. 2008. Quantitative studies for investigating variation and its effect on heterosis of rice. Int J Plant Prod. 2:297–308.
- Anwar MP. 2012. Strategies for weed suppression in aerobic rice cultivation [PhD Thesis]. Institute of Tropical Agriculture, Universiti Putra Malaysia.
- Anwar MP, Juraimi AS, Man A, Puteh A, Selamat A, Begum M. 2010. Weed suppressive ability of rice (Oryza sativa L.) germplasm under aerobic soil conditions. Aus J Crop Sci. 4(9):706–717.
- Borell A, Garside A, Shu FK. 1997. Improving efficiency of water use for irrigated rice in a semi-arid tropical environment. Field Crop Res. 52:231–248. doi: 10.1016/S0378-4290(97)00033-6
- Burton GW, DeVane EH. 1953. Estimating heritability in tall fescue (Festuca arundinacea) from replicated clonal material. Agron J. 45:478–481. doi: 10.2134/agronj1953.00021962004500100005x
- Chang TT, Loresto GC, Tagumpay O. 1972. Rice breeding, agronomic and growth characteristics of upland and lowland rice varieties. Los Baños: IRRI; p. 645–661.
- Fageria NK. 2007. Yield physiology of rice. J Plant Nutr. doi:10.1080/15226510701374831
- Fageria NK, Baligar VC, Jones CA. 2011. Growth and mineral nutrition of field crops. 3rd ed. Boca Raton, FL: CRC Press.
- Fageria NK, Carvalho MCS, dos Santos FC. 2014. Response of upland rice genotypes to nitrogen fertilization. Commun Soil Sci Plan. doi:10.1080/00103624.2014.911301
- Fageria NK, Moraes OP, Vasconcelos MJ. 2013. Upland rice genotypes evaluation for phosphorus use efficiency. J Plant Nutri. doi:10.1080/01904167.2013.818153
- Ferdous J. 2012. Morphological, nutritional and molecular characterization of selected genotypes of upland improvement through marker assisted backcross breeding [PhD Thesis]. Institute of Tropical Agriculture, Universiti Putra Malaysia.
- Hasegawa H. 2003. High yielding rice cultivars perform best even at reduced nitrogen fertilizer rate. Crop Sci. 43:921–926. doi: 10.2135/cropsci2003.9210
- Hien NL, Sarhadi WA, Hirata Y, Oikawa Y. 2007. Genetic diversity of morphological responses and the relationships among Asia aromatic rice (Oryza sativa L.) cultivars. Tropics. 16:343–355. doi: 10.3759/tropics.16.343
- International Rice Research Institute (IRRI). 1975. Major research in upland rice, varietal diversity and morpho-agronomic characteristics of upland rice. Los Banos (Philippines); p. 72–90.
- International Rice Research Institute. 1996. Standard evaluation system for rice. 4th edn. Manila: the Philippines.
- International Water Management Institute (IWMI). 2000. IWMI global water scarcity study. Colombo (Sri Lanka): International Water Management Institute.
- Jacquot M, Courtois B. 1987. The rice plant. In Upland rice. London: Macmillan; p. 96.
- Johnson HW, Robinson H, Comstock R. 1955. Estimates of genetic and environmental variability in soybeans. Agron J. 47:314–318. doi: 10.2134/agronj1955.00021962004700070009x
- Lasalita-Zapico FC, Namocatcat JA, Carĩno-Turner JL. 2010. Genetic diversity analysis of traditional upland rice cultivars in Kihan, Malapatan, Sarangani Province, Philippines using morphometric markers. Philipp J Sci. 139:177–180.
- Lin S, Dittert K, Sattelmacher B. 2002. The Ground Cover Rice production System (GCRPS) – a successful new approach to save water and increase nitrogen fertilizer efficiency. In: Bouman BAM et al. , editors. Water-wise Rice Production. Proceedings of the International Workshop on Water-wise Rice Production; 2002 Apr 8–11; Los Banos, Philippines.
- Mazid MS. 2013. Genetic divergence of rice genotypes resistant to bacterial blight revealed by quantitative traits and molecular markers [MS Thesis]. Institute of Tropical Agriculture, Universiti Putra Malaysia.
- Naher UA. 2009. Effects of root exudates on specific diazotroph-rice genotype association [PhD Thesis]. Faculty of Agriculture, Universiti Putra Malaysia.
- Osman KA, Mustafa AM, Ali F, Yonglain Z, Fazhan Q. 2012. Genetic variability for yield and related attributes of upland rice genotypes in semi arid zone (Sudan). African J Agric Res. 7(33):4613–4619. doi:10.5897/AJAR12.52
- Pandey P, Anurag PJ, Tiwari D, Yadav S, Kumar B. 2009. Genetic variability, diversity and association of quantitative traits with grain yield in rice (Oryza sativa L.). J Biosci. 17:77–82.
- Saito K, Linquist B, Atlin GN, Phanthaboon K, Shiraiwa T, Horie T. 2006. Response of traditional and improved upland rice cultivars to N and P fertilizer in northern Laos. Field Crops Res. 96:216–223. doi: 10.1016/j.fcr.2005.07.003
- Singh RK, Singh US, Khush GS. 2000. Aromatic rices. New Delhi: Oxford and IBH; p. 279.
- Sohrabi M, Rafii MY, Hanafi MM, Siti Nor Akmar SN, Latif MA. 2012. Genetic diversity of upland Rice Germplasm in Malaysia based on quantitative traits. Sci World J. doi:10.1100/2012/416291
- Stoop W, Uphoff N, Kassam A. 2002. A review of agricultural research issues raised by system of rice intensification (SRI) from Madagascar: opportunities for improving farming systems for resource-poor farmers. Agric Syst. 71:249–274. doi: 10.1016/S0308-521X(01)00070-1
- Tabbal DF, Bouman BAM, Bhuiyan SI, Sibayan EB, Sattar MA. 2002. On-farm strategies for reducing water input in irrigated rice: case studies in the Philippines. Agric Water Manage. 56:93–112. doi: 10.1016/S0378-3774(02)00007-0
- Tuhina-Khatun M, Hanafi MM, Wong MY, Rafii MY. 2015. Reactions and diversity analysis of upland rice genotypes against blast disease of rice (Oryza sativa L.). Australas Plant Path. doi:10.1007/s13313-015-0359-2
- Tuhina-Khatun M, Newaz MA, Bari MAA. 2007. Combining ability and heritability estimates in F2 diallel population of spring wheat under interacting environments. Bangladesh J Agr Sci. 34:75–82.
- Tuong TP, Bouman BAM. 2003. Rice production in water–scarce environments. In: Proceedings of the Water Productivity Workshop, Colombo, Sri Lanka, 12–14 Nov 2001.
- Ullah MZ, Bashar MK, Bhuiya MSR, Khalequzzaman M, Hasan MJ. 2011. Interrelationship and cause-effect analysis among morpho-physiological traits in Biroin rice of Bangladesh. Int J Plant Breed Genet. 5:246–254. doi: 10.3923/ijpbg.2011.246.254
- Vange T. 2009. Biometrical studies on genetic diversity of some upland rice (Oryza Sativa L.) accessions. Nat Sci. 7(1). ISSN 1545-0740. Available from: http://www.sciencepub.net
- WARDA-IRRI. Growing upland rice: a production handbook. In: Oikeh SO, Nwilene FE, Agunbiade TA, Oladimeji O, Ajayi O, Semon M, Tsunematsu H, Samejima H. editors. Africa Rice Center. Available from: http://www.irri.org/.
- Worede F, Srecwongchai T, Phumichai C, Srippichitt P. 2014. Multivariate analysis of genetic diversity among some rice genotypes using morpho-agronomic traits. J Plant Sci. 9(1):14–24. doi: 10.3923/jps.2014.14.24
- Yoshida S. 1981. Fundamentals of rice crop science. Los Banos (Philippines): International Rice Research Institute.