
ABSTRACT
The pattern of genetic diversity among 92 genotypes of soybean from 5 different origins/sources (Pakistan, the USA, Asian Vegetable Research Development Centre (AVRDC), Japan and North Korea) was analyzed using randomly amplified polymorphic DNA markers. Out of 20 random primers 6 tested, 10 were polymorphic among genotypes and they yielded 107 markers, with an average of 10.7 markers per primer. The proportion of polymorphic bands within genotypes ranged from 0.47 to 0.71 with an average of 0.59. Pakistani and US genotypes exhibited the highest number of polymorphic bands (95%), while North Korean genotypes revealed the lowest (60%). The mean band frequency of the primers among genotypes was 0.57 with a range of 0.08–0.99. The Shannon’s index and Nei’s genetic diversity index revealed that primer OPF-06 showed maximum genetic diversity among the genotypes. Dendrogram constructed using Unweighted Pair Group Mean Average (UPGMA) method divided the genotypes into 5 main groups consisting of 13 clusters. The results of cluster analysis indicated that the genetic diversity between Pakistani and US or AVRDC genotypes is much larger than that between Pakistani and North Korean or Japanese genotypes. The Pakistani genotypes had distinct bands from plant introductions. Therefore, the Pakistani genotypes may be useful to soybean breeders.
Introduction
In Pakistan, soybean is one of the non-conventional oilseed crops, which can be successfully grown in the country during both spring as well as the autumn seasons (Aslam et al. Citation1995). Although soybean as an oil crop was introduced in Pakistan along with sunflower, it was widely adopted by the farmers in the country. Soybean cultivation started declining in late 1980s due to marketing problems, non-availability of solvent industry, non-availability of varieties of suitable maturity group, problem of seed germination in high temperature areas, lack of awareness and poor demand (Agricultural statistics of Pakistan Citation2007). Due to lack of high yielding and early maturing varieties of soybean, the actual national average yield is 1/3 (1250 kg/ha) of the potential yield (Agricultural statistics of Pakistan Citation2007). Therefore, there is an immense need of exploring diverse genetic resources with wider genetic base, to identify superior genotypes for formulating future breeding strategy and to develop new high yielding and early maturing varieties to meet the national demand. New genotypes are an important source to help and meet our national food/oil demand as well as in the development of commercial varieties on the basis of desirable plant traits (Dong et al. Citation2001).
Genetic variation among traits is important for breeding and in selecting desirable types particularly in a newly introduced crop like soybean, which is not grown commercially in Pakistan (Malik et al. Citation2006). Manjarrez-Sandoval et al. (Citation1997) have shown that genetic variation for seed yield and other agronomic traits in soybean populations derived from crosses among elite lines can be limited by a lack of genetic diversity. There is still need to evaluate and conserve genetic resources, particularly for less recognized crop like soybean, which is grown as a non-conventional oilseed crop in Pakistan. Characterization of accessions for important traits will facilitate efficient synthesis of breeding populations that are designed to accomplish specific objectives. The study of their genetic diversity is invaluable for efficient utilization, conservation and management of germplasm collections (Dong et al. Citation2001).
Several types of molecular markers have been used to determine genetic divergence within and among plant species (Vierling & Nguyen Citation1992). Studies using recently developed molecular techniques have revealed much about the genetic diversity in soybean. Randomly amplified polymorphic DNAs (RAPDs) are well suited for diversity studies because they are technically simple, quick, non-radioactive, largely automatable, relatively inexpensive and require small amounts of DNA (Hedrick Citation1992). In spite of these benefits, consistency of results within and between laboratories is the main obstacle. This problem, however, has become less problematic as the mechanism of polymerase chain reaction (PCR) generating RAPD fragments is more understood (Weising et al. Citation1995).
However, studies on the genetic diversity of soybean have been limited in Pakistan. Most investigations have been focused on the variation based on morphological traits using a small set of soybean germplasm. To our knowledge, no studies have yet been made in Pakistan on the diversity in soybean germplasm based on DNA analysis. Therefore, the present research work was carried out to estimate the genetic diversity on the basis of DNA analysis using RAPD technique.
Materials and methods
The experimental material composed 92 soybean genotypes (30 elite lines of Pakistan, 30 genotypes of the USA, 4 genotypes of North Korea, 8 genotypes of Japan and 20 genotypes of Asian Vegetable Research Development Centre (AVRDC)) collected from Institute of Agro-Biotechnology and Genetic Resources (IABGR) and oilseed program of National Agricultural Research Center (NARC), Islamabad, Pakistan. The DNA was extracted from the seeds of each genotype using the following procedure as described by Kang et al. (Citation1998).
PCR amplification of extracted DNA
The PCR is a technique for the in vitro amplification of specific DNA sequence by the simultaneous primer extension. The reaction mixture containing 14 μl ddH2O, 2.0 μl PCR buffer (1×), 0.4 μl each dNTP (0.2 mM), 1.6 μl MgCl2 (2.0 mM), 0.8 μl RAPD primer (0.4 μM), 0.2 μl Taq polymerase (1 U) and 1 μl DNA (20–30 ng/μl) sample was used for the PCR analysis after screening of primers, 10 primers were used for the amplification of DNA. The primers used were OPA-02, OPA-08, OPA-10, OPC-10, OPI-16, OPD-08, OPF-13, OPE-09, OPF-06 and OPE-01.
The chemicals mentioned in were mixed in the required quantities in the 0.5 ml micro centrifuge tubes and 1 μl of DNA sample was carefully mixed in it. The PCR performed in a Perkin Elmer Cetus Thermocycler model 480 using the following profile:
Table 1. Reagents and their concentration for use in PCR amplification.
The data of amplified fragments of DNA were recorded after the electrophoresis on 1.6% agarose gel containing 0.48 g agarose, 0.6 ml 50 × Tris-acetate-EDTA, 29.4 ml dH2O and 1 μl ethidium bromide. The solution was mixed thoroughly and poured into the glass plates to let the gels polymerize. The samples containing 10 μl amplified DNA was placed in the wells. Electrophoresis at 100 constant voltage was run. The gel was placed in the UV transilluminator to visualize the bands and photographs were taken. Several cluster procedures have been used in molecular marker data analysis Unweighted Pair Group Mean Average (UPGMA), Ward’s and VARCLUS analysis are widely used procedures.
Results and discussion
In the present study, genetic diversity based on RAPD marker bands was calculated using computer software ‘pop gene’. Twenty primers were initially screened for their ability to produce polymorphic patterns and 10 of them were selected, which gave reproducible and distinct polymorphic amplified products (). The percentage of polymorphic bands within genotypes ranged from 46.7% to 70.5% with an average of 59% (). The 10 primers yielded 107 markers, with an average of 10.7 markers per primer. Ferreira et al. (Citation2000) also reported a range of 1–10 markers per primer. The genotype with the highest proportion of polymorphic bands was JA03830 (0.705), followed by US03853 (0.695) and NK03792 (0.686). The genotype with the lowest proportion of polymorphic bands was PK037551 (0.467), followed by PK03762 (0.476). Pakistani and US genotypes exhibited the highest 129 number of polymorphic bands, while North Korean genotypes revealed the lowest. The Pakistani genotypes had distinct bands from exotic genotypes. The mean band frequency of the primers among genotypes was 0.57 with a range of 0.08–0.99. Li and Nelson (Citation2002) reported that the mean frequency for the polymorphic RAPD fragments among all of the genotypes was 0.56. Xue et al. (Citation1998) also documented that genetic diversity existed among isolates from the same location as well as from different locations. Roman et al. (Citation2007) revealed a higher level of diversity among the genotypes based on RAPD.
Figure 1. Banding pattern of different genotypes revealed by PCR amplification of RAPD primers.
Table 2. Polymorphic bands (%) in soybean genotypes produced by 10 different primers.
Several thousand soybean genotypes have been evaluated for agro-morphological, seed and biochemical traits (Nelson et al. Citation1988; Juvik et al. Citation1989; Bernard et al. Citation1998). Plant breeders need to continuously explore valuable diversity in the germplasm. The classification of soybean germplasm has been carried out with molecular tools such as isozymes, proteins and DNA markers (Li & Nelson Citation2002). It has been shown that results of molecular analyses are in line with the information based on origin and pedigree (Griffin & Palmer Citation1995; Maughan et al. Citation1995; Thompson et al. Citation1998). Variability in RAPD profile is a common phenomenon because they are prepared from non-coding and conserved sequence, which may be absent or present in any genotypes (Jones et al. Citation1997).
Evaluation of genetic distances among the genotypes based on RAPD bands indicated that AV038587 and JA03826 (0.870) were most genetically distinct genotypes followed by five pair of genotypes, namely NK03816 and PK03769; AV038582 and PK03772; NARC-IV and PK03772; PK03903 and PK03772 and NK03816 and US03902 with a genetic distance of 0.847. The genotypes with least genetic distances were AV038584 and AV038586 (0.154), followed by NARC-III and NARC-V (0.177), AV038581 and AV038584 (0.197), AV038583 and AV038584 (0.197), AV03858 and AV038581 (0.211), US03896 and US03897 (0.211) and US03904 and US03906 (0.211). The lowest genetic identity value was given by the genotypes JA03826 and AV038587 (0.419) followed by the genotypes PK03772 and NARC-IV (0.429) and PK03772 and PK03903 (0.429). The genotypes showing the highest genetic identity values were AV038584 and AV038586 (0.857), followed by the genotypes AV038583 and AV038584 (0.819). The average genetic distance within the exotic genotypes was less than the average genetic distance within Pakistani genotypes. The highest mean genetic distance was recorded among the genotypes of Pakistan and the USA. The higher genetic distance values reflect higher genetic variability, while the lower values indicate lower genetic variability. The average pair wise difference (0.482) in the present study indicated that RAPD analysis gave a considerable level of diversity among the genotypes examined in this study. In some cases, RAPD markers revealed a small amount of genetic differences among the genotypes. Thompson et al. (Citation1998) reported the mean genetic distance of 0.56 among all genotypes.
The mean genetic distances among the genotypes belonging to same and different origins/sources were also calculated (). Minimum genetic distance (0.390) between different sources was found between the genotypes of the USA and AVRDC. Maximum mean genetic distance (0.586) between different origins/sources was observed between the genotypes of Pakistan and the USA. The North Korean genotypes revealed least within origin/source genetic diversity with mean genetic distance of 0.341, while the genotypes belonging to Pakistan showed highest within origin/source mean genetic distance (0.494). The genotypes having genetic resemblance showed smaller differences among them. On the contrary, genotypes produced from genetically distinct parents revealed large differences among them (Chowdhury et al. Citation2002). The results of this study suggested that the genotypes of exotic germplasm could be selected as parental material in future breeding program to improve Glycine genotypes in Pakistan. Some closely related pairs were from the same location, such as AV038584 and AV038586 and AV038583 and AV038584. While some distantly related pairs were also of same origin, for example, PK03772 and PK03903. It is likely that seed dispersal mediated by human activities and commercial exchanges in a limited area has caused this mixture (Huan et al. Citation2005).
Table 3. Mean genetic distances among genotypes within and between different origins/sources.
The results of data regarding DNA amplification () revealed that primer OPF-C10 produced highest number of bands (15), while the lowest bands (6) were yielded by primer OPA-02. Six of 10 primers generated more than average number of bands (10.7), namely OPF-06 (11), OPI-16 (12), OPD-08 (14), OPE-09 (14), OPE-01 (13) and OPC-10 (15). Rest of the four primers produced less than 10 bands. Total 105 polymorphic bands were obtained and the number of polymorphic bands within primers ranged from 6 (OPF-13 and OPF-A-02) to 15 (OPF-C10). The mean band frequency of the primers among genotypes was 0.57 with a range of 0.08 (OPA-10) to (OPE-01) 0.99. Primer OPD-08 revealed maximum mean band frequency (0.73) ranging from 0.48 to 0.98, while primer OPA-10 shown minimum mean band frequency (0.35) with a range of 0.08–0.96.
Table 4. RAPD primers, their sequence, total fragments produced, number of polymorphic bands (NPB) and mean band frequency (MBF).
Results regarding genetic diversity among genotypes using Shannon’s index () indicated that the highest value was shown by primer OPF-06 (0.67), followed by OPI-16 (0.64) and OPC-10 (0.64), while the lowest value was given by OPA-10 (0.45), followed by primer OPF-13 (0.48). The primers gave a range of 0.06–0.69 for Shannon’s index.
Table 5. Diversity among soybean genotypes based on Shannon’s and Nei’s diversity indices.
Results on genetic diversity among genotypes using Nei’s diversity index confirmed the results of Shannon’s index and indicated that primer OPF-06 (0.48) generated the highest value, followed by OPI-16 (0.45) and OPC-10 (0.45), while a low mean value of Nei’s genetic diversity index was given by OPA-10 (0.29), followed by primer OPF-13 (0.31). The primers gave a range of 0.06–0.50 for Nei’s genetic diversity index. Ferreira et al. (Citation2000) detected a normal distribution of allele frequency with a mean of 49.1% using RAPD markers. From the recording of bands, proper attention is needed to draw results based on small differences in band (Chowdhury et al. Citation2002). More investigations are needed for a detailed analysis on genetic variability of Glycine germplasm in Pakistan including approved varieties and advance lines by using not only of RAPD but also of the microsatellite or simple sequence repeat markers. Li and Nelson (Citation2002) indicated that limited genetic gains could be a major contributor in restricted genetic diversity in soybean breeding programs. Because of considerable levels of diversity in the present germplasm, these genotypes are potential sources of valuable genetic variation.
The results presented in show the presence of polymorphic bands in the genotypes on the basis of origin/source. The data showed that the highest number of bands (106) was given by the genotypes of the USA, AVRDC and Pakistan. The genotypes of the USA had maximum mean band frequency (0.58), followed by the genotypes of Pakistan (0.56). The minimum mean band frequency was shown by the check varieties (0.41). The range of band frequency was 0.0 (check varieties) to 0.78 (USA).
Table 6. Variation in banding pattern of primers based on origin/source in 92 genotypes of soybean.
Cluster analysis
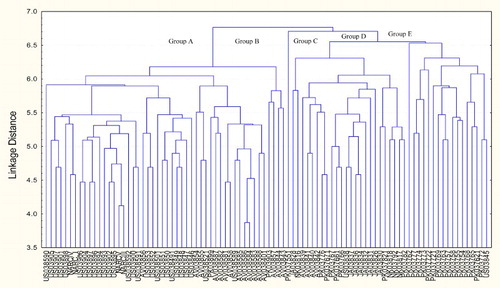
The dendrogram constructed using UPGMA method () divided the genotypes into 5 main groups consisting of 13 clusters. The results were not in agreement with Chowdhury et al. (Citation2002) who reported that cluster analysis based on 85 polymorphic bands separated soybean genotypes into 2 main groups, each included cultivars from all other origins. Kassinee et al. (Citation2005) also reported that genotypes classified into one major group and the other seven individual categories based on the numerous polymorphisms of DNA fingerprints. Group A consisted of three clusters, group B of one, group C of three, group D of one and group E comprised five clusters. Cluster I consisted of 26 genotypes of the USA and 1 of AVRDC. All the four checks were also in cluster I. Cluster II included 12 genotypes of AVRDC, 2 of the USA and 1 of Pakistan. Genotypes included in cluster III belonged to AVRDC and Pakistan. One Pakistani genotype each in clusters IV, VIII and X formed the cluster independently. Cluster V comprised only two genotypes, one each of Japan and North Korea. Along with six Japanese and five Pakistani genotypes, four genotypes of AVRDC and one of the USA were also included in cluster VI. Cluster VII contained one Japanese, two Pakistani and three North Korean genotypes. Last six clusters namely VIII, IX, X, XI, XII and XIII comprised only Pakistani genotypes except one genotype belonging to the USA, which was included in cluster XIII. The results depicted that majority of the genotypes of one origin/source were clearly differentiated from the genotypes of other origins/source based on RAPD bands. However, some of the genotypes of one origin/source tended to cluster with the genotypes of other origin/source. Therefore, it was observed that the groups formed by cluster analysis generally reflected the geographical regions of origin, but there was no clear relationship between the clustering pattern and the geographic distribution of the genotypes. Li and Nelson (Citation2002) and HuiJun et al. (Citation2003) also presented similar results. Based on the results of cluster analysis, the most diverse genotypes were suggested to be incorporated in future soybean breeding programs.
Figure 2. Dendrogram constructed by using UPGMA method based on RAPD bands of 92 genotypes produced by 10 primers.
Genes of both quantitative and qualitative traits can be tagged with the help of molecular markers. The probability of having useful variation to be present in Glycine and incorporated in improved cultivars will increase with the use of marker techniques and the ultimate recognition of particular loci vital for yield and its components (Li & Nelson Citation2002). RAPD could be used routinely by plant breeders to identify genetic variation, locate regions of the genome linked to agronomical important genes and facilitate introgression of desirable genes into commercial genotypes (Chowdhury et al. Citation2002).
The results of the present study provide breeders with both general and specific information to help identify useful genetic diversity from this germplasm. A considerably large genetic variation was observed among the local genotypes and the exotic germplasm of different origins/sources. The much greater genetic diversity within Pakistani genotypes than within other origins/sources demonstrates the potential that exists within these genotypes to improve the cultivated soybean. The genetic distinctness among these genotypes should be helpful for current and future breeding programs and in selection of genetically distinct parents for germplasm development. It is hoped that these identified genotypes of soybean cannot only be used for the further multiplication and dissemination among prospective soybean growers but can also provide a good based for widening the genetic base of soybean. The data can be used for future genome mapping program using advanced molecular techniques.
Disclosure statement
No potential conflict of interest was reported by the authors.
Notes on contributors
Dr Muhammad Faisal Anwar Malik was born in 1975 in Islamabad, Pakistan. In 2002, he completed his academic degree of M.Phil., in Biological Sciences with specialization in Plant Genetics Quaid e Azam University Islamabad, Pakistan. After completed his M.Phil. Degree, he joined Pakistan Agricultural Research Council as Scientific Officer. He was awarded Ph.D. Indigenous Scholarship by the Higher education Commission of Pakistan. He completed his doctorate degree in 2012 at Biological Sciences with specialization in Plant Genetics Quaid e Azam University Islamabad, Pakistan. His area of interest is Germplasm Screening and Evaluation, Hybridization/Breeding of Field Crops, Proteomics, Genomics, Cytogenetics, Plant Molecular Biology. He had started working in The University of Swabi as Assistant Professor of Plant Breeding and Genetics from September 2012 till date.
Dr Kaleem Tariq was born in 1985 in Nawabshah, Pakistan. In 2012, he completed his academic degree of M.Sc (Hons) in Agriculture with specialization in Entomology from Bahauddin Zakariya University Multan, Pakistan. He was awarded Ph.D. Scholarship in 2012 by the China Scholarship Council. He completed his doctorate degree in 2015 at Institute of Urban and Horticultural Entomology, Huazhong Agricultural University Wuhan, P.R. China. The topic of his dissertation was ‘Role of microRNAs in Spermatogenesis of Oriental Fruit fly Bactrocera dorsalis.’ He started working in Abdul Wali Khan University Mardan, Pakistan as Assistant Professor of Entomology from March 2016 till date. His area of interest is Insect Biochemistry and Molecular Biology.
Prof Dr Afsari S. Qureshi remained Chairperson Department of Biological Sciences, QAU, Islamabad since 2002. She was a seasoned professor of Genetics Quaid e Azam University Islamabad, Pakistan. She served several key posts in Quaid e Azam University for the last 30 Years; during her tenure she supervised several M.Phil., and Ph.D. students. At present she is enjoying retired life.
Dr Muhammad Rashid Khan was born in 1966 in Sargodha, Pakistan. In 1995, he completed his academic degree of M.Phil., in Biological Sciences with specialization in Genetics Quaid e Azam University Islamabad, Pakistan. He was awarded Ph.D. Indigenous Scholarship by the Higher education Commission of Pakistan. He completed his doctorate degree in 1999 at Biological Sciences with specialization in Genetics Quaid e Azam University Islamabad, Pakistan. His area of interest is Germplasm Screening and Evaluation, Hybridization/Breeding of Field Crops, Proteomics, Genomics, Cytogenetics, Plant Molecular Biology. He had started working in Quid e Azam University Islamabad as Assistant Professor of Genetics from September 2000 till date.
Dr Muhammad Ashraf was born in 1945. In 2006, he completed his academic degree of M.Phil., in Agriculture with specialization in Agronomy from American University Of Beirut, Lebanon. He completed his doctorate degree in 1983 at Agriculture with specialization in Soil Science from IRRI/University of Philippines, Los, Banios, Philippines. His area of interest is Rice Physiology. He is working is working as Director in National Research Institute Islamabad Pakistan from 1995 till date.
Dr Gul Naz was born in 1980 in Charsadda, Pakistan. In 1974, He completed his academic degree of M.Phil., in Agriculture with specialization in Agronomy from the University of Agriculture Peshawar, Pakistan. She was awarded Ph.D. Indigenous Scholarship by the Higher Education Commission of Pakistan. She completed his doctorate degree in 2016 at Agriculture with specialization from the University of Agriculture Peshawar, Pakistan. Her area of interest is Crop physiology and plant nutrition. She started working in University of Sawabi as lecturer of Agronomy from September 2013 till date.
Dr Asad Ali was born in 1977 in Swabi, Pakistan. In 2002, he completed his academic degree of M.Sc (Hons) in Agriculture with specialization in Entomology from the University of Agriculture Peshawar, Pakistan. He conducted his Master research on ‘Aphid species and percent parasitism of their parasitoids on wheat crop in KPK. Pakistan.’ After completed his Master degree, he joined Pakistan Agricultural Research Council as Scientific Officer. He was awarded Ph.D. Scholarship in 2007 by the Higher education Commission of Pakistan for Ph.D. He completed his doctorate degree in 2010 at Division of Biology, Imperial College London UK. The topic of his dissertation was ‘Multitrophic interactions in a potato-aphid system (p. 192).’ He had started working in The University of Swabi as Assistant Professor of Entomology from September 2011 till January 2015. Since February 2015, Dr Asad Ali works as Associate Professor and Chairman Department of Agriculture in Abdul Wali Khan University Mardan.
References
- Agricultural statistics of Pakistan. 2007. Agricultural statistics of Pakistan. Islamabad: Ministry of Food & Agriculture.
- Aslam M, Mirza M, Shah S, Shafeeq S, Naeem U. 1995. Crop production bulletin no. 6. Islamabad: Pakistan Agriculture Research Council.
- Bernard R, Cremeens C, Collins F, Krober O, Athow K, Laviolette F, Coble C, Nelson R. 1998. Evaluation of the USDA soybean germplasm collection: maturity groups. 000 IV FC 01547-PI 266807 USDA Tech Bull 1844.
- Chowdhury A, Tongpamnakc P, Srinivesb P, Saksoongd P, Chatwachirawongb P. 2002. Genetic relationship among exotic soybean introductions in Thailand: consequence for varietal registration. J Sci Soc Thail. 28:227–239. doi: 10.2306/scienceasia1513-1874.2002.28.227
- Dong YS, Zhuang BC, Zhao LM, Sun H, He MY. 2001. The genetic diversity of annual wild soybeans grown in China. Theor Appl Genet. 103:98–103. doi: 10.1007/s001220000522
- Ferreira AR, Foutz KR, Keim P. 2000. Soybean genetic map of RAPD markers assigned to an existing scaffold RFLP map. J Hered. 91:392–396. doi: 10.1093/jhered/91.5.392
- Griffin JD, Palmer RG. 1995. Variability of thirteen isozyme loci in the USDA soybean germplasm collections. Crop Sci. 35: 897–904. doi: 10.2135/cropsci1995.0011183X003500030045x
- Hedrick P. 1992. Shooting the RAPDs. Nature 335:679–680. doi: 10.1038/355679a0
- Huan NV, Sugimoto H, Harada K. 2005. Genetic variation of local varieties of soybean in the western part of the Shikoku Mountains in Japan. Breed Sci. 55:441–446. doi: 10.1270/jsbbs.55.441
- HuiJun D, CaiYing Z, LiJuan Z, Zhi-Ying M. 2003. Diversity study of soybean germplasm resources in Hebei Province with POD isoenzymes analysis and RAPD markers. Chin J Oil Crop Sci. 25:15–20.
- Jones CJ, Edwards KJ, Castaglione S, Winfield MO, Sala F, van de Wiel C, Bredemeijer G, Vosman B, Matthes M, Daly A, et al. 1997. Reproducibility testing of RAPD, AFLP and SSR markers in plants by a network of European laboratories. Mol Breed. 3:381–390. doi: 10.1023/A:1009612517139
- Juvik G, Bernard R, Chang R, Cavins J. 1989. Evaluation of the USDA wild soybean germplasm collection: maturity group. 000 IV PI 65549 PI 483464 USDA Tech Bull 1761.
- Kang HW, Cho YG, Yoon UH, Eun MY. 1998. A rapid DNA extraction method for RFLP and PCR analysis from a single dry seed. Plant Mol Biol Rep. 16:90–90. doi: 10.1023/A:1007418606098
- Kassinee S, Toshiyuki M, Nobuyuki O, Yusuke K. 2005. Classification of vegetable soybean cultivars by RAPD analysis. J Jpn Soc Agric Technol Manage. 12:69–74.
- Li Z, Nelson RL. 2002. RAPD marker diversity among cultivated and wild soybean accessions from four Chinese provinces. Crop Sci. 42: 1737–1744. doi: 10.2135/cropsci2002.1737
- Malik MF, Qureshi A, Ashraf M, Ghafoor A. 2006. Genetic variability of the main yield related characters in soybean. Int J Agric Biol. 6:815–819.
- Manjarrez-Sandoval P, Carter TE, Webb DM, Burton JW. 1997. RFLP genetic similarity estimates and coefficient of parentage as genetic variance predictors for soybean yield. Crop Sci. 37:698–703. doi: 10.2135/cropsci1997.0011183X003700030002x
- Maughan PJ, Saghi Maroof MA, Buss GR. 1995. Microsatellite and amplified sequence length polymorphisms in cultivated and wild soybean. Genome. 38:715–723. doi: 10.1139/g95-090
- Nelson R, Amdor P, Orf J, Cavins J. 1988. Evaluation of the USDA soybean germplasm collection: maturity groups. 000 IV PI 427136 PI 445845 USDA Tech Bull1726.
- Roman B, Hernandez R, Pujadas-Salva AJ, Cubero JI, Rubiales D, Satovic Z. 2007. Genetic diversity in two variants of Orobanche gracilis Sm. [var. gracilis and var. deludens (Beck) A. Pujadas] (Orobanchaceae) from different regions of Spain. Electron J Biotechnol. 10. Available from: http://www.ejbiotechnology.info/index.php/ejbiotechnology/article/view/v10n2-6/166. doi: 10.2225/vol10-issue2-fulltext-6
- Thompson JA, Nelson RL, Vodkin LO. 1998. Identification of diverse soybean germplasm using RAPD markers. Crop Sci. 38: 1348–1355. doi: 10.2135/cropsci1998.0011183X003800050033x
- Vierling RA, Nguyen HT. 1992. Use of RAPD markers to determine the genetic diversity of diploid, wheat genotypes. Theor Appl Genet. 84:835–838.
- Weising K, Nybom H, Wolf K, Mayer W. 1995. DNA fingerprinting in plants and fungi. London: CRC Press Inc.
- Xue ML, Qian Z, JinLing Q, MingHou Z, ShouYi C. 1998. Use of random amplified polymorphic DNA markers for the detection of genetic variation in Cercosporidium sojinum from northeast China. Acta-Phytopathol. Sin. 28:43–48.