
ABSTRACT
Bush tea (Athrixia phylicoides DC.) is a popular aromatic plant, indigenous to South Africa. For many decades, indigenous people have widely consumed the tea as a healthy beverage and a medicine. The objective of the study was to investigate the influence of nitrogen fertiliser application on the quality, pharmacological activities and metabolite profiles of the leaves and twigs of bush tea cultivated under greenhouse and field conditions. Treatments consisted of 0, 75, 150, 225, 300 and 375 kg/ha N, arranged in a randomised complete block design with five replicates. Parameters measured were leaf tissue nitrogen, total polyphenols, total flavonoids, total tannins, total antioxidants, antimicrobial activity and cytotoxicity. In addition, metabolites were identified and measured using gas chromatography linked to mass spectrometry (GC-MS) and liquid chromatography linked to mass spectrometry (LC-MS). The results of this study showed a significant quadratic response of total polyphenols, total flavonoids, total tannins and total antioxidants of bush tea leaves and twigs, irrespective of the growth environment ranging from 150 to 225 kg/ha N. The results further suggested that, despite the growing environment, nitrogen treatments did not improve the minimum inhibition concentration and minimum microbicide concentration of bush tea with extract concentrations ranging from 25.0 to 3.1 mg/g. Bush tea was found to be non-toxic (IC50 above 100) under both growing conditions, irrespective of nitrogen treatments. Despite trials being conducted under greenhouse and field conditions and with different nitrogen treatments, there were no distinct differences regarding the gas chromatography linked to mass spectrometry and liquid chromatography linked to mass spectrometry compounds. The future aims of the study are to investigate the effects of nitrogen fertilisation, the timing of nitrogen fertilisation and the planting density on the yield, quality, plant metabolites and pharmacological activity of field-grown bush tea.
Introduction
Bush tea contains 5-hydroxy-6,7,8,3′,4′,5′-hexamethoxy flavon-3-ol (Mashimbye et al. Citation2006), 3-0-demethyldigicitrin, 5,6,7,8,3′,4′-hexamethoxyflavone and quercetin, together with other polyphenols (Mudau et al. Citation2006, Citation2007), tannins (Mudau et al. Citation2007) and antioxidants (Mogotlane et al. Citation2007). Various other compounds that may also be responsible for bush tea’s medicinal importance include chlorogenic acid, 1,3-dicaffeoylquinic acid, several hydroxycinnamic acid derivatives, including dicaffeoyl quinic acids, and an unidentified flavone–hexose as well as 6-hydroxyluteolin-7-O-β-glucoside and quercetagetin-7-O-β-glucoside (De Beer et al. Citation2011), 3-0-demethyldigicitrin, 5,6,7,8,3′,4′-hexamethoxyflavone and quecertin (Mavundza et al. Citation2010), polymethoxylated flavones, quercetin-3–O-glucoside, a methoxylated derivative, two dicaffeoyl quinic acids and one coumaric acid ester (Reichelt et al. Citation2012), inositol, caffeic acid, quercetin, kaempferol, apigenin, hymenoxin, oleanolic acid, 7,7′-dihydroxy-8,8′-dimethoxy-3,3′-dimethyl-2,2′-binaphthalene-1,1,4,4-tetrone as well as scaposin (McGaw et al. Citation2013).
Bush tea has traditionally been used by various tribes in South Africa as a herbal tea (Lerotholi et al. Citation2017) for the treatment of ailments such as boils, acne, infected wounds, cuts, headaches and colds, and as a gargle to combat voice loss and throat infections (Fouché et al. Citation2006; Mudau et al. Citation2007). Rampedi and Olivier (Citation2005) report that rural people in South Africa used bush tea to treat hypertension, heart disease and diabetes. Olivier et al. (Citation2008) reported that the decoction of bush tea was still being used in rural areas in this country to treat illnesses such as high blood pressure and diabetes.
The quality of herbal tea is a critical factor in determining its price (Ravichandran and Parthiban Citation1998). Free amino acids are regarded as an important quality component of tea, and 26 varieties of amino acids have been found and identified in the tea plant (Camelia sinensis). Most of the amino acids in tea leaves are theanine, glutamic acid, aspartic acid, serine, glutamine, alanine, arginine and threonine (Cheng et al. Citation2009). Worldwide, tea consumption has attracted much interest because of the reported health benefits (Du Toit et al. Citation2001). Bush tea contains compounds such as polyphenols, flavonoids and tannins which are natural, common antioxidant products found in medicinal plants (Sytar et al. Citation2016). In addition, polyphenols, flavonoids and tannins are regarded as indicators of the medicinal potential of herbal teas (Hirasawa et al. Citation2002; Patel et al. Citation2010; Veeru et al. Citation2009). These compounds also improve the quality of the tea (Owour et al. Citation2000). It has been reported that some of the compounds found in bush tea are able to modulate taste qualities, resulting in the tea being consumed with less sugar (Lerotholi et al. Citation2017). In contrast to Camelia sinensis, bush tea does not contain caffeine or pyrolizidine alkaloids (McGaw et al. Citation2007) and may thus be considered a healthier alternative beverage. Moreover, bush tea is aromatic and also accumulates essential oils (Möller et al. Citation2006). It is therefore reported to be a potential source of nutraceutical antioxidant extracts (De Beer et al. Citation2011).
The application of nitrogenous fertilisers increases photosynthetic rates (Haukioja et al. Citation1998), non-structural carbohydrate accumulation (Wanyoko Citation1983) and the biosynthesis of carbon- and nitrogen-based specialised metabolites (Haukioja et al. Citation1998), in addition to enhancing the quality of tea leaves (Owour et al. Citation1991, Citation2000). Previous studies demonstrated that high levels of nitrogen, reaching a maximum of 300 kg/ha N (Mudau et al. Citation2006), improved the quality of potted bush tea cultivated under shade nets. Previous studies conducted on wild harvested bush tea demonstrated that bush tea extract contained minimal antimicrobial activities (Tshivhandekano et al. Citation2014). It is, however, unknown whether nitrogen fertilisation would improve the quality and pharmacological activity of bush tea grown in both a greenhouse and a field environment. Studies of bush tea cultivated in both greenhouse and field environments have not been conducted simultaneously, and compared with limited metabolic profiling using nitrogen strategies for agronomic practices. The objective of this study was therefore to investigate the influence of nitrogen fertiliser application on the quality, pharmacological activities and metabolite profiles of the leaves and twigs of bush tea cultivated under greenhouse and field growth conditions.
Materials and methods
Experimental site
The experiments were conducted in both the greenhouse and the field. The greenhouse trial was carried out at the science campus of the University of South Africa (UNISA) in Florida (5.26°9′501″S and 27°54′113″E). The field trial was conducted in Mamelodi (east of Pretoria), at the Mothong community engagement project (25°41′51″S and 28°20′20″E). Due to the vigorous growth of bush tea, the trials were conducted during spring and summer seasons. Weather data for the field trial are presented in .
Table 1. Weather data of field-cultivated bush tea in Mamelodi, Pretoria, Gauteng Province, South Africa.
Plant materials
The plant materials were collected from Haenertsburg (23°56′S and 29°54′E; 890 m.a.s.l) in South Africa’s Limpopo province. Plants were propagated using cuttings, as described by Mudau et al. (Citation2006). Bush tea cuttings were planted in plastic trays with sand as the growth medium. The cuttings were placed on a mist bed and allowed to sprout and root.
Greenhouse trial design and treatment details
The greenhouse trial was conducted under thermostatically regulated temperatures ranging from 20°C to 24°C, and 60% relative humidity. Average canopy responses in photosynthetic active radiation (PAR) and chlorophyll content within the growing season ranged from 134.38 to 157.24 W m2 and 30.96 and 44.65 µmol/m2, respectively. Rooted cuttings from the mist bed were subsequently transplanted into 1 L plastic bags with sand used as growing medium, and kept in the greenhouse. Rooted cuttings in the greenhouse were further transplanted to 5 L plastic bags with sand used as growing medium. Treatments consisted of 0, 75, 150, 225, 300 and 375 kg/ha N, which are equivalent to 0, 0.75; 1.5; 2.25, 3 and 3.75 g per plastic bag. The treatments were arranged in a randomised complete block design with five replicates. Limestone ammonium nitrate (28% N) was applied as N fertiliser source. All plants were fertilised with 75 kg/ha phosphorus (P) and 45 kg/ha potassium (K) and the fertiliser source for P was single superphosphate (10.5%) and K as potassium chloride (50%). The micronutrient was foliar, applied as recommended by Maedza et al. (Citation2017). Automated sprinkler irrigation was used to supplement water availability to the plants.
Field trial design and treatment details
The well matured bush tea, harden in the shade nets after propagation were later transplanted to fields for open field using plant spacing of 0.5 × 0.5 m. Treatments were applied three weeks after plant establishment, and arranged as follows: 0, 75, 150, 225, 300 and 375 kg/ha N per plot, in a randomised complete block design with five replicates. Limestone ammonium nitrate (28% N) was applied as N fertiliser source. All plants received 75 kg/ha P and 45 kg/ha K, the fertiliser source for P was single superphosphate (10.5%) and K was potassium chloride (50%). Micronutrients were foliar, applied as recommended by Maedza et al. (Citation2017). The soil characteristics of the field site are indicated in , with low soil total nitrogen (N). A drip irrigation system was used to supplement the water supply.
Table 2. Chemical characteristics of soils collected from the field experimental site during the 2014–2015 growing season.
Harvesting and preparation of bush tea twigs and leaves
The bush tea leaves and twigs from both greenhouse and field trials were harvested during the autumn season (four months from the planting date) as a standard agronomic practice when bush tea reaches full maturity. The harvested leaves and twigs were freeze-dried for two weeks. Thereafter, they were blended separately according to N treatment. Hundred gram (100 g) of blended leaf materials was soaked in 150 ml of ethanol and shaken at room temperature for 24 h. The ethanol supernatant was filtered and then evaporated in a rotary evaporator under reduced pressure at 37°C. The extracts were stored at 5°C, after which they were subjected to analyses of total antioxidant activity, antimicrobial activity, cytotoxicity, total polyphenols, total flavonoids and total tannins.
Nitrogen analysis of twig and leaf tissue
The freeze-dried bush tea leaves and twigs, harvested from both greenhouse and field trials, were finely ground to pass through a 20-mesh screen. A sample of 0.2 g was digested at 37°C for 1 h in 100 ml tubes containing 4 ml of concentrated sulfuric acid, 2 ml of 30% hydrogen peroxide and 2.5 g catalyst, which comprised a powdered mixture of 15 g copper sulfate, 250 g potassium sulfate and stearic acid (Anon Citation1972). Following digestion, 100 ml of distilled water was added to each sample and the hydrated samples were filtered through Whatman® No. 2 filter paper. Filtered samples were bottled and stored at −20°C prior to analysis. Nitrogen concentrations of thawed samples were determined using an auto-analyzer (Technical Industrial Systems Citation1972) connected to a Sanplus segmented flow analysis system (Skalar, The Netherlands) and expressed as a percentage of N dry mass.
Determination of total polyphenols content
The total polyphenol content was determined by colorimetric assay (Mohammed and Manan Citation2015). A 200 μL extract of bush tea leaves and twigs was added to 800 μL of distilled water, followed by 100 μL of Folin–Ciocalteu reagent. The mixtures were incubated for 3 min at room temperature. A 300 μL volume of a sodium carbonate (Na2CO3) solution (20% w/v) was added to the mixture and incubated at room temperature for 2 h in a dark room. Subsequently, the absorbance at 765 nm was recorded using a Metertech UV/VIS SP8001 spectrophotometer. A blank was prepared with distilled water. A garlic acid equivalent (GAE) standard curve (0–200 mg/L) was prepared using the same method. The total phenolic content was calculated from the standard curve and expressed as GAE/g dry matter.
Determination of total flavonoid content
The flavonoid content was analyzed by colorimetric analysis (Mohammed and Manan Citation2015). A 200 μL extract of bush tea leaves and twigs was added to 150 μL of a sodium nitrite (NaNO2) solution (5% w/v) and incubated for 6 min at room temperature. After incubation, 150 μL of an aluminum chloride hexahydrate (AlCl3.6H2O) solution (10% w/v) was added and again incubated for another 6 min at room temperature. After the second incubation, 800 μL of NaOH solution (10% w/v) was added and again incubated at room temperature for 15 min. For a negative control, distilled water replaced the extract. Absorbance at 510 nm was determined using a Metertech UV/VIS SP8001 spectrophotometer. A standard curve was prepared using 0–500 mg/ml of quercetin equivalent (QE) dissolved in 80% ethanol. The total flavonoid content was QE/g dry matter.
Determination of total tannin content
The tannin content was determined using the Folin–Ciocalteu assay method (Mohammed and Manan Citation2015). A 100 μL extract of bush tea leaves and twigs was added to 750 μL of distilled water, 500 μL Folin–Ciocalteu reagent and 1000 μL of a 35% sodium carbonate (Na2CO3) solution. The mixture was diluted with distilled water to 10 ml, shaken and incubated for 30 min at room temperature. Subsequently, the absorbance at 725 nm was read using a Metertech UV/VIS SP8001 spectrophotometer. Garlic acid equivalent (GAE) standard solutions were prepared using the same method. Distilled water replaced the extract and was used as negative control. The total tannin content was calculated based on the prepared standard curve with 0–100 mg GAE and expressed as GAE/g dry matter.
Determination of antioxidant activity
Method described by Du Toit et al. (Citation2001) was employed to determine the antioxidant content of the plant extracts as well as that of Vitamin C so as to have a basis for comparison. 2 mg of plant extract was dissolved in 200 µl of ethanol to give a stock concentration of 10 mg/ml while 2 mg of vitamin C was dissolved in 1 ml of ethanol to give a stock concentration of 2 mg/ml which would serve as the positive control. The 20 mg of Free radical 1,1-diphenyl-2-picrylhydrazyl (DPPH) was dissolved in 500 ml ethanol to give a stock concentration of 0.04 mg/ml. All the samples were tested in triplicates on 96-well microtitre plates. The start-up concentration for the test samples in the first row were 500 µg/ml which is a composition of distilled water and the extract, while the positive control (vitamin c) was a mixture of distilled water and vitamin C with the final concentration of 100 µg/ml in the first row. Blank controls were prepared by adding ethanol to distilled water and negative controls also had test samples and distilled water. These were serially diluted from the first row to the last row, and DPPH was added into all the wells except the negative controls. The plates were covered in foil and incubated for 30minutes. The absorbencies were read with ELISA plate reader (KC junior) at 515 nm. GraphPad Prism software was used to analyze the data. For antioxidant activity treatments, the sum of squares was partitioned into linear or quadratic polynomial orthogonal contrasts using SAS version 9.4.
Microbial species used
The microbial strains used included the gram-negative bacteria Escherichia coli (ATCC 8739), Klebsiella oxytoca (ATCC 49131), Proteus vulgaris (ATCC 6380), Serratia marcescens (ATCC 13880), Salmonella typhi (ATCC 14028) and Klebsiella pneumonia (ATCC 13883), as well as the gram-positive bacteria Staphylococcus aureus (ATCC 25931). The selected microorganisms were grown in a casein-peptone-soy agar medium (Merck (Pty) Ltd). The McFarland standard was employed to record the microbial concentration of 4 × 10⁷ CFU/ml (Dey et al. Citation2010).
Antimicrobial assay
The micro dilution technique, using a 96-well micro-plate, as described by Eloff (Citation1998), was used to obtain the minimum inhibition concentration (MIC) and minimum microbicide concentration (MMC) values of the ethanol extracts of bush tea leaves and twigs against the selected microorganisms. The MIC is defined as the highest dilution or lowest concentration of the extract that inhibits the growth of organisms (Sen and Batra Citation2012). The MMC was recorded as the lowest concentration of extract that inhibited 100% growth of the microorganisms (Cohen et al. Citation1998). Extracts were serially diluted in the 96-well plate and the final concentration of extracts and positive controls (Ciprofloxacin) ranged from 0.196 to 25 mg/ml. The 48 h-old microorganisms were added to the 96-well plates and incubated for 24 h at 37°C. The MIC was determined by adding 40 μL of a 0.2 mg/ml solution of p-iodonitrotetrazolium violet (Sigma-Aldrich, South Africa) to micro-plate wells and incubating them at 37°C for 24 h. After incubation, the MMC was determined by adding 50 μL of the suspensions from the wells that did not show any growth after incubation during MIC assays, to 150 μL of fresh broth. These suspensions were re-incubated at 37°C for another 24 h. Finally, 40 μL of the above p-iodonitrotetrazolium violet solution (Sigma-Aldrich, Johannesburg, South Africa) was added to the micro-plate wells and incubated at 37°C for 2 h to complete the MMC assay.
XTT cytotoxicity assay
The cytotoxicity of methanol extracts of bush tea leaves and twigs was tested using the method described by Twilley et al. (Citation2017). The bush tea extract was tested on human embryonic kidney (HEK) 293 cells. One hundred microliter of HEK cell suspension (1 × 10⁵ cells/ml) were added to the inner wells of a 96-well plate and 200 µL of incomplete medium (Dulbecco’s modified Eagle’s medium) to the outer wells. The plates were incubated for 24 h to allow the cells to attach to the base of the plate. The serial dilution of the plant extracts (already dissolved in DMSO), the positive control (actinomycin D) and negative (vehicle) control (DMSO) with the complete medium [10% fetal bovine serum (FBS), Dulbecco’s Modified Eagle’s Medium (DMEM) and penicillin/streptomycin (PS)] were carried out in a 24-well plate to give eight different concentrations of each sample and a final volume of 1 ml per well. One hundred microliters of each concentration from the 24-well plate were added to the 96-well plate in triplicates, with a triplicate medium control and a DMSO control for each extract. A reference plate was prepared to account for the colour of the plant extracts. This plate contained the plant extracts and medium in duplicates, but no cells. The plates were incubated for 72 h, after which 50 µL of XTT (2,3-bis-(2-methoxy-4-nitro-5-sulfophenyl)-2H-tetrazolium-5-carboxanilide) reagent from ROCHE® was added to all the wells and again incubated for about 2 h 30 min. After incubation, the plates were read on an ELISA microplate reader with KC Junior software at 450 and 690 nm as the reference wavelength. GraphPad Prism software was used to analyze the data.
Gas chromatography linked to mass spectrometry (GC-MS)
Bush tea samples (one leaf per sample) were analyzed using head space solid phase micro-extraction gas chromatography linked to mass spectrometry (HS-SPME-GC-MS), using a method similar to that described by Musarurwa et al. (Citation2010), but oven ramping temperatures and injection ratios were modified. The HS-SPME of leaves was performed with Supelco SPME fibres (DVB/Carboxen/PDMS, StableFlex). Leaves were placed directly into a 20 ml headspace vial and sealed with an aluminium-coated silicone rubber septum. Volatiles were extracted at 70°C for 15 min. Gas chromatography was performed with a Waters GCT Premier AS 2000 instrument, coupled to a mass spectrometer equipped with a HP5 column (30 m, 0.25 mm ID, 0.25 ml film thickness). Temperatures were set at 250°C for both the injection (splitless injection) and the ion source temperature. Helium was used as the carrier gas at a flow rate of 1 ml/min. The temperature ramp regime was initiated by heating at 5°C for 3 min, followed by an oven ramp to 142°C at 5°C/min and a second ramp of 1°C/min up to 240°C. A mass scanning range of 40–550 m/z (perfluorotri-N-butylamine as mass reference) was employed and mass spectra were recorded at two scans. The NIST library was used in the tentative identification of compounds.
Liquid chromatography linked to mass spectrometry (LC-MS)
The method employed was that described by Nkomo et al. (Citation2014). Briefly, extracts were suspended in 1 ml of a 50% (v/v) mixture of acetonitrile and H2O containing 0.1% (v/v) formic acid. The suspensions were vortexed for 1 min, then sonicated for 5 min and vortexed again for a minute prior to spinning at 10 000 rpm for 10 min. Four hundred microliters of the supernatant were pipetted into an LC-MS vial containing a guide. From the vials, 3 μL of supernatant was injected into the LC-MS instrument. Metabolites were separated using a gradient of H2O with 0.1% formic acid (solvent A) and acetonitrile (solvent B), using a Waters UPLC at a flow rate of 0.4 ml/min on a Waters BEH C18, 2.1 × 50 mm column. Mass spectrometry data were obtained on a Waters SYNAPT™ G2 MS (Manchester, England) using electron spray ionisation (ESI) running in positive mode with a cone voltage of 15 V. The injections were repeated once, to ensure repeatability. Despite trials being conducted under greenhouse and field conditions, no distinct differences were found between all compounds. Therefore, the data were again pooled and only materials from the field trials were subjected to LC-MS.
Statistical analyses
The analysis of variance was done using the general linear model of Statistical Analyses System (SAS) version 9.4. Treatments’ sum of squares were partitioned in linear and quadratic polynomial contrast in all variables measured. In both seasons, data were pooled and mean separation was done using Duncan Multiple Range Tests. For GC-MS, Kovats indices were also calculated from an alkane series to verify compound names. Further analysis of identified compounds was done using SIMCA 14 to generate principal component analysis (PCA) to reveal any qualitative differences between the treatments, and the SAS version 9.4 was used for the analysis of variance (ANOVA; P ≤ 0.05) followed by Tukey’s test. Data were transformed prior to the ANOVA; the square root of the means plus one method was applied. For LC-MS, Chemstation software was utilised to perform a PCA to assess any qualitative differences in compound peaks detected between treatments.
Results
Total leaf tissue nitrogen
and show that there was a significant quadratic response in the nitrogen content of bush tea leaf and twig tissues in response to nitrogen treatments, reaching a maximum at 225 kg/ha N in both greenhouse and field-cultivated harvested bush tea. Most of the response for both greenhouse and field trials occurred at 75 kg/ha N. The differences between the highest and lowest values were 2.4% for the greenhouse trial and 2.2% for the field trial.
Table 3. Response of phytochemical constituents of nitrogen-treated bush tea in a greenhouse environment.
Table 4. Response phytochemical constituents of nitrogen-treated bush tea under field conditions.
Total polyphenols
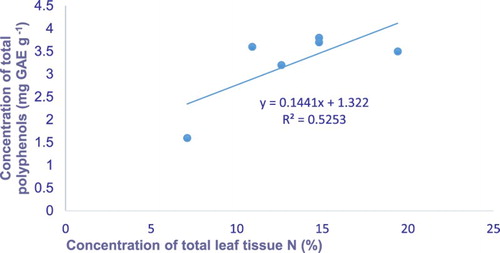
The leaves and twigs of bush tea grown in the greenhouse environment exhibited a significant linear response of total polyphenols to nitrogen treatment, reaching a maximum at 375 kg/ha N (). Hence, field-harvested bush tea leaves and twigs exhibited a significant quadratic response of total polyphenols to N treatments, reaching a maximum at 150 kg/ha N (). In both greenhouse and field trials, most of the response occurred at 150 kg/ha N. However, the difference between the highest and lowest total polyphenol content was 5.7 GAE/g dry matter for greenhouse trials and 12.3 GAE/g dry matter for field-grown bush tea.
Total flavonoids
and show a significant quadratic increase in the flavonoids of bush tea leaves and twigs in response to nitrogen treatment, reaching a maximum at 150 kg/ha N in greenhouse and 75 kg/ha N in field-harvested bush tea leaves and twigs. Most of the response of both the greenhouse and the field trial occurred at 75 kg/ha N. The difference between the highest total flavonoids was 34 QE/g dry matter for the greenhouse trial and 78.3 QE/g dry matter for the field trial.
Total tannins
and indicate a significant quadratic nitrogen response of tannins in the leaves and twigs of bush tea harvested under greenhouse and field conditions, reaching a maximum at 150 kg/ha N for the greenhouse and 75 kg/ha N for the field trial. Most of the response occurred at 75 kg/ha N. The differences between the highest and lowest values were 7.9 GAE/g dry matter in bush tea grown in the greenhouse environment and 25.9 GAE/g dry matter in bush tea grown under field conditions.
Antioxidant activity
The leaves and twigs of bush tea harvested from the greenhouse and field environments respectively, exhibited a significant quadratic total antioxidant response in relation to nitrogen treatments, reaching a maximum at 75 kg/ha N in the greenhouse trial and 150 kg/ha N in the field trial ( and ). Most of the response for both greenhouse and field trials occurred at the 75 kg/ha N treatment level. The differences between the highest and lowest values were13.2 and 34 μg/ml for the field trial.
Relationship between leaf tissue nitrogen and phytochemicals
There was a positive relationship between bush tea leaf tissue N and total polyphenols in both the greenhouse and field-harvested bush tea leaves and twigs ( and ). The results suggest that there was an enhancement in bush tea leaf carbon-based secondary compounds such as polyphenols, total flavonoids, total tannins and total antioxidants in response to nitrogen treatment.
Figure 1. Least squares regressions leaf nitrogen against leaf total polyphenols concentration of the bush tea leaves harvested from the greenhouse trial.
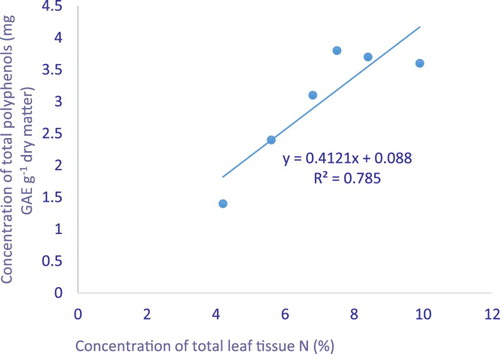
Figure 2. Least squares regressions leaf nitrogen against leaf total polyphenols concentration of the bush tea leaves harvested from the field trial.
Antimicrobial activity
The application of 150 kg/ha N resulted in a significant inhibition of E. coli by bush tea extract, compared to high levels ranging from 225 to 375 kg/ha N. The application of N in the range of 0–375 kg/ha did not influence the inhibition of K. oxytoca, K. pneumoniae, P. vulgaris, S. typhi, S. marcescens and S. aureus by bush tea extract. A higher bush tea extract concentration was required for MIC and MMC than for ciprofloxacin ( and ). There was no relationship between leaf tissue nitrogen and both the MIC and MMC values of bush tea leaves and twigs, irrespective of growth conditions. This suggests that nitrogen treatments under both greenhouse and field conditions did not influence the antimicrobial activity of bush tea.
Table 5. Minimum inhibition (MIC) concentration of nitrogen-treated bush tea on selected micro-organisms.
Table 6. Minimum microbicide concentration (MMC) of nitrogen-treated bush tea on selected micro-organisms.
Cytotoxicity of bush tea
The cytotoxicity results are expressed as IC50, which is the maximum effective concentration required to inhibit 50% of the HEK cells. Bush tea was found to be non-toxic under both cultivation conditions, irrespective of N treatment ().
Table 7. Field-harvested bush tea cytotoxicity in relation to nitrogen nutrition.
Gas chromatography linked to mass spectrometry and liquid chromatography linked to mass spectrometry (LC-MS)
Despite trials being conducted under greenhouse and field conditions, no distinct differences were found between all compounds. Therefore, data were pooled and only the GC data from field trials were used. The relative abundance of compounds detected in bush tea arboreal samples from different nitrogen application treatments are presented in . Data from GC-MS analyses revealed no distinct groupings according to nitrogen treatment, as is evident from the PCA and loadings plot ((A,B)), where similar results found with LC-MS data are shown. Thus, no discernible chemotypic variation could be directly linked to nitrogen treatment. For the qualitative differences that were observed between the treatments and the control, see .
Figure 3. (A) PCA of GC-MS Athrixia phylicoides arboreal samples, (B) Loadings plot of bush tea arboreal samples.
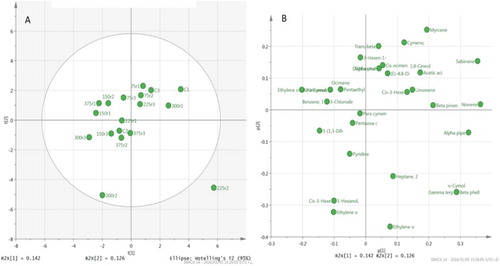
Table 8. Compound detected and concentrations using GC-MS on nitrogen-treated bush tea.
Discussion
The total leaf tissue nitrogen concentration exhibited in showed similar trends to those previously reported by Mudau et al. (Citation2006) on bush tea cultivated under 50% shaded nets. The results also concur with the findings reported by Ibrahim et al. (Citation2011), that N fertilisation significantly improved the leaf tissue nitrogen content of Labisia pumila grown under glasshouse conditions. Ibrahim et al. (Citation2011) reported that an increase in leaf tissue nitrogen resulted from the intensification of nitrate content in the leaf. Similarly, Venkatesan et al. (Citation2004) reported that the N content of the uppermost leaf of the tea plant significantly increased as dose of N applied reaching maximum at 300 kg/ha.
The total polyphenols results of the current study concur with the findings of Mogotlane et al. (Citation2007), who reported a significant increase in total polyphenols as well as a significant linear relationship between leaf tissue N and tannin content in potted bush tea cultivated under a 50% shade net. The results in also suggest that there was a strong trade-off in nutrients channelled towards the production of total phenolics, despite the fact that the nitrogen treatment plateaued at 300 kg/ha N. Conversely, Owour and Odhiambo (Citation1994) reported that a higher application level of 450–600 kg/ha N decreased the total polyphenols in Camellia sinensis. Ibrahim et al. (Citation2011) reported less production of phenolics and flavonoids as more N applied up to 270 kg/ha N.
The results in contradict the findings of Koricheva et al. (Citation1998) and Felgines et al. (Citation2000), who reported that the enhancement of total plant flavonoids and phenolics usually occurred when the plant was deficient in nitrogen nutrition. Conversely, the total tannins are in sharp contrast with the findings of Nchabeleng et al. (Citation2012), who reported different concentrations of bush tea total tannins according to growth locations. The results did, however, exhibit a similar trend to those reported by Chabeli et al. (Citation2008), where nitrogen application plateaued at 300 kg/ha N in bush tea cultivated in pots under 50% shade nets.
The total antioxidant results depicted in are in agreement with those reported by Nchabeleng et al. (Citation2012), who found no significant differences in the total antioxidant content of bush tea from locations with different climatic and soil factors. Similarly, Mogotlane et al. (Citation2007) reported a significant decrease in total antioxidant activity with 300–500 kg/ha N applications. This suggests that there was possibly a trade-off between the synthesis of other secondary compounds such as phenolic acids and protein.
The findings in are in sharp contrast to the carbon nutrients balance hypothesis, which postulates a decrease in the concentrations of carbon-based compounds by enhancing the availability of nutrients (Bryant et al. Citation1983). This contrast could be due to the assumption by Hamilton et al. (Citation2001) and Nitao et al. (Citation2002) that plants respond to varying levels of resource availability in a physiologically passive manner, driven by simple mass-action. In addition, Palumbo et al. (Citation2006) argue that, although phenotypic plasticity in secondary metabolite production is influenced by resource availability, it is also subject to selective pressures, which suggests that it might be genetically regulated and possibly be adaptive. Similar to the findings in , it has been reported that the mineral nutrition of cultivated tea promotes a higher synthesis of total polyphenols (Owour Citation1989; Owour and Odhiambo Citation1994).
The current results show a positive relationship between leaf tissue nitrogen and the total polyphenols of leaves and twigs of bush tea harvested from both greenhouse and field trial environments ( and ). Similarly, Mudau et al. (Citation2007) reported a linear relationship between leaf tissue nitrogen and total polyphenols. The finding of a weak relationship between leaf tissue nitrogen and total flavonoids, total tannins, total antioxidants and leaf nitrogen concurs with that of Mansfield et al. (Citation1999), who reported no relationship between the leaf tissue nitrogen and secondary compounds.
The current results in and demonstrate that antimicrobial activity was consistent with previous results of wild harvested bush tea reported by Tshivhandekano et al. (Citation2014). The authors found that bush tea possesses antimicrobial activity in different zones, depending on the microbial species tested. The study by Zongo et al. (Citation2010) showed that Gram-positive bacteria are highly sensible to plant extracts and their component. Similarly, Konaté et al. (Citation2015) reported that Trichilia emetica inhibited Staphylooccus aueus (Gram-positive) rather than Gram-negative bacteria. Extracts having activities where MIC values were below 8 mg/ml were considered to possess some antimicrobial activity (Van Vuuren Citation2008). By contrast, Thembo et al. (Citation2010) reported that an MIC greater than 1.6 mg/ml is classified as weak and shows that nitrogen treatments did not alter the potency of the extracts. The weak antimicrobial activity results were in contrast to reports on the widespread use of bush tea as treatment for infections, suggesting that it may, in fact, possess a strong antimicrobial activity (Lerotholi et al. Citation2017). Conversely, Osuagwu and Edeoga (Citation2010) reported a significantly increased antimicrobial activity of the leaves of Ocimum gratissimum and Gongronema latifolium through fertiliser treatment.
The cytotoxicity of bush tea (see ) concurs with the findings reported by Mavundza et al. (Citation2010), who showed that the quercetin compound extracted from bush tea exhibited a minimal toxicity effect, with IC50 value of 81.38 ± 0.33 μg/ml. The IC50 of all the bush tea extracts was reported to be higher than that of actinomycin D, which was used as positive control. Considering that the values of these extracts of bush tea were higher than those of actinomycin and greater than 100 μg/ml, they were considered safe (Patel et al. Citation2010). Despite trials being conducted under both greenhouse and field conditions, there was no distinct difference in the cytotoxicity results.
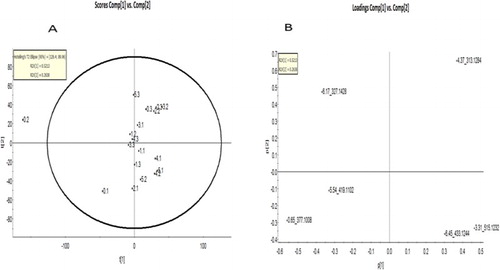
No groupings were observed in the PCAs (see (A,B), and (A,B)) of both the GC-MS and LC-MS data (). This suggests that nitrogen treatment did not influence the chemotypic profiles. The metabolic pathways involved in the production of the bioactive antioxidants were not significantly affected by the effects of nitrogen nutrition. However, significant qualitative differences were observed in the compounds that were detected, which would concur with the results of Ibrahim et al. (Citation2011), as in their study nitrogen applied above 90 kg/ha N reduced the secondary metabolite levels. In this study, no trend could be observed with the different treatment levels – neither a linear increase nor a decrease in compound quantities, albeit that there were significant qualitative differences.
Figure 4. (A) PCA of A. phylicoides arboreal samples run on LC-MS, (B) Loadings plot of the bush tea LC-MS sample.
In conclusion, irrespective of the growing environment of bush tea, the chemical concentration of total polyphenols, total flavonoids, total tannins and total antioxidants of bush tea leaves and twigs exhibited an increase in response to nitrogen nutrition, reaching a maximum at 150 kg/ha N. The antimicrobial activity of bush tea treated with nitrogen was generally classified as weak. The minimum inhibition concentration values ranged between 3.1 and 12.5 mg/ml, while the minimum microbicide concentration ranged between 6.3 and 25 mg/ml. No cytotoxicity effect was evident from any of the nitrogen treatments. The metabolite profiles using GC-MS and LC-MS revealed no significant phytochemical profile differences due to the nitrogen treatments. Nitrogen nutrition ranging from 75 to 375 kg/ha N did not influence the PCAs of either the LC-MS or the GC-MS chemotypic groupings.
Disclosure statement
No potential conflict of interest was reported by the authors.
Notes on contributors
Itani Tshivhandekano is a PhD candidate in Agriculture at the University of South Africa.
Dr. Wonder Ngezimana is a Senior lecturer in the department of crop sciences at the University of Zimbabwe, Marondera College of Agricultural Sciences and Technology. His research focus areas includes plant nutrition and indigenous medicinal plants.
Dr. Thilivhali E. Tshikalange is a senior Lecturer in the Department of Plant and Soil Sciences of the University of Pretoria, South Africa. His research focus areas include Bioactivity of ethno-botanical selected medicinal plants and wild edible plants.
Nokwanda P. Makunga is Associate Professor at Stellenbosch University's Department of Botany and Zoology. Her main research focus is on medicinal plant biotechnology.
Fhatuwani N. Mudau is Professor and Chair of the Department of Agriculture and Animal Health at the University of South Africa. Medicinal and aromatic plants and biotechnology are his main research focus areas.
Additional information
Funding
References
- Anon. 1972. Technicon auto analyser. Industrial Method. 2:98–70W.
- Bryant JP, Chapin FS, Klein DR. 1983. Carbon/nutrient balance of boreal plants in relation to vertebrate herbivory. Oikos. 40:357–368. doi: 10.2307/3544308
- Chabeli PM, Mudau FN, Mashela PW, Soundy P. 2008. Effects of nitrogen, phosphorus and potassium nutrition on seasonal tannin content of bush tea (Athrixia phylicoides DC.). S Afr J Plant and Soil. 25:79–83. doi: 10.1080/02571862.2008.10639899
- Cheng S, Xu F, Wang Y. 2009. Advances in the study of flavonoids in Ginkgo biloba leaves. J Med Plants Res. 3:1248–1252.
- Cohen MA, Husband MD, Yoder SL, Gage JW, Roland GE. 1998. Bacterial eradication by clinafloxacin, CI-990, and ciprofloxacin employing MBC test, in-vitro time kill and in-vivo time-kill studies. J Antimicrob Chemother. 41:605–614. doi: 10.1093/jac/41.6.605
- De Beer D, Joubert E, Malherbe CJ, Brand DJ. 2011. Use of counter current chromatography during isolation of 6-hydroxyluteolin-7-O-B-glucoside, a major antioxidant of Athrixia phylicoides. J Chromatogr. 1218:6179–6186. doi: 10.1016/j.chroma.2010.12.096
- Dey SK, Banerjee D, Chattapadhyay S, Karmakar KB. 2010. Antimicrobial activities of some medicinal plants of West Bengal. Int J Pharma Bio Sci. 1:1–10.
- Du Toit R, Volsteedt Y, Apostolides Z. 2001. Comparison of the antioxidant content of fruits, vegetables and teas measured as vitamin C equivalents. Toxicol. 166:63–69. doi: 10.1016/S0300-483X(01)00446-2
- Eloff JN. 1998. A sensitive and quick microplate method to determine the minimal inhibitory concentration of plant extracts for bacteria. Planta Med. 64:711–713. doi: 10.1055/s-2006-957563
- Felgines C, Texier O, Morand C, Manach C, Scalbert A, Regerat F, Remesy C. 2000. Bioavailability of the flavone naringenin and its glycosides in rats. Amer J Physiol Gastrointest Liver Physiol. 279:1148–1154. doi: 10.1152/ajpgi.2000.279.6.G1148
- Fouché G, Khorombi E, Kolesnikova N, Maharaj VJ, Nthambeleni R, Van der Merwe M. 2006. Investigation of South African plants for anticancer properties. Pharmacologyonline. 3:494–500.
- Hamilton JG, Zangerl AR, DeLucia EH, Berenbaum MR. 2001. The carbon-nutrient balance hypothesis: its rise and fall. Ecol Lett. 4:86–95. doi: 10.1046/j.1461-0248.2001.00192.x
- Haukioja E, Ossipov V, Koricheva J, Honkanen T, Karsson S, Lempa K. 1998. Biosynthetic origin of carbon-based secondary compounds: cause of variable responses of woody plants to fertilization. Chemoelogy. 8:133–139.
- Hirasawa M, Takada K, Makimura M, Otake S. 2002. Improvement of periodontal status by green tea catechin using a local delivery system: a clinical pilot study. Altern Med Rev. 37:433–438.
- Ibrahim MH, Jaafar HZE, Rahmat A, Rahman ZA. 2011. Effects of nitrogen fertilization on synthesis of primary and secondary metabolites in three varieties of Kacip fatimah (Labisia pumila Blume). Int J Mol Sci. 12:5238–5254. doi: 10.3390/ijms12085238
- Konaté K, Yomalan K, Sytar O, Brestic M. 2015. Antidiarrheal and antimicrobial profiles extracts of the leaves from Trichilia emetica Vahl. (Meliaceae). Asian Pac J Trop Biomed. 5(3):242–248. doi: 10.1016/S2221-1691(15)30012-5
- Koricheva J, Larsson S, Haukioja E, Keinanen M. 1998. Regulation of woody plant secondary metabolism by resource availability: hypothesis means by meta-analysis. Oikos. 83:212–226. doi: 10.2307/3546833
- Lerotholi L, Chaudhary SK, Combrinck S, Viljoen A. 2017. Bush tea (Athrixia phylicoides): A review of the traditional uses, bioactivity and phytochemistry. S Afr J Bot. 110:4–17. doi: 10.1016/j.sajb.2016.06.005
- Maedza KV, Nkomo M, Ngezimana W, Makunga NP, Mudau FN. 2017. Response of phytochemicals in bush tea (Athrixia phylicoides DC.) as influenced by selected micronutrients. HortScience. 52(7):965–971. doi: 10.21273/HORTSCI11353-16
- Mansfield JL, Curtis PS, Zak DR, Pregitzer KS. 1999. Genotypic variation for condensed tannin production in trembling aspen (Populus tremuloides, Salicaceae) under elevated CO2 and in high- and low-fertility soil. Amer J Bot. 86:1154–1159. doi: 10.2307/2656979
- Mashimbye MJ, Mudau FN, Soundy P, Van Ree T. 2006. A new flavonol from Athrixia phylicoides (bush tea). S Afr J Chem. 59:1–2.
- Mavundza EJ, Tshikalange TE, Lall N, Hussein AA, Mudau FN, Meyer JJM. 2010. Antioxidant activity and cytotoxicity effect of flavonoids isolated from Athrixia phylicoides. J Med Plants Res. 4:2583–2586.
- McGaw LJ, Bagla VP, Steenkamp PA, Fouche G, Olivier J, Eloff NJ, Myer MS. 2013. Antifungal and antibacterial activity and chemical composition of polar and non-polar extracts of Athrixia phylicoides determined using bioautography and HPLC. BMC Complement. Altern Med. 13:356–367.
- McGaw LJ, Steenkamp V, Eloff JN. 2007. Evaluation of Athrixia Phylicoides (bush tea) for cytotoxicity, antioxidant activity, caffeine content and presence of pyrrolizidine alkaloids. J Ethnopharmacol. 110:16–22. doi: 10.1016/j.jep.2006.08.029
- Mogotlane ID, Mudau FN, Mashela PW, Soundy P. 2007. Seasonal responses of total antioxidant contents in cultivated bush tea (Athrixia phylicoides L.) leaves to fertilizer rates. Med Aromat Plant Sci Biotechnol. 1:77–79.
- Mohammed S, Manan AF. 2015. Analysis of total phenolics, tannins and flavonoids from Moringa oleifera seed extract. J Chem Pharm Res. 7:132–135.
- Möller A, Du Toit ES, Soundy P, Olivier J. 2006. Morphology and ultrastructure of glandular and nonglandular trichomes on the leaves of Athrixia phylicoides (Asteraceae). S Afr J Plant and Soil. 23:302–304. doi: 10.1080/02571862.2006.10634769
- Mudau FN, Soundy P, Du Toit ES. 2007. Nitrogen, phosphorus, and potassium nutrition increases growth and total polyphenol concentrations of bush tea in a shaded nursery environment. HortTechnol. 17:107–110.
- Mudau FN, Soundy P, Du Toit ES, Olivier J. 2006. Variation in polyphenolic content of Athrixia phylicoides (L.) (bush tea) leaves with season and nitrogen application. S Afr J Bot. 72:398–402. doi: 10.1016/j.sajb.2005.10.007
- Musarurwa HT, van Staden J, Makunga NP. 2010. In vitro seed germination and cultivation of the aromatic medicinal Salvia stenophylla (Burch. Ex Benth) provides an alternative source of α-bisabolol. Pl Gro Reg. 61:287–295. doi: 10.1007/s10725-010-9476-7
- Nchabeleng L, Mudau FN, Mariga IK. 2012. Effects of chemical composition of wild bush tea (Athrixia phylicoides DC.) growing at locations differing in altitude, climate and edaphic factors. J Med Plants Res. 6:1662–1666. doi: 10.5897/JMPR11.1453
- Nitao JK, Zangerl AR, Berenbaum MR. 2002. CNB: requiescat in pace? Oikos. 8:540–546.
- Nkomo M, Katerere DR, Vismer HF, Cruz T, Balayssac S, Malet-Martino M, Makunga NP. 2014. Fusarium inhibition by wild populations of the medicinal plant Salvia africana-lutea L. linked to metabolomic profiling. BMC Complement. Altern Med. 14:99.
- Olivier J, Symington EA, Jonker CZ, Rampedi IT, Van Eeden TS. 2008. Comparison of the mineral composition of leaves and infusions of traditional and herbal teas. S Afr J Sci. 108:623–629.
- Osuagwu GGE, Edeoga HO. 2010. Effect of fertilizer treatment on the antimicrobial activity of the leaves of Ocimum gratissimum (L.) and Gongronema latifolium (Benth). Afr J Biotechnol. 9:8918–8922.
- Owour PO. 1989. Black tea quality: effects of some agronomic practices tea quality. Tea. 10:134–136.
- Owour PO, Ng’etich KW, Obanda M. 2000. Quality response of clonal black tea to nitrogen fertiliser, plucking interval and plucking standard. J Sci Food Agr. 80:439–446. doi: 10.1002/(SICI)1097-0010(200003)80:4<439::AID-JSFA546>3.0.CO;2-2
- Owour PO, Odhiambo HO. 1994. Response of some black tea quality parameters to nitrogen fertiliser rates and plucking frequencies. J Sci Food Agr. 66:555–561. doi: 10.1002/jsfa.2740660421
- Owour PO, Othieno CO, Robinson JM, Baker K. 1991. Response of tea quality parameters to time of year and nitrogen fertilizer. J Sci Food Agr. 55:111–446.
- Palumbo MJ, Putz FE, Talcott ST. 2006. Nitrogen fertilizer and gender effects on the secondary metabolism of yaupon, a caffeine-containing North American holly. Ecophysiology. Oecologia. doi:10.1007/s00442-006-0574-1.
- Patel VR, Patel PR, Kajal SS. 2010. Antioxidant activity of some selected medicinal plants in Western region of India. Adv Biol Res. 4:23–26.
- Rampedi I, Olivier J. 2005. The use and potential commercial development of Athrixia phylicoides. Acta Academica. 37:165–183.
- Ravichandran R, Parthiban R. 1998. Changes in enzyme activities (polyphenol oxidase and phenylalanine ammonialyase) with type of tea leaf and during black tea manufacture and the effect of enzyme supplementation of dhool on black tea quality. Food Chem. 62:277–281. doi: 10.1016/S0308-8146(97)00220-3
- Reichelt KV, Hoffmann-Lücke P, Hartmann B, Weber B, Ley JP, Krammer GE, Swanepoel KM, Engel KH. 2012. Phytochemical characterization of South African bush tea (Athrixia phylicoides DC.). S Afr J Bot. 83:1–8. doi: 10.1016/j.sajb.2012.07.006
- Sen A, Batra A. 2012. Evaluation of antimicrobial activity of different solvent extracts of medicinal plant: Melia azedarach L. Int J Curr Pharm Res. 4:67–73.
- Sytar O, Hemmerich I, Zivcak M, Rauh C, Brestic M. 2016. Comparative analysis of bioactive phenolic compounds composition from 26 medicinal plants. Saudi J Biol Sci. ( Article in press.) doi:10.1016/j.sjbs.2016.01.036.
- Technical Industrial Systems. 1972. Technicon AutoAnalyser II. Industrial Method No 98-70W. Tarrytown (NY): Technical Industrial Systems.
- Thembo KM, Vismer HF, Nyazema NZ, Gelderblom WCA, Katerere DR. 2010. Antifungal activity of four weedy plant extracts against selected mycotoxigenic fungi. J Appl Microbiol. 109:1479–1486. doi: 10.1111/j.1365-2672.2010.04776.x
- Tshivhandekano I, Ntushelo K, Ngezimana W, Tshikalange TE, Mudau FN. 2014. Chemical compositions and antimicrobial activities of Athrixia phylicoides DC. (bush tea), Monsonia burkeana (special tea) and synergistic effects of both combined herbal teas. Asian Pac J Trop Med. 7:S448–S453. doi: 10.1016/S1995-7645(14)60273-X
- Twilley D, Langhansová I, Palaniswamy D, Lall N. 2017. Evaluation of traditionally used medicinal plants for anticancer, antioxidant, anti-inflammatory and anti-viral (HPV-1) activity. S Afr J of Bot. 112:494–500. doi: 10.1016/j.sajb.2017.05.021
- Van Vuuren SF. 2008. Antimicrobial activity of South African medicinal plants. J Ethnopharmacol. 119(2008):462–472.
- Veeru P, Kishor MP, Meenakshi M. 2009. Screening of medicinal plant extracts for antioxidant activity. J Med Plants Res. 3:608–612.
- Venkatesan S, Murugesan S, Ganapathy MNK, Verma DP. 2004. Long-term impact of nitrogen and potassium fertilizers on yield, soil nutrients and biochemical parameters of tea. J Sci Food Agric. 84:1939–1944. doi: 10.1002/jsfa.1897
- Wanyoko JK. 1983. Fertilizer on tea: nitrogen – a review. Tea. 4:28–35.
- Zongo C, Savadogo A, Ouattara L, Bassole IHN, Ouattara CAT, Ouattara AS. 2010. Polyphenols content, antioxidant and antimicrobial activities of Ampelocissus grantii (Baker) Planch. (Vitaceae): a medicinal plant from Burkina Faso. Int J Pharmacol. 6:880–887. doi: 10.3923/ijp.2010.880.887