
ABSTRACT
The recent drought in South Africa has reduced the production of both dryland and irrigated wheat. This study evaluated physiological traits of irrigated wheat genotypes in response to water stress (WS) imposed at different growth stages. A 8 × 2 × 3 [(genotypes) × (water treatmets; stresses and non-stressed) × (growth stages; tillering, flowering and grain filling)] factorial experiment based on a randomised complete block design with three replicates was conducetd. In general, the rate of photosynthesis was unaffected by WS except for genotypes LM43 at tillering and LM98 at grain filling. Stomatal conductance (SC) and transpiration rate (Tr) followed the same treand except for genotype LM35 which reduced its SC and Tr significantly at grain filling. Instantaneous waster use efficiency (IWUE) of genotype LM35 and LM57 was unaffected (p > 0.05) by WS at tillering but at flowering stage it was affected. However, at grain filling IWUE was affected (p < 0.05) in genotypes LM35, ML57, LM79 and LM 98. The relative water content was unaffected at tillering except for LM35 and LM47 genotypes whereas at flowering LM57, ML79, LM83 and LM98 were affected. These results indicate some degree of drought tolerance of these genotypes at different growth stages.
Introduction
Drought is the major factor limiting wheat (Triticum aestivum L.) production worldwide and has been the main reason for reduced yield in recent years (Mancosu et al. Citation2015; Daryanto et al. Citation2016). The production of irrigated wheat under water limiting conditions has become a major contributor to the total wheat production in South Africa compared with dryland wheat production (Fourie and Botha Citation2011). However, increasing drought occurrences in recent years has caused water shortages, which pose a challenge to the frequent use of irrigation water (WRC Citation2015, Citation2016). Drought incidences have resulted in the lowering of the country's major water supplying dams and some parts of the country being listed as disaster areas (WRC Citation2015, Citation2016). Therefore, leading to the restriction of water use across the country (Turton et al. Citation2016).
Alternative strategies such as withholding water at certain irrigation intervals can assist in maximising wheat production under limited water conditions. On the other hand, this could result in crop failure as insufficient water at water stress sensitive growth stages reduces productivity (Tabassam et al. Citation2014). Tillering, flowering and grain filling have been reported to be sensitive growth stages in wheat production (Nayyar and Walia Citation2003; Ram et al. Citation2013; Sokoto and Singh Citation2013). However, due to the physiological mechanisms, which are governed by the genetic makeup of each genotype, some of these growth stages can cope with water stress in tolerant wheat genotypes (Blum Citation2005; Farooq et al. Citation2009; Hanin et al. Citation2011). These are referred to as response mechanisms and include; drought escape, dehydration avoidance, and drought tolerance (Blum Citation2005; Farooq et al. Citation2009; Tekle and Alemu Citation2016). Accumulation of proline and oxygen free radicals are other indicators of responses of genotypes to water stress.
Proline content is the amino acid that accumulates in plants when they are subjected to water-stressed conditions together with the relative water content, rate of photosynthesis, stomatal conductance, transpiration rate and water use efficiency have been used as water stress physiological indices in many studies (van Heerden and de Villiers Citation1996; El Hafid et al. Citation1998; Hayat et al. Citation2012). The different reactions of these traits to water stress at different growth stages of wheat genotypes have been able to assist researchers in identifying water stress tolerant growth stages in irrigated wheat genotypes (Ashraf and Khan Citation1993; Akram Citation2011; Saeidi et al. Citation2015). However, such research is still lacking in South Africa. Therefore, it is important to study the physiological responses of the newly developed wheat genotypes to further improve their performance under water stress conditions. Hence, the present study was conducted to select water stress tolerant irrigated wheat genotypes through evaluating the response of their physiological traits after water stress at tillering, flowering and grain filling.
Materials and methods
Experimental description, design, plant material and agronomic practices
A greenhouse experiment was conducted during the 2015/16 winter season in a tunnel at the University of KwaZulu-Natal, Pietermaritzburg, South Africa (29° 37′'S, 30° 24′E). The average day and night temperatures in the tunnel were 30°C and 18°C, respectively, while the relative humidity ranged between 45%–55%. Temperature and relative humidity were monitored electronically using a data logger (HOBO 2K logger, Onset Computer Corporation, Bourne, USA). Based on soil analysis conducted prior to planting, the soil texture was clay loam with P (18 mg/), K (188 mg/l), Ca (1300 mg/l), Zn (5 mg/l), Mn (73 mg/l), Cu (15.1 mg/l), pH (4.64), organic carbon (2.1%) and total N (0.19%). Nitrogen, phosphorus and potassium were applied in 160 kg ha−1; 20 kg ha−1 and 0 kg ha −1, respectively using urea (46%) and single superphosphate (10.2%) to meet crop nutritional requirement (Brady and Weil, Citation2008). Weeds were removed by hand, weekly throughout the growing the period.
Eight wheat genotypes (LM35, LM66, LM47, LM83, LM79, LM57, LM43 and LM98) were evaluated under two water regimes (well irrigated and water-stressed). An 8 × 2 × 3 factorial arrangement in a randomised complete block design (RCBD) was laid out with three replicates. The studied genotypes were subjected to water stress at the beginning of each growth stage (tillering, flowering and grain filling) by removing the drippers and relieved of water stress at the end of these growth stages by placing back the drippers. The beginning and final phase of each growth stage were determined using a high descriptive growth scale referred to as the Zadoks scale (Zadoks et al. Citation1974; ARC-SGI Citation2014). The control was irrigated to field capacity. Soil moisture was monitored with a Time Domain Reflectometer probe (Campbell Scientific Inc. USA) in both water regimes.
Leaf gas exchange traits
The stomatal conductance (gs), the rate of photosynthesis (Pn), transpiration rate (Tr) and instantaneous water use efficiency (IWUE) were measured under full sunlight using the LI-6400 XT Portable Photosynthesis System (Licor Bioscience, Inc. Lincoln, Nebraska, USA) (Allahverdiyev et al. Citation2015). The flag leaf was placed on the sensor of the machine; this was done at the end of the stressing period in each growth stage for both stressed and well-watered genotypes.
Relative water content
The relative water content was measured in daytime using the flag leaf of each genotype in all growth stages (tillering, flowering, and grain filling) after water stress for the stressed and non-stressed genotypes. Three plants per genotype were selected randomly. The flag leaf was removed from each plant using secateurs. The leaves were placed in sealed plastic bags and transferred to the laboratory immediately to minimise the loss of leaf moisture. Fresh weights were measured within two hours after removal. The turgid weight was weighed after soaking the leaves in distilled water for 18 h at room temperature below 20°C and under low light conditions. The soaked leaves were then quickly and carefully blotted with tissue paper and the turgid weight was determined. Dry weight was measured after oven drying the leaf samples for 48 h at 85°C (Boutraa et al. Citation2010). The relative water content was calculated as follows:Where, RWC is the relative water content.
Proline analysis
Proline was determined on the flag leaves of each genotype after the water stress period in each growth stage and replicate under both treatments in the three growth stages (Bates et al. Citation1973). The leaves were collected in daytime, placed in labeled zip lock bags and transferred to the laboratory. The samples were preserved in a freezer at −65°C. After a week, the leaves were then removed from the freezer and freeze-dried (lyophilisation; cryodesiccation) for 48 h at −56°C using Virtis Benchtop freeze dryer system (ES Model, SP Industries Inc., Warminster, USA) (Bates et al. Citation1973). The dried samples were ground to a powder using a mortar and pestle containing liquid nitrogen and 0.5 g of each sample was inserted in labeled test tubes (Bates et al. Citation1973). A 10 ml of 3% sulfosalicylic acid was prepared by mixing 30 g of sulfosalicylic acid powder with 1 l of water. The mixture was added to the 0.5 g ground leaf samples. The mixture of each sample was then homogenised for one minute using a stirrer (ULTRA-TUR-RAX, IKA® T25 digital, Staufen, Germany) to completely break down the cells in the ground leaf samples (Bates et al. Citation1973). The homogenised mixture was then filtered using glass wool. A 2 ml of the filtrate was reacted with 2 ml of acid ninhydrin and 2 mL of glacial acetic acid (Bates et al., Citation1973). The reaction mixture was then placed in an ultrasonic bath (Labotec, Model No. 132, Labotec (PTY) LTD, Johannesburg, South Africa) at 100°C for one hour thereafter; 4 ml of toluene was added to each sample (Bates et al. Citation1973). The reaction mixture was then shaken vigorously for 15–20 s using Vortex mixer (Heidolph, Germany). Using toluene for blank, the absorbance was read at 520 nm in a UV-1800 spectrophotometer (Shimadzu Corporation, Kyoto, Japan). The proline concentration was calculated as follows.Where, 115.5 is the molecular weight of proline (Bates et al. Citation1973).
Data analysis
The collected data was subjected to the analysis of variance (ANOVA) using GenStat® 18th Edition (VSN International, Hemel Hempstead, UK). Mean separation was done using Tukey’s test at 5% probability level. Correlation analysis of the measured traits was done with the principal component analysis (PCA) based on correlation matrix and biplots were plotted for both water stress and well-irrigated conditions.
Results and discussion
Rate of photosynthesis
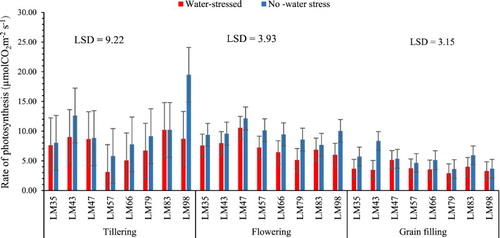
The genotypes maintained similar (p > 0.05) rate of photosynthesis in all growth stages except for LM98 and LM43 stressed at tillering and grain filling stage, respectively (). This may imply that all the studied genotypes were tolerant to water stress in all growth stages but LM98 may be sensitive to water stress at tillering stage while on the other hand, LM43 may be sensitive to water stress at grain filling. These results contradict those of Wang et al. (Citation2016) who found that there was a significant decrease in the rate of photosynthesis when wheat genotypes (Xinong 979 and larger-spike wheat) are subjected to water stress at tillering, flowering and grain filling. However, the findings of this study are supported by some of the results and conclusion made by Wang et al. (Citation2016) that the rate of photosynthesis is not affected by water stress if the studied genotypes have growth stages that are water stress tolerant. This suggests that the unaffected rate of photosynthesis in the studied genotypes maybe an indication of the genotype level of tolerance to water stress during that specific growth period.
Figure 1. The rate of photosynthesis after water stress at different growth stages of wheat genotypes. n = 8.
Transpiration rate and stomatal conductance
Water stress at tillering and flowering did not have any significant effect (p > 0.05) on the stomatal conductance and transpiration rate of all genotypes (). After water stress at grain filling only genotype LM35 indicated to be affected by water stress for both transpiration rate and stomatal conductance (). These results suggest that the studied genotypes were tolerant to water stress at the three growth stages. Allahverdiyed (Citation2015) indicated that there is a strong relationship between the transpiration rate and stomatal conductance, which explained the same trend observed in the results of this study ().
Figure 2. Effect of water stress at different growth stages on the stomatal conductance and transpiration rate of irrigated wheat genotypes. n = 8.
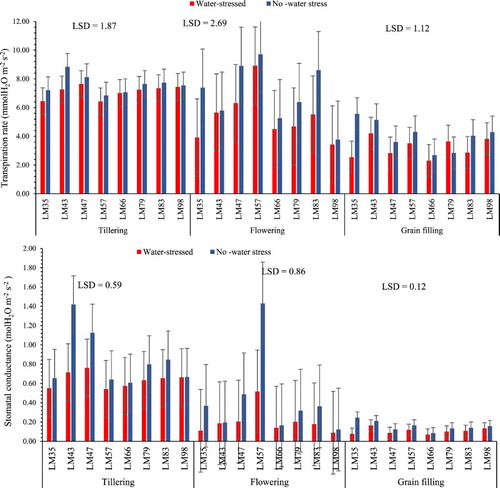
Genotypes that maintain a high stomatal conductance and transpiration rate after water stress at each growth stage are considered tolerant (Gomes et al. Citation2004; Lisar et al. Citation2012). Hence, it may be concluded in this study that the studied genotypes may withstand water stress at all growth stages of wheat development. The insignificant effect of water stress on the transpiration rate at all growth stages contradict those of Heinemann et al. (Citation2011), who found that when water stress is imposed at tillering, flowering or grain filling, the most effective response of the crops is a decline in the transpiration rate and stomatal conductance to reduce the rate of water loss.
These results also contradict those of Lisar et al. (Citation2012) and Boutraa et al. (Citation2010) who discovered that the rate of transpiration is reduced when wheat genotypes (Al-gaimi, Sindy-1, Sindy-2, Hab-Ahmar) are exposed to limited water conditions at flowering, tillering or grain filling. However, they are in line with those of Damayanthi et al. (Citation2010), who justified that genotypes that maintain a high rate of transpiration and stomatal conductance after water stress at flowering, tillering and grain filling growth stage are water stress tolerant. The results of this study can be further explained by the fact that the studied genotypes were bred to be highly tolerant to water stress and the duration of the stress imposed in each growth stage may not have been severe enough to result in a significant effect.
Instantaneous water use efficiency
Higher instantaneous water use efficiency was recorded in the well-irrigated genotypes at all growth stages (). However, when water stress was imposed at tillering the instantaneous water use efficiency of genotype LM66, LM47, LM83, LM57 and LM98 were reduced (p < 0.05) by 71%, 33%, 34%, 46% and 57%, respectively. Water stress at flowering stage only influenced (p < 0.05) genotype LM35 and LM43 with 71% and 74% less instantaneous water use efficiency correspondingly. Whereas, after water stress at grain filling a reduction (p < 0.05) in instantaneous water use efficiency was evident in genotype LM35 (58% reduction in instantaneous water use efficiency), LM79 (55% reduction in instantaneous water use efficiency), LM57 (45% reduction in instantaneous water use efficiency) and LM98 (57% reduction in instantaneous water use efficiency) ().
Figure 3. Instantaneous water use efficiency of irrigated wheat genotypes after water stress at different growth stages. [LSD = 0.11 (tillering), LSD = 0.10 (flowering) and LSD = 0.13 (grain filling)]. n = 8.
![Figure 3. Instantaneous water use efficiency of irrigated wheat genotypes after water stress at different growth stages. [LSD = 0.11 (tillering), LSD = 0.10 (flowering) and LSD = 0.13 (grain filling)]. n = 8.](/cms/asset/a7c8c57d-5ab7-4bfc-9ac1-85050c22e0c0/sagb_a_1439526_f0003_c.jpg)
This means that genotype LM35, LM79 and LM43’s instantaneous water use efficiency was unaffected by water stress at tillering whereas LM66, LM47, LM83, LM57, LM98 and LM79 were unaffected at flowering and LM66, LM47, LM83 and LM43 tolerant at grain filling. These results were in line with the findings of Boutraa et al. (Citation2010) and Li et al. (Citation2017) who concluded that the instantaneous water use efficiency was affected by water stress at different growth stages depending on the susceptibility of the genotype and the duration of the stress period. It can, therefore, be concluded that withholding irrigation at any growth stages should only be implemented if the genotypes that showed no effect to water stress in each growth stage are planted.
Relative water content
A high relative water content was evident in the genotypes subjected to full irrigation whereas when water stress was imposed the relative water content of the genotypes subjected to water stress at grain filling was not affected (p > 0.05) (). Genotype LM35 (18% lower relative water content) and LM47 (13% lower relative water content) were the only ones affected by water stress at tillering stage while the rest of the genotypes subjected to water stress at this growth stage were tolerant (). The lowest relative water content obtained after water stress at the flowering stage was from genotype LM98 with a 46% reduction in the relative water content followed by LM79 with 42% lower relative water content, LM83 (35% lower relative water content) and LM57 (31% lower relative water content).
Figure 4. Influence of water stress imposed at three growth stages on the relative water content of wheat genotypes. n = 8.
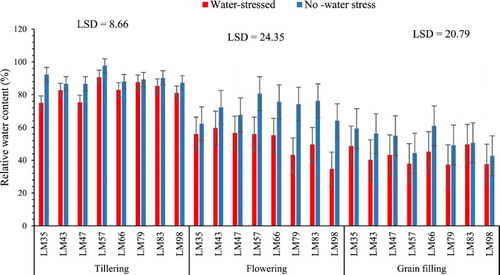
These findings contradict those of Khakwani et al. (Citation2012) and Keyvan (Citation2010) who discovered that wheat genotypes (Damani, Hashim-8, Gomal-8, DN-73, Zam-04, Dera-98, Chamran, Marvdasht, and Shahriar) were all affected when water stress was experienced at flowering, tillering or grain filling. However, they are supported by some of the findings and discussion made by these authors that genotypes that retain a high relative water content after water stress at each growth stage are tolerant. For example Khakwani et al. (Citation2012) states that the ability of a genotype to retain more relative water content may be due to its aptitude to control water loss through the stomata or accumulate and adjust osmotically to maintain tissue turgor hence enable physiological activities.
Proline content
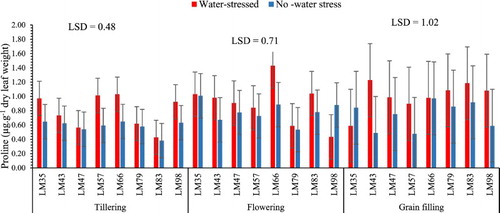
Water stress imposed at the three growth stages did not cause a significant (p > 0.05) accumulation of the proline content (). However, the stressed treatment showed a trend towards higher levels. This may suggest that the studied genotypes were not severely affected by water stress which might have led in a non-significant increase in the proline content. These findings differ from those reported by Man et al. (Citation2011), Maralian et al. (Citation2010), Mwadzingeni et al. (Citation2016) who found that proline content accumulates significantly in crops under water stress. Whereas, they are supported by the fact that proline content only shows a significant accumulation if the crops under water stress are being severely affected (McMichael and Elmore Citation1977; Sultan et al. Citation2012; Boudjabi et al. Citation2015). Hence, the reaction of the proline content could be because the duration of the stress imposed in the studied genotypes at the three growth stages might not have been long enough to cause a significant accumulation in the proline content.
Figure 5. Proline accumulation after water stress at different growth stages of wheat development. n = 8.
Correlation analysis
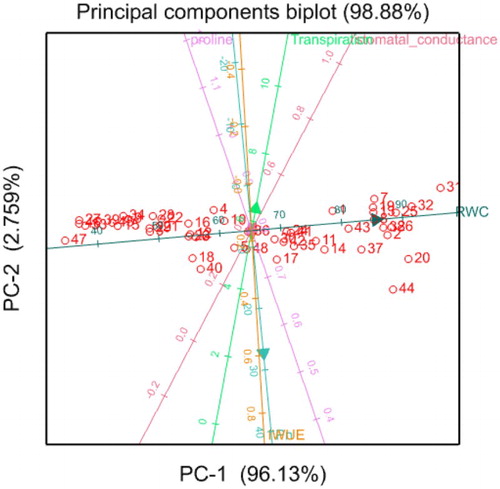
Results of the current study show that there were strong positive correlations between proline content, transpiration rate, stomatal conductance and instantaneous water use efficiency. However, these were negatively correlated with the rate of photosynthesis. The negative correlation in this study between photosynthesis and stomatal conductance is supported by Siddique et al. (Citation1999) who explained that the reduction in the rate of photosynthesis under water stress may not be regulated by the stomatal conductance but rather by non-stomatal factors. However, they contradict those of Wang et al. (Citation2016) who found a positive correlation between the rate of photosynthesis and stomatal conductance.
Hidayati et al. (Citation2016) also discovered that the rate of photosynthesis was not always correlated with transpiration rate and justified his findings with an explanation by Maxwell and Johnson (Citation2000) who indicated that the rate of photosynthesis is mostly influenced by the energy received from light that is absorbed by the chlorophyll and may not be associated with the transpiration rate or stomatal conductance. The positive correlation between the rate of transpiration and stomatal conductance may be due to the reaction of these traits to water stress at tillering, flowering and grain filling which indicated no significant (p < 0.05) effect of water stress to these traits. This was also the case for the proline content which did not accumulate in any of the growth stages after water, hence signaling the less severe effect water stress had on the measured traits ().
Figure 6. Biplot graphical display of the measured traits in wheat genotypes under both water stress and full irrigation conditions at tillering, flowering and grain filling. The above diagram is an outcome from the Principal Component Analysis (PCA). It illustrates the correlation among the measured physiological and leaf gas exchange traits for all the genotypes. The direction and alignment of the arrows of two or more traits demonstrate the correlation. Traits with arrows that are facing the same direction and closely together are positively correlated while those facing opposite direction from others indicate a negative correlation. IWUE (![]()
Based on the findings of this study, there is still hope for South African irrigated wheat farmers to maximise their wheat yield production despite the severe water shortage in the country. The finding of the current study has managed to identify potential genotypes which can with stand drought at different stages of crop development. Different genotypes responed differently in different growth stages when water stress was imposed. This is similar to other studies as discussed above that different genotypes respond differently because of their differences in their genetic make up. The results of this study may serve as a starting point for selection of drought tolarent genotypes by observing the ones which are more tolerant to all growth stage.
In conclusion, Due to studies that demonstrate that despite the reaction of other traits such as the rate of photosynthesis, stomatal conductance, transpiration rate, and relative water content; genotypes with a higher water use efficiency are best suited to be planted in environments with limited water. It can, therefore, be suggested from the studied genotypes that LM35, LM79, LM57 and LM98 are sensitive to water stress at grain filling. But for irrigation that is to be withheld at tillering, LM43 and LM35 are the only ones suitable for planting whereas they are the only ones’ sensitive to water stress at flowering stage. However, the results of this study may need to be repeated in a number of experiments to confirm the results found in this study.
Acknowledgements
The authors wish to acknowledge the Winter Cereal Trust, National Research Foundation (NRF) and the Agricultural Research Council (ARC) for funding. Troika Fund administered by School of Agriculture, Earth and Environmental Science is also greatly acknowledged for supporting this work.
Disclosure statement
No potential conflict of interest was reported by the authors.
Notes on contributors
Unathi Liwani is a Masters student at the University of KwaZulu-Natal, she received her under graduate degree at the University of Fort Hare.
Lembe S. Magwaza is a lecturer of crop and holticultural science at the university of KwaZulu-Natal. He received his PhD in Plant Physiology and post Harvest Technology from the University of Stellenbosch. His current work is focused on preharvest factors affecting postharvest performance of citrus & subtropical fruit.
Nkanyiso J. Sithole is a PhD candidate in crop science at the University of KwaZulu-Natal and a Lecturer at the University of Zululand in the Department of Agriculture. He received his MSc Degree at the University of KwaZulu-Natal. His current work is focused on conservation agriculture.
Alfred O. Odindo is a lecturer in the Crop Science Discipline at the University of KwaZulu-Natal. He does research in Irrigation and Water Management, Agronomy and Agricultural Plant Science. His current project is Characterisation of selected potato cultivars for frozen French fries.
Toi J. Tsilo is a researcher at the Agricultural Research Council in Small Grain Institute. He received his PhD at the University of Minnesota. His current project include Breeding wheat for drought tolerance, disease and insect resistance.
ORCID
Lembe S. Magwaza http://orcid.org/0000-0001-9809-2254
Additional information
Funding
References
- Akram M. 2011. Growth and yield components of wheat under water stress of different growth stages. Bangladesh J Agric Res. 36:455–468. doi: 10.3329/bjar.v36i3.9264
- Allahverdiyed T. 2015. Effect of drought stress on some physiological traits of durum (Triticum durum Desf.) and bread (Triticum aestivum L.) wheat genotypes. J Stress Physiol Biochem. 11:29-38.
- Allahverdiyev TI, Talai JM, Huseynova IM, Aliyev JA. 2015. Effect of drought stress on some physiological parameters, yield, yield components of durum (Triticum durum desf.) and bread (Triticum aestivum L.) wheat genotypes. EKIN J Crop Breed Genet. 1:50–62.
- [ARC-SGI] Agricultural Research Council - Small Grain Institute. 2014. Guidelines for production of small grain in the winter rainfall areas. Bethlehem. Free State. South Africa.
- Ashraf MY, Khan AH. 1993. Effect of drought stress on wheat plant in response in early stage. Pak J Agric Resour. 36:455–468.
- Bates LS, Waldren RP, Teare ID. 1973. Rapid determination of free proline for water-stress studies. Plant Soil. 39:205–207. https://doi.org/10.1007/BF00018060.
- Blum A. 2005. Drought resistance, water-use efficiency, and yield potential—are they compatible, dissonant, or mutually exclusive? Aust J Agric Res. 56:1159–1168. https://doi.org/10.1071/AR05069.
- Boudjabi S, Kribaa M, Chenchouni H. 2015. Growth, physiology and yield of dururm wheat (Triticum durum) treated with sewage sludge under water stress conditions. EXCLI J. 14:320–334. https://doi.org/10.17179/excli2014-715.
- Boutraa T, Akhkha A, Al-shoaibi AA, Alhejeli AM. 2010. Effect of water stress on growth and water use efficiency (WUE) of some wheat cultivars (Triticum durum) grown in Saudi Arabia.. J Taibah Univ Sci. 3:39–48. https://doi.org/10.1016/S1658-3655(12)60019-3.
- Brady NC, Weil RR. 2008. The nature and properties of soils. 13th ed. Upper Saddle River: NJ: Prentice Hall.
- Damayanthi MMN, Mohotti AJ, Nissanka SP. 2010. Comparison of tolerant ability of mature field grown tea (Camellia sinesis L.) cultivars exposed to a drought stress in Passara area. Trop Agric Res. 1:66–75. http://doi.org/10.4038/tar.v22i1.2671.
- Daryanto S, Wang L, Jacinthe PA. 2016. Global synthesis of drought effects on maize and wheat production. PLoS One. 11:1–15. https://doi.org/10.1371/journal.pone.0156362.
- El Hafid R, Smith DH, Karrou M, Samir K. 1998. Physiological responses of spring durum wheat cultivars to early season drought in a Mediterranean environment. Ann Botany. 81:363–370. https://doi.org/10.1006/anbo.1997.0567.
- Farooq M, Wahid A, Kobayashi N, Fujita D, Basra SMA. 2009. Plant drought stress: effects, mechanisms and management. Agron Sustain Dev. 29:185–212. https://doi.org/10.1051/agro:2008021.
- Fourie P, Botha P. 2011. The role of irrigation in grain production. Pretoria (South Africa): Grain SA.
- Gomes MMA, Lagôa AMMA, Medina CL, Machado EC, Machado MA. 2004. Interactions between leaf water potential, stomatal conductance and abscisic acid content of orange trees submitted to drought stress. Brazilian J Plant Physiol. 16:155–116. http://doi.org/10.1590/S1677-04202004000300005.
- Hanin M, Brini F, Ebel C, Toda Y, Takeda S, Masmoudi K. 2011. Plant dehydrins and stress tolerance: versatile proteins for complex mechanisms. Plant Signal Behav. 6:1503–1509. https://doi.org/10.4161/psb.6.10.17088.
- Hayat S, Hayat Q, Alyemeni MN, Wani AS, Pichtel J, Ahmad A. 2012. Role of proline under changing environments. Plant Signal Behav. 7:1456–1466. http://doi.org/10.4161/psb.21949.
- Heinemann AB, Stone LF, Fageria NK. 2011. Transpiration rate response to water deficit during vegetative and reproductive phases of upland rice cultivars. Sci Agric. 68:24–30. http://doi.org/10.1590/S0103-90162011000100004.
- Hidayati N, Triadiati, Anas I. 2016. Photosynthesis and transpiration rates of rice cultivated under the system of rice intensification and the effects on growth and yield. HAYAT J Biosci. 23:67–72. doi: 10.1016/j.hjb.2016.06.002
- Keyvan S. 2010. The effects of drought stress on yield, relative water content, proline, soluble carbohydrates and chlorophyll of bread wheat cultivars. J Anim Plant Sci. 8:1051–1060.
- Khakwani AZ, Dennet MD, Munir M, Abid M. 2012. Growth and yield response of wheat varieties to water stress at booting and anthesis stages of development. Pak J Bot. 44:879–886.
- Li Y, Li H, Li YU, Zhang S. 2017. Improving water-use efficiency by decreasing stomatal conductance and transpiration rate to maintain higher ear photosynthetic rate in drought-resistant wheat. Crop J. 5:231–239. https://doi.org/10.1016/j.cj.2017.01.001.
- Lisar SYS, Motafakkerazad R, Hossain MM, Rahman IMM. 2012. Water stress in plants: causes, effects and responses. In: Ismail Md, Mofizur Rahman, editors. ISBN: 978-953-307-963-9. https://doi.org/10.5772/39363.
- Man D, Bao YZ, Han LB. 2011. Drought tolerance associated with proline and hormone metabolism in two tall fescue cultivars. HortScience. 46:1027–1032.
- Mancosu N, Snyder RL, Kyriakakis G, Spano D. 2015. Water scarcity and future challenges for food production. Water. 7:975–992. doi:10.3390/w7030975.
- Maralian H, Ebadi A, Didar TR, Haji-Eghrari B. 2010. Influence of water deficit stress on wheat grain yield and proline accumulation rate. Afr J Agric Res. 5:286–289.
- Maxwell K, Johnson GN. 2000. Chlorophyll fluorescence—a practical guide. J Exp Bot. 51:659–668. https://doi.org/10.1093/jexbot/51.345.659.
- McMichael BL, Elmore CD. 1977. Proline accumulation in water stressed cotton leaves. Crop Sci. 17:905–908. https://doi.org/10.2135/cropsci1977.0011183X001700060022x.
- Mwadzingeni L, Shimelis H, Tesfay S, Tsilo T. 2016. Screening of bread wheat genotypes for drought tolerance using phenotypic and proline analyses. Front Plant Sci. 7:1748. https://doi.org/10.3389/fpls.2016.01276.
- Nayyar H, Walia D. 2003. Water stress induced proline accumulation in contrasting wheat genotypes as affected calcium and abscisic acid. Biol Plant. 46:275–279. https://doi.org/10.1023/A:1022867030790.
- Ram H, Dadhwal V, Vashist KK, Kaur H. 2013. Grain yield and water use efficiency of wheat (Triticum aestivum L.) in relation to irrigation levels and rice straw mulchingin North West India. Agric Water Manag. 128:92–101. doi: 10.1016/j.agwat.2013.06.011
- Saeidi M, Ardalani S, Honarmand SJ, Ghobadi ME, Abdoli M. 2015. Evaluation of drought stress at vegetative growth stage on the grain yield formation and some physiological traits as well as fluorescence parameters of different bread wheat cultivars. Acta Biol Szegediensis. 59:35–44.
- Siddique MRB, Hamid A, Islam MS. 1999. Drought stress effects on photosynthetic rate and leaf gas exchange of wheat. Bot Bull Acad Sinica Taipei. 40:141–145.
- Sokoto MB, Singh A. 2013. Yield and yield components of bread wheat as influenced by water stress, sowing date and cultivar in Sokoto, Sudan Savannah, Nigeria. Am J Plant Sci. 04:122–130. doi: 10.4236/ajps.2013.412A3015
- Sultan MARF, Hui L, Yang LJ, Xian ZH. 2012. Assessment of drought tolerance of some Triticum L. species through physiological indices. Czech J Genet Plant Breed. 48:178–184. doi: 10.17221/21/2012-CJGPB
- Tabassam MAR, Hussain M, Sami A, Shabbir I, Bhutta MAN, Mubusher M, Ahmad S. 2014. Impact of drought on growth and yield of wheat. Scientia Agriculturae. 7:11–18. https://doi.org/10.15192/PSCP.SA.2014.3.1.1118.
- Tekle AT, Alemu MA. 2016. Drought tolerance mechanisms in field crops. World J Biol Med Sci. 23:15–39.
- Turton A, Du Plessis A, Walker J, Swanepoel S. 2016. Running on empty: what business, government and citizens must do to front South Africa’s water crisis. Water interrupted campaign. South Africa; [accessed November 2016]. http://actionaid.org/sites/files/actionaid/running_on_empty_-_water_efficiency_report.pdf.
- van Heerden PDR, de Villiers OT. 1996. Evaluation of proline accumulation as an indicator of drought tolerance in spring wheat cultivars. S Afr J Plant Soil. 13:17–21. http://doi.org/10.1080/02571862.1996.10634368.
- Wang X, Wang L, Shangguan Z. 2016. Leaf gas exchange and fluorescence of two winter wheat varieties in response to drought stress and nitrogen supply. PLoS One. 11:1–15. https://doi.org/10.1371/journal.pone.0165733.
- [WRC] Water Research Commission. 2015. Water restrictions. Drought: your gateway to managing water scarcity in times of drought. Pretoria, South Africa: Water Research Commission.
- [WRC] Water Research Commission. 2016. Water restrictions. Drought: your gateway to managing water scarcity in times of drought. Pretoria, South Africa: Water Research Commission.
- Zadoks JC, Chang TT, Konzak CF. 1974. A decimal code for the growth stages of cereals. Weed Res. 14:415–421. https://doi.org/10.1111./j.1365-1380.1974.tb01084.x doi: 10.1111/j.1365-3180.1974.tb01084.x