
ABSTRACT
This study compared soil respiration (SR) fluxes from winter wheat-based cropping systems in the US Southern Great Plains (SGP) under reduced and conventional tillage. The study consisted of four sets of paired paddocks assigned to conventional or reduced tillage with a four-year crop rotation applied over time. During the 2016–2017 study year, four sets of paired paddocks were planted to: winter wheat managed for grazing, dual-purpose (grazing and grain production), and grain-only systems of production, and winter canola. Heterotrophic SR fluxes were measured using a plant and root exclusion method on eight permanently deployed PVC cores per paddock. Fluxes from the cores were measured manually using a closed chamber connected to an infrared gas analyser on 12–13 dates during the winter wheat growing season (October through May). There were strong seasonal patterns of SR flux, with lower rates during dry and cold periods, and higher rates during warm and wet periods. Large rainfall induced pulses of SR flux were observed for both tillage systems. There was no consistent large-scale difference in SR flux between tillage treatments applied to paired paddocks. Results from this study indicate SR fluxes from winter wheat-based cropping systems are controlled more by soil environmental conditions than form of tillage.
Introduction
Winter wheat is a primary grain crop grown in the U.S. Southern Great Plains (SGP), with >2.6 million hectares planted annually in Oklahoma (Hossain et al. Citation2004). Winter wheat is a highly diverse crop capable of producing multiple commodities (Decker et al. Citation2009), including forage for grazing, grain, and in a dual-purpose role to provide both grazing and grain. Winter wheat is largely grown as a monoculture in continuous annual rotations, with September through May growing seasons separated by periods of summer fallow (Redmon et al. Citation1995). In recent decades, inclusion of winter canola in wheat rotations is increasing in the SGP, as a management tool to break weed and disease cycles (Begna et al. Citation2017).
The tillage systems applied to winter wheat in the SGP are highly diverse. Hossain et al. (Citation2004) reported that 89% of producers in Oklahoma who use continuous winter wheat – summer fallow systems apply conventional tillage; roughly 56% of the total wheat area annually receives conventional tillage. In contrast, the area planted to winter wheat by reduced tillage (36%) and no-till (8%) systems (Conservation Technology Information Center Citation2004) is small but showing increases (Hansen et al. Citation2012). The main reason for increasing adoption of reduced and no-till systems in the SGP is to conserve soil moisture, a critical factor for producing winter wheat in the region. Systems of conservation tillage but may also provide other environmental benefits, such as reductions in carbon dioxide (CO2) emissions from soil, and thereby contribute to increased concentrations of soil carbon (Smith et al. Citation1998; Six et al. Citation2004, Foley et al. Citation2005, Powlson et al. Citation2014). Cultivation of canola in rotation with winter wheat under conservation tillage system is also increasing (Assefa et al. Citation2014).
Tillage is an important management system that affects decomposition of soil carbon (C) and biomass, and therefore, may significantly influence magnitude and timing of soil respiration (SR) fluxes (Balesdent et al. Citation2000). Tillage incorporates biomass into the soil profile and increases aeration, thereby creating large pulses of SR fluxes (Ellert and Janzen Citation1999). Reducing intensity of tillage or number of operations may help to avoid such rapid decomposition of plant biomass, and may increase amounts of soil C. While conventional tillage contributes to large pulses of SR immediately after ploughing, the background SR fluxes related to conservation tillage can be higher due to greater availability of C substrates in the upper soil layers. Indeed, some studies have reported that different types of tillage system affect timing of SR but total amounts of C loss may not be significantly affected by form of tillage over time (Hendrix et al. Citation1988).
Grazing is also a component of management applied to wheat-based agroecosystems in the SGP that can affect C cycling and turnover. Grazing affects the soil supply of C substrates for microbial respiration and SR is affected by multiple complex interactions related to grazing activities (Bremer et al. Citation1998). Cattle consume significant amounts of aboveground biomass and redistribute C and nitrogen (N) through retention as weight gain, and in return to soil as faeces and urine (Sheldrick et al. Citation2003; Orwin et al. Citation2009). This redistribution through grazing directly affects inputs of both C and N in substrates that serve as energy sources for SR. Grazing also directly affects soil environmental factors such as soil moisture and temperature controlling SR fluxes (Whitehead Citation2000). Additionally, urine deposition by cattle may create hotspots of SR in semi-arid regions such as the SGP, particularly during dry periods (Liebig et al. Citation2008; Jiang et al. Citation2012).
Although forms of management that reduce tillage are considered as mitigation options for C emissions from agricultural soils, the influence of tillage systems on SR fluxes are scarce for cropping systems applied to winter wheat in the SGP (Wilson et al. Citation2015). This study was therefore designed to compare SR fluxes from reduced and conventional systems of tillage applied to different cropping systems applied to winter wheat in the SGP. We hypothesised that reduced tillage systems would significantly reduce heterotrophic SR compared to conventional tillage system applied to various winter wheat-based cropping systems.
Materials and methods
Site description and weather conditions
The study was conducted on the Grazinglands Research on agro-Ecosystems and the ENvironment (GREEN) farm (35°33ʹ29ʹʹN, 98°1ʹ50ʹʹW; 383–393 m above sea level) situated on the USDA-ARS Grazinglands Research Laboratory (GRL), El Reno, Oklahoma. The site is one of 18 Long-Term Agroecosystem Research (LTAR) sites of USDA-ARS (https://ltar.nal.usda.gov/). The primary soils within the site were a complex of Renfrow-Kirkland silt loams, Bethany silt loams, and Norge silt loams (Mollisols) with an average soil bulk density of 1.34–1.45 g cm–3 (USDA-NRCS Citation1999). The climate is characterised as temperate continental with long-term (1981–2010) mean annual temperature of about 15°C and mean total precipitation of 870 mm.
The study area consisted of four large, contiguous, independent watersheds. From 2001–2015, all four watersheds were cultivated for graze-only wheat for grazing by cattle with conventional tillage. In 2015, these watersheds were divided into eight paired paddocks (10–22 ha), based on exposure within the landscape. Each paddock contained their own sub-watershed and were assigned one of two tillage systems; conventional tillage (CT) and no-till (NT). One pair of paddocks were managed for production of continuous winter wheat grazed by cattle every year as references. The other paired paddocks were assigned to four-year crop rotations, with each paddock started at a different stage of the rotation. The rotation was: winter canola in the first year, grain-only winter wheat in the second year, dual-purpose winter wheat (winter grazing and spring grain harvest) in the third year, and graze-only wheat (grazed during the fall through spring) in the fourth year.
The tillage component of the experiment was initiated in the 2015–2016 growing season, while the grazing component started in the growing season of 2016–2017. Although no tillage events were implemented in NT paddocks in 2015, a tillage operation (application of a vertical tillage implement) was performed in all no-tilled paddocks during September 2016. This event was applied to manage heavy crop residues from the previous grain harvest, which hindered sowing of seeds. Therefore, the NT system was redefined as reduced tillage (RT) system in the further descriptions. Soil concentrations of C and N, and soil pH at 0–10 cm soil depth in each paddock are presented in Supplementary Table 1. Concentrations of soil organic carbon (SOC) in dual-purpose and graze-only winter wheat paddocks ranged from 0.81% to 0.89% while concentrations while the concentrations were in the range of 1.25–1.50% in grain-only winter wheat and canola paddocks. Similarly, total nitrogen (TN) concentrations ranged between 0.080% and 0.086% in dual-purpose and graze-only winter wheat paddocks while the concentrations were in the range of 1.112–0.136 in grain-only winter wheat and canola paddocks. Soil pH was within a range of 5.48–6.26.
This study was carried out during the 2016–2017 growing season (September through June) of winter wheat. Field operations (tillage, planting, fertilisation and harvesting) in each paddock in the previous (2015–2016) and current (2016–2017) years are presented in Supplementary Figure 1. All paddocks were left fallow during summer (June–September) of 2016. The RT paddocks were sprayed with herbicides to control weeds during 28–31 July 2016. Additional applications were carried out prior to planting in September–October 2016. Weed control in CT paddocks during the fallow period was achieved by tillage, as was necessary to control weeds. Paddocks assigned to dual-purpose, graze-only winter wheat and winter canola in 2016–2017 were cultivated with grain-only winter wheat during 2015–2016. The paired paddocks assigned to grain-only winter wheat in 2016–2017 were cultivated with winter canola during the previous year.
In 2016, winter wheat (cv. Gallagher) was sown at 20 cm row spacing (seed rate, 90 kg ha–1) on 12–13 September in graze-only paddocks, 22–23 September in dual-purpose paddocks, and 16–18 October in grain-only paddocks. Graze-only and dual-purpose winter wheat are generally sown 2–4 weeks earlier than grain-only winter wheat to provide extra time for forage production, which was practised in this study (Redmon et al. Citation1995; Decker et al. Citation2009). Canola (cv. DKW46-15) was sown (seed rate, 5.6 kg ha–1) at 20 cm row spacing on 3–4 October.
Yearling stocker cattle (∼250 kg body weight) were assigned with a stocking density of 1.2–1.5 head per hectare (based on available winter wheat forage for grazing) in the dual-purpose and graze-only paddocks in early November 2016. The cattle were removed from dual-purpose paddocks in early March to allow grain development by wheat. These animals were added to the graze-only paddocks to provide a stocking density of 2.4 head per hectare, to exploit rapid growth of wheat via maturation during March through early May (Redmon et al. Citation1995).
Measurements of soil respiration flux
Soil respiration (SR) flux was measured using a plant and root exclusion method (Kuzyakov Citation2006; Kandel et al. Citation2018) on cylindrical PVC cores (diameter, 0.10 m; height, 0.30 m) inserted to 0.28 m soil depth. Eight soil cores were inserted in each paddock at a spacing of 10–15 m apart within a 20-m radius of a central point. The cores were placed between drill rows immediately after sowing of winter wheat and canola in 2016. Any encroaching vegetation (which was rarely seen) inside the cores was removed by hand before SR measurements. Fluxes were measured using an EGM-5 SR system (PPSystems, Amesbury, MA, USA). At each measurement, a cylindrical (height, 0.15 m; diameter, 0.10 m) chamber (model SRC-2; PPsystems) was enclosed for 60 s and CO2 concentrations were recorded at 1-s intervals. A dead-band of 10 s immediately after enclosure was discarded before calculating by linear regression (Kandel et al. Citation2016).
Measurements of environmental variables
Volumetric water content (VWC) and soil temperature at 0–15 cm depth were measured manually outside each core at the time of flux measurement with a Stevens® Hydra Probe® soil moisture sensor (Stevens Water Monitoring Systems, Inc., Portland, OR, USA). Air temperature and precipitation during the study period were obtained from an Oklahoma Mesonet weather station (https://www.mesonet.org) which was located 1–2 km from the paddocks.
Modelling soil respiration with DNDC model
The DNDC (DeNitrification-DeComposition) model is a process-based model which focuses on soil C and N biogeochemistry, including gaseous emissions of C and N to the atmosphere (Li et al. Citation1992). The model is widely used to simulate SR fluxes in various agricultural systems (Abdalla et al. Citation2011; Chirinda et al. Citation2011; Li et al. Citation2017). Here, we evaluated the DNDC model for its capacity to explain differences in effects of tillage and crop management on SR fluxes from the eight paired paddocks. The primary objective of using the DNDC model was to estimate cumulative SR fluxes during a growing season with a widely used process-based model. The DNDC model has three input modules; climate, soil parameters, and crop management. Daily records of environmental variables (air temperature and precipitation) were obtained from the weather station for model simulations. The model was initiated from 2005, since both crop systems and form of tillage during the years prior to the current study can have strong influences on C turnover during the current study. Soil characteristics presented in Supplementary Table 1 and crop management presented in Supplementary Figure 1 were used as model inputs.
Statistical analysis
The difference of measured SR fluxes and VWC between two paired tillage systems within a cropping management were determined using a mixed model in SAS (SAS Inc., Cary, NC). The statistical model included sampling dates as factor which was treated as repeated measurements. The compound symmetry covariance structure (CS) was applied to account for auto-correlation among dates of repeated measurements. In addition to the measured soil respiration, statistical differences in average SR across the measurement dates between two paired paddocks were analysed individually using t-test at 5% significance level. For this analysis, average SR flux from individual cores across the measurement dates were calculated and the statistical analysis was done based on the average SR flux of eight cores in each paddock. Unless otherwise indicated, measured variables are presented as the means of eight cores and standard error (SE). Statistical correlations of the SR fluxes to soil temperature and VWC were also carried out using linear fit.
Results and discussion
Climate and environmental conditions
Precipitation received during the growing season (October 2016 – May 2017) of winter wheat (517 mm) was slightly lower than the 30-year mean (567 mm) for the same period (). Monthly precipitation during the study year was well below the long-term mean during October 2016 to January 2017, but above the 30-year mean in February and April 2017. Temperatures during October–November of 2016 and January–March of 2017 were slightly warmer than long-term means.
Figure 1. Mean monthly (a) temperature, and (b) total precipitation during the study period (October 2016 to May 2017).
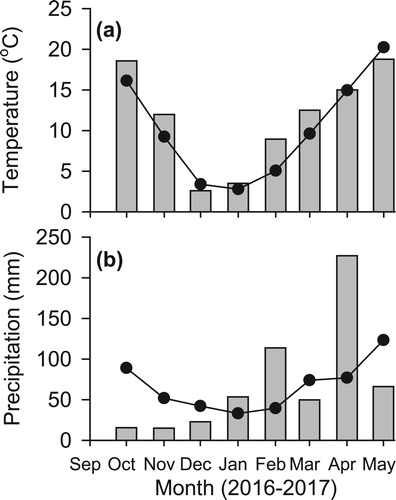
Volumetric water content (VWC) measured in the 0–5 cm soil depth ranged from 1 to 40%, indicating a range of conditions, from extremely dry soil to flooded conditions, occurred during the study (Supplementary Figure 2). As expected, VWC followed the rainfall patterns and increased rapidly during rainfall events. There was no significant difference (P < .05) between tillage systems applied to the paired paddocks of forage-only and grain-only winter wheat on VWC. However, large-scale systematic difference was observed between the paddocks managed for graze-only wheat, where higher VWC was observed in the RT than CT paddock. Soil temperature during measurements ranged from 4°C to 38°C. Although soil temperature mostly followed seasonal patterns, high soil temperature (up to 33°C) were also recorded in the end of February 2017 (Supplementary Figure 3).
Measured soil respiration
Soil respiration fluxes during the measurement period ranged between 0 and 40 kg CO2-C ha–1 d–1 (). As expected, there was strong seasonal patterns in SR, with lower rates during dry and cold spells encountered in winter, and higher rates during warmer and wetter periods in spring. Thus, there was significant effects (P < .001) of measurement dates on soil respiration fluxes for all paired paddocks assigned to CT and RT systems. However, the effect of tillage system was significant only for graze-only (P < .001) and grain-only (P < .05) managements of winter wheat; higher SR flux was observed from RT than CT systems.
Figure 2. Soil respiration fluxes from paired paddocks of (a) dual-purpose winter wheat, (b) graze-only winter wheat, (c) grain-only winter wheat, and (d) canola under reduced (closed markers) and conventional (open markers) tillage systems. Data represent average and standard error of soil respiration fluxes measured at eight cores (n = 8). Significance levels (P-values) of two-way analysis of tillage treatment (T), measurement date (D), and interaction effects (T × D) are presented. ***P < .001; **P < .01; *P < .05; ns, non-significant (P > .05).
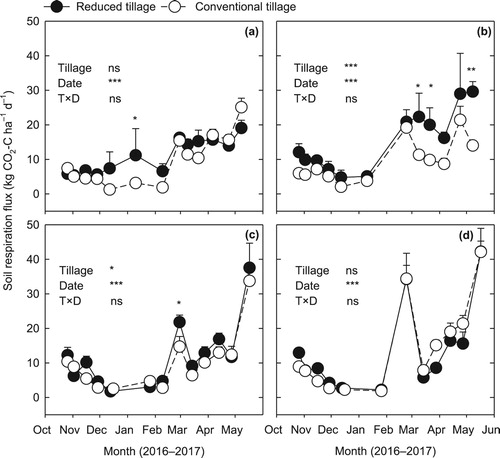
When statistical differences among individual dates were compared, slightly higher (P < .05) SR fluxes were observed from dual-purpose winter wheat with RT management than CT during January 2017 ((a)). The higher rates of SR flux from RT paddocks were likely to be contributed by extremely large fluxes from one of the eight cores within the paddock. This core was visibly wet compared to other cores during the dry periods, possibly due to urine deposition from cattle. The elevated SR from dual-purpose winter wheat after urine-decomposition indicate that urine patches can be significant hot-spots of SR from grazed ecosystems during dry periods (Jiang et al. Citation2012).
Higher SR from RT paddocks than CT paddocks under graze-only winter wheat was mostly contributed by higher rates of SR during later periods of measurement ((b)). The difference in SR rates in those paired paddocks was likely to be contributed by soil moisture than the tillage systems since VWC in the RT paddock was significantly higher during than in the CT paddocks (Supplementary Figure 2). The interaction effects of tillage treatments and measurement dates were not significant for all four paired management systems which indicated that environmental variables controlling soil respiration had similar influence under both tillage systems.
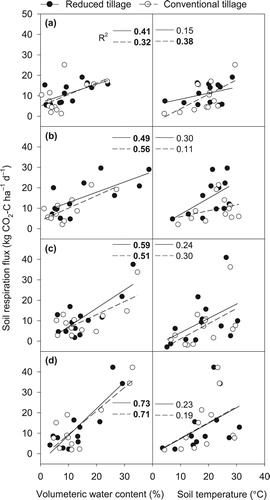
Large pulses of SR fluxes were observed after rainfall events in February from both tillage systems. This response indicates that soil moisture is a key environmental factor to define amounts of SR fluxes from water limited ecosystems (Sponseller Citation2007). This means that high rainfall events can contribute to large losses of soil C under both CT and RT. The greater importance of soil moisture to control SR fluxes is also demonstrated by stronger correlations between SR and VWC (average R2 = 0.54; range 0.32–0.73) than with soil temperature (average R2 = 0.24; range 0.11–0.38) for average measurements on individual measurement dates (). Although SR fluxes decreased with decreasing temperature in winter and increased in summer, there was no strong correlation between SR fluxes and temperature (, right panels) which is a basis for empirical modelling of SR fluxes (Lloyd and Taylor Citation1994).
Figure 3. Correlations of soil respiration flux with soil temperature and volumetric water content at 0–5 cm soil depths for (a) dual-purpose winter wheat, (b) graze-only winter wheat, (c) grain-only winter wheat, and (d) canola under reduced (closed markers) and conventional (open markers) tillage systems. The data points represent average of eight (n = 8) measurements in an individual date. The lines represent linear fits (solid lines for reduced tillage and dashed lines for conventional tillage systems). Coefficient of determination (R2) of linear fits is shown. The R2 values in bold indicate significant (P < .05) linear fit.
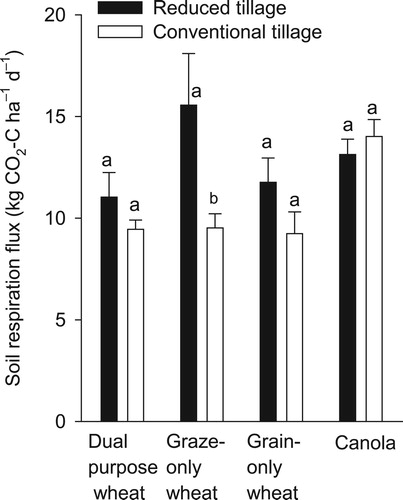
Average SR fluxes from RT paddocks of dual-purpose and grain-only winter wheat were slightly higher (17–19%) than fluxes from their companion CT paddocks but statistically they were similar (P > .05) (). However, average SR from the graze-only RT paddock was 63% greater (P < .05) than fluxes from the paired CT paddock. The average SR from paired winter canola paddocks were similar. The similar to higher average SR fluxes from RT paddocks of winter wheat during the growing periods of crops might be due to the application of tillage operations in RT paddocks prior to onset of measurements in October 2016. Thus, possible tillage-induced pulses of SR might have been captured from RT paddocks but missed in CT paddocks, due to timing of operations (tillage during summer compared to operations prior to planting).
Figure 4. Average and standard errors (n = 8) of soil respiration fluxes. Letters above bars represent mean separation (P < .05) between two paired tillage treatments under individual cropping systems.
DNDC modelling
Although magnitudes and seasonal trends of SR fluxes from both tillage systems within paired paddocks were mostly similar, the DNDC model showed strong impacts of tillage systems (). In particular, the SR fluxes from RT paddocks were overestimated by DNDC during October to December 2016 following a vertical tillage (September) that was applied to manage crop residues prior to sowing. The DNDC model predicted large SR fluxes immediately after tillage operations, which then persisted for 2 months. Although the DNDC model predicted large tillage-induced SR pulses in RT paddocks that persisted until December, model predictions for RT paddocks were better in the remaining time periods.
Figure 5. Left panels: Comparison between simulated daily soil respirations by the DNDC model (lines) and measured fluxes (markers) from eight individual fluxes. Error bars for measured fluxes are standard deviation (n = 8). Right panels: 1:1 comparison between the modelled (x-axis) and measured (y-axis) soil respiration fluxes.
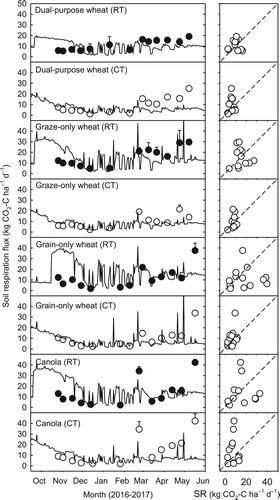
The DNDC model had better prediction of SR fluxes from CT paddocks than RT paddocks during October to December 2016. However, the model underestimated SR fluxes from CT paddocks in the remaining periods. Likewise, the DNDC model did not effectively simulate large peaks of SR flux during the final sampling for grain-only wheat, and flux from paddocks of winter canola.
The DNDC model was previously used for simulation of heterotrophic SR fluxes in various agro-ecosystems from different parts of the world (Abdalla et al. Citation2011; Chirinda et al. Citation2011; Li et al. Citation2017). Chirinda et al. (Citation2011) reported that model predictions were less sensitive to increasing temperature during spring and summer and thus underestimated SR fluxes during these periods, which was similar to results in the current study. Similarly, a study by Li et al. (Citation2017) showed the DNDC model generated large pulses of tillage-induced fluxes during autumn ploughing of croplands in Ontario, Canada, but such pulses were not observed. Here, our aim of testing DNDC model was mainly to upscale and estimate cumulative fluxes with a process-based model. However, the DNDC model was not useful for upscaling due to low accuracy. As seen in the current study, Chirinda et al. (Citation2011) also found low accuracy of the model, with modelling efficiency less than zero. These results collectively indicate that tillage-induced fluxes were generally overestimated and the effect of increasing temperature during spring and summer were not well captured by the DNDC model.
Supplemental Material
Download MS Word (44.3 KB)Disclosure statement
Mention of trade names or commercial products in this publication is solely for the purpose of providing specific information and does not imply recommendation or endorsement by the U.S. Department of Agriculture.
Notes on contributors
Tanka P. Kandel is an Environmental Soil Scientist with a Ph.D. in Agroecology from Aarhus University, Denmark (2013). Kandel’s key research interests are related to dynamics of carbon and nitrogen turnover in agricultural soils. Kandel’s recent studies are focused on management of legume cover crops for greenhouse gas emission mitigation.
Prasanna H. Gowda obtained his PhD degree in Agricultural Engineering (Soil and Water) from the Ohio State University, USA in 1996. His research expertise covers hydrologic and crop modelling, micrometeorology, remote sensing and GIS with particular focus on agricultural water management.
Brian K. Northup is a Research Ecologist with a Ph.D. in Agronomy from the University of Nebraska – Lincoln (1993). His research expertise covers a broad range of areas in landscape ecology and productivity, and statistics. His current research interests are related to the function of different crop and rangeland agroecosystems.
Alexandre C. Rocateli obtained his Ph.D. degree in plant and soil sciences at the Texas Tech. University in 2014. His research expertise covers fertilisation, weed control, grazing management, and hay production of tamed pastures. His focus has been on introducing graze-covers to the U.S. Southern Great Plains winter wheat systems.
ORCID
Tanka P. Kandel http://orcid.org/0000-0003-2543-9602
Related Research Data
References
- Abdalla M, Kumar S, Jones M, Burke J, Williams M 2011. Testing DNDC model for simulating soil respiration and assessing the effects of climate change on the CO2 gas flux from Irish agriculture. Glob Planet Chang. 78:106–115. doi: 10.1016/j.gloplacha.2011.05.011
- Assefa Y, Roozeboom K, Stamm M. 2014. Winter canola yield and survival as a function of environment, genetics, and management. Crop Sci. 54:2303–2313. doi: 10.2135/cropsci2013.10.0678
- Balesdent J, Chenu C, Balabane M. 2000. Relationship of soil organic matter dynamics to physical protection and tillage. Soil Till Res. 53:215–230. doi: 10.1016/S0167-1987(99)00107-5
- Begna S, Angadi S, Stamm M, Mesbah A. 2017. Winter canola: a potential dual-purpose crop for the United States Southern Great Plains. Agron J. 109:2508–2520. doi: 10.2134/agronj2017.02.0093
- Bremer DJ, Ham JM, Owensby CE, et al. 1998. Responses of soil respiration to clipping and grazing in a tallgrass prairie. J Environ Qual. 27:1539–1548. doi: 10.2134/jeq1998.00472425002700060034x
- Chirinda N, Kracher D, Lægdsmand M, et al. 2011. Simulating soil N2O emissions and heterotrophic CO2 respiration in arable systems using FASSET and MoBiLEDNDC. Plant Soil. 343:139–160. doi: 10.1007/s11104-010-0596-7
- Conservation Technology Information Center. 2004. National survey of conservation tillage practices. West Lafayette (IN): CTIC.
- Decker JE, Epplin FM, Morley DL, Peeper TF. 2009. Economics of five wheat production systems with no-till and conventional tillage. Agron J. 101:364–372. doi: 10.2134/agronj2008.0159
- Ellert BH, Janzen HH. 1999. Short-term influence of tillage on CO2 fluxes from a semi-arid soil on the Canadian Prairies. Soil Till Res. 50:21–32. doi: 10.1016/S0167-1987(98)00188-3
- Foley JA, DeFries R, Asner GP, et al. 2005. Global consequences of land use. Science. 309:570–574. doi: 10.1126/science.1111772
- Hansen NC, Allen BL, Baumhardt RL, Lyon DJ. 2012. Research achievements and adoption of no-till, dryland cropping in the semi-arid US Great Plains. Field Crops Res. 132:196–203. doi: 10.1016/j.fcr.2012.02.021
- Hendrix PF, Han CR, Groffman PM. 1988. Soil respiration in conventional and no-tillage agroecosystems under different winter cover crop rotations. Soil Till Res. 12:135–148. doi: 10.1016/0167-1987(88)90037-2
- Hossain I, Epplin FM, Horn GW, Krenzer Jr ER. 2004. Wheat production and management practices used by Oklahoma grain and livestock producers. Oklahoma Agric Exp Stn B-818. Oklahoma State University, Stillwater.
- Jiang Y, Tang S, Wang C, Zhou P, Tenuta M, Han G, Huang D. 2012. Contribution of urine and dung patches from grazing sheep to methane and carbon dioxide fluxes in an inner Mongolian desert grassland. Asian-Australasian J Animal Sci. 25:207–212. doi: 10.5713/ajas.2011.11261
- Kandel TP, Lærke PE, Elsgaard L. 2016. Effect of chamber enclosure time on soil respiration flux: a comparison of linear and non-linear flux calculation methods. Atmos Environ. 141:245–254. doi: 10.1016/j.atmosenv.2016.06.062
- Kandel TP, Lærke PE, Elsgaard L. 2018. Annual emissions of CO2, CH4 and N2O from a temperate peat bog: comparison of an undrained and four drained sites under permanent grass and arable crop rotations with cereals and potato. Agric For Meteorol. 256-257:470–481. doi: 10.1016/j.agrformet.2018.03.021
- Kuzyakov Y. 2006. Sources of CO2 efflux from soil and review of partitioning methods. Soil Biol Biochem. 38:425–448. doi: 10.1016/j.soilbio.2005.08.020
- Li C, Frolking S, Frolking TA. 1992. A model of nitrous oxide evolution from soil driven by rainfall events: 1. Model structure and sensitivity. J Geophys Res. 97:9759–9776. doi: 10.1029/92JD00509
- Li Z, Yang JY, Drury CF, Yang XM, Reynolds WD, Li X, Hu C. 2017. Evaluation of the DNDC model for simulating soil temperature, moisture and respiration from monoculture and rotational corn, soybean and winter wheat in Canada. Ecol Model. 360:230–243. doi: 10.1016/j.ecolmodel.2017.07.013
- Liebig MA, Kronberg SL, Gross JR. 2008. Effects of normal and altered cattle urine on short-term greenhouse gas flux from mixed-grass prairie in the Northern Great Plains. Agri Ecosyst Environ. 125:57–64. doi: 10.1016/j.agee.2007.11.004
- Lloyd J, Taylor JA. 1994. On the temperature dependence of soil respiration. Func Ecol. 8:315–323. doi: 10.2307/2389824
- Orwin KH, Bertram JE, Clough TJ, Condron TN, Sherlock RR, O’Callaghan M. 2009. Short-term consequences of spatial heterogeneity in soil nitrogen concentrations caused by urine patches of different sizes. Appl Soil Ecol. 42:271–278. doi: 10.1016/j.apsoil.2009.05.002
- Powlson DS, Stirling CM, Jat ML, Gerard BG, Palm CA, Sanchez PA, Cassman KG. 2014. Limited potential of no-till agriculture for climate change mitigation. Nat Clim Change. 4:678–683. doi: 10.1038/nclimate2292
- Redmon LA, Horn GW, Krenzer EG, Bernardo DJ. 1995. A review of livestock grazing and wheat grain yield: boom or bust? Agron J. 87:137–147. doi: 10.2134/agronj1995.00021962008700020001x
- Sheldrick W, Syers JK, Lindgard J. 2003. Contribution of livestock excreta to nutrient balances. Nutr Cycl Agroecosyst. 66:119–131. doi: 10.1023/A:1023944131188
- Six J, Ogle SM, Conant RT, Mosier AR, Paustian K. 2004. The potential to mitigate global warming with no-tillage management is only realized when practiced in the long term. Global Change Biol. 10:155–160. doi: 10.1111/j.1529-8817.2003.00730.x
- Smith P, Powlson DS, Glendining MJ, Smith JU. 1998. Preliminary estimates of the potential for carbon mitigation in European soils through no-till farming. Global Change Biol. 4:679–685. doi: 10.1046/j.1365-2486.1998.00185.x
- Sponseller RA. 2007. Precipitation pulses and soil CO2 flux in a Sonoran Desert ecosystem. Global Change Biol. 13:426–436. doi: 10.1111/j.1365-2486.2006.01307.x
- USDA-NRCS. 1999. Soil survey of Canadian county, Oklahoma, supplement manuscript. Stillwater, OK, USA: USDA and Oklahoma Agricultural Experiment Station.
- Whitehead DC. 2000. Nutrient elements in grassland: soil-plant-animal relationships. New York (NY): CABI.
- Wilson TM, McGowen B, Mullock J, Arnall DB, Warren JG. 2015. Nitrous oxide emissions from continuous winter wheat in the Southern Great Plains. Agron J. 107:1878–1884. doi: 10.2134/agronj15.0096