
ABSTRACT
Wheat genotypes with pre- and post-anthesis drought tolerance offer enhanced yield gains under water-limited environments. This study determined pre- and post-anthesis drought responses of selected bread wheat genotypes in order to identify and select candidate genotypes for breeding. Fifteen genetically differentiated wheat genotypes were evaluated under non-stressed (NS), pre-anthesis drought stress (PrADS) and post-anthesis drought stress (PoADS) in glasshouse (GH) and field (FLD) environments. Data were collected on agronomic and physiological traits including number of days to heading (DTH), days to maturity (DTM), plant height (PH), number of spikelet per spike (NSPS), number of kernels per spike (NKPS), thousand kernel weight (TKW), grain yield (GY) and canopy temperature (CT). Analysis of variance revealed significant effects of genotypes, environments and their interactions for studied traits. Weak and positive correlations were recorded between GY with PH (r = 0.47 and 0.32), NSPS (r = 0.37 and 0.52) and TKW (r = 0.30 and r = 0.20) under PrADS and PoADS conditions, respectively. Genotypes SMY-006, SMY-008, SMY-016, SMY-042 and SMY-044 were identified with pre- and post-anthesis drought tolerance and high yield potential and suitable yield-component traits. These are useful genetic stocks for breeding or cultivation in water-limited environments to improve yield gains.
Introduction
Bread wheat (Triticum aestivum L.) is the most widely cultivated and consumed cereal crop globally followed by maize (Zea mays L.) and rice (Oryza sativa L.) (FAOSTAT Citation2019). A relatively large proportion of the crop is cultivated under marginal environments, and this has resulted in low yield gains in many wheat-producing countries (Sharma et al. Citation2012; Beche et al. Citation2014; Aisawi et al. Citation2015; Dube et al. Citation2019; Keser et al. Citation2017). Drought stress during key developmental stages such as pre- and post-anthesis stages results in yield losses in wheat (Liwani, Magwaza, Odindo et al. Citation2019; Thungo et al. Citation2019). Furthermore, grain yield potential is variable, partly attributed by genotype-by-environment interaction effects (Morgounov et al. Citation2010; Chen et al. Citation2012; Guzmán et al. Citation2016; Crespo-Herrera et al. Citation2018; Quintero et al. Citation2018; Matlala et al. Citation2019; Thungo et al. Citation2019). Developing wheat genotypes with stable performance under drought stress is useful to improve yields especially under water-limited environments (Mkhabela et al. Citation2019; Liwani, Magwaza, Sithole et al. Citation2018; Thungo et al. Citation2019).
Breeding efforts by various national and international programmes to improve yield potential resulted in the release of high-yielding wheat genotypes in different regions (Li et al. Citation2014; Aisawi et al. Citation2015; Balota et al. Citation2017; Gao et al. Citation2017; Guzmán et al. Citation2017; Thapa et al. Citation2018). Agronomic traits, such plant height, days to heading and maturity, biomass accumulation, harvest index, grain number per spike, number of kernels per spike and thousand seed weight, significantly impacted yield gains in wheat (Lopes et al. Citation2012; Gummadov et al. Citation2015; Zhang et al. Citation2016; Gao et al. Citation2017; Yao et al. Citation2019). Physiological traits including enhanced photosynthetic capacity, stomatal conductance, transpiration rate, water-use efficiency, chlorophyll content and canopy temperature are associated with grain yield improvement in wheat (Lopes et al. Citation2012; Beche et al. Citation2014; Gao et al. Citation2017; Thapa et al. Citation2018). Agronomic and physiological traits are well-associated with grain yield under water-constrained environments (Chen et al. Citation2012; Abdolshahi et al. Citation2015; Liu et al. Citation2015; Mwadzingeni et al. Citation2016; Mkhabela et al. Citation2019), useful for breeding for drought tolerance and yield improvements. It has been suggested that the strategic recombination of genetically diverse and complementary wheat genotypes possessing desirable traits may likely improve yield gains under heat and drought-stressed environments (Lopes et al. Citation2012; Reynolds et al. Citation2017; Crespo-Herrera et al. Citation2018; Liu et al. Citation2018).
Wheat improvement programmes including the International Maize and Wheat Improvement Centre (CIMMYT) and various national breeding programs have pre-breeding programs and develop (heat and drought stress-tolerant genotypes. These genetic resources are shared globally for breeding or cultivation in dry arid and semi-arid to improve yield gains (Mondal et al. Citation2016; Guzmán et al. Citation2017; Pinto et al. Citation2017; Hernández-Espinosa et al. Citation2018; Crespo-Herrera et al. Citation2018). The germplasm serves as a useful source of genes for breeding for enhanced agronomic and physiological performance under targeted production environments (Reynolds et al. Citation2017; Hernández-Espinosa et al. Citation2018).
In South Africa, wheat yield levels and genetic gains remained stagnated under the rain-fed production systems due to recurrent and severe drought conditions (Dube et al. Citation2019). Yield gains in South Africa are estimated at ∼ 0.80% yr−-1 compared with the potential level of 1.5% yr−-1. The low yield gains in the country are attributed to the cultivation of low-yielding and drought-susceptible commercial wheat genotypes (Dube et al. Citation2019). Efforts to develop high-yielding wheat genotypes for drought-prone wheat-producing areas of South Africa resulted in the acquisition of diverse wheat genotypes from CIMMYT. Genetic analysis of these germplasm resources using simple sequence repeat (SSR) markers aided selection of 15 genetically differentiated genotypes for subsequent selection for population development and advancement. Therefore, the identified genotypes require rigorous evaluation using yield, yield-related traits and physiological attributes to identify suitable genotypes and key traits for strategic breeding and cultivar development. Therefore, the objective of this study was to determine pre- and post-anthesis drought tolerance of selected bread wheat genotypes to identify and select candidate genotypes for breeding.
Materials and methods
Plant materials and study environments
Fifteen wheat genotypes acquired from CIMMYT’s heat and drought nurseries were used for this study (). From pre-evaluation using a pool of 47 genotypes, the 15 genotypes had better agronomic performance and were genetically unrelated based on SSR genotyping. The selected genotypes were evaluated under glasshouse (GH) and field (FLD) environments during the 2016 cropping season at the University of KwaZulu-Natal’s (UKZN) Controlled Environment Research Unit and Ukulinga Research Farm, Pietermaritzburg, South Africa, respectively. The field experiment was conducted under a rainout shelter using soil covered with a custom-made plastic mulch to exclude rainfall and soil water evaporation. Field weather data were accessed from UKZN’s Centre for Water Resources Research. Environmental variables recorded under the FLD environment during the study period are presented in . Under the GH environment, day/night temperatures were maintained at 30°C/25°C, while relative humidity was maintained between 45% and 55% throughout the study.
Table 1. Names and pedigrees of bread wheat genotypes used in the study.
Table 2. Weather data for Ukulinga Research Farm during the study period.
Experimental design and crop establishment
The study was conducted using a factorial treatment structure in a randomised complete block design (RCBD) with 3 replications. It comprises the following factors: genotype (15 levels), drought condition (3 levels) (non-stressed [NS], pre-anthesis drought stress [PrADS] and post-anthesis drought stress [PoADS]) both under GH and FLD environments. This resulted in six test environments.
For the GH environment, the seed of each genotype was sown in 5L capacity plastic pots filled with a sterilised pine bark growth media under drip irrigation. Under the FLD environment, seeds were sown in a clay loam soil using a custom-made plastic mulch rainout system, with a sub-surface drip irrigation system. Water was supplied twice at a rate of 4.0 mm per day and soil moisture was monitored using Irrometer Moisture Indicator (The Irrometer Company, CA, USA). A drip line irrigation was installed to supply water in each pot. The plot length was 1.5 m with intra-row and inter-row spacing of 15 and 45 cm, respectively. PrADS was imposed by withholding irrigation 1 week before 50% flowering, whereas PoADS was imposed by withholding irrigation 1 week after 50% flowering. Duration of drought stress was 25 and 24 days under GH and FLD environments, respectively. A fully irrigated water treatment (field capacity) was used as a comparative control. After plant establishment, hand weeding was practised weekly and cutworm and aphid infestation were controlled using insecticide Karate twice a month (Syngenta, South Africa). Powdery mildew infection was controlled using TILT foliar fungicide spray twice a month.
Agronomic practices
Based on soil fertility analysis, the following fertilisers were applied: urea (N content = 46%), double superphosphate (P content = 36%) and potassium sulphate (K content = 40–44%) at a rate of 90, 90 and 60 kg ha−1, in that order. Urea was applied in three splits during tillering, booting and post-anthesis stages, whereas double superphosphate and potassium sulphate were applied at planting.
Data collection
Agronomic traits
Data were collected for the following agronomic traits: number of days to 50% flowering (DF) recorded from sowing date to the day 50% of genotypes’ heads were exposed, the number of days to 50% maturity (DM) recorded from the sowing date to the day when 50% of plant populations displayed complete loss of green colour of the spikes and half-way of the peduncle, plant height (PH) in cm from the ground to the tip of the flag leaf of the main tiller, the number of spikelets per spike (NSPS), the number of grains per spike (NKPS), thousand kernel weight (TKW) determined using a sensitive balance measured from randomly sampled 1000 seeds after harvest and expressed in g/1000 seed. Five plants were randomly sampled, tagged for data collection of yield-component traits. At maturity, grain yield (GY) was determined in grams. GY was recorded on a pilot basis. GY is the product of the number of productive tillers, the number of grains per spike, seed weight and the number of plants per plot. From the pot experiment, GY was extrapolated based on five plants to agree with data for the field environment.
Canopy temperature
Canopy temperature (CT) was measured using a Major Tech High-Temperature Infrared Thermometer (MT694) (Major Tech JHB, South Africa) and values expressed in degrees Celsius (°C). Measurements were made between 09:00 am to 12:00 pm on clear and cloudless days 10 (CT1) and 17 (CT2) days after imposing drought stress under both glasshouse and field conditions. CT1 and CT2 represented canopy temperature measurements at early and mid-grain-filling stages, respectively. Measurements were taken by pointing the infrared thermometer toward the canopy, and the trigger was pressed turning on the red guidance light. The position was held until a stable average reading was displayed. The procedure was done twice for each experimental unit.
Data analysis
Data were analysed following a combined analysis of variance (ANOVA) after a test of homogeneity of variance to determine main and interaction effects in Genstat 20th edition (VSN International, Hempstead, UK). Pearson’s correlation coefficients (r) were estimated among agronomic traits and canopy temperature based on average data for each drought condition across environments using RStudio version 3.2.1 (R Development Core Team, 2008). Principle component analysis (PCA) based on the correlation matrix was performed based on average data across each drought condition across environments using SPSS to identify influential traits for selection. Principal component bi-plots were constructed using Genstat 20th edition (VSN International, Hempstead, UK, 2019) to detect relationships between genotypes and studied traits for effective selection.
Results
Effect of genotypes, drought condition, and testing environments and their interaction on agronomic traits and canopy temperature
Combined analysis of variance revealed highly significant (P < 0.001) genotype, environment, drought condition and their interaction effects for most of the studied traits (). Genotype × drought condition interaction effect was non-significant for DF, DM, PH, NKPS, TKW and CT1. Genotype × environment ×drought condition was significant for CT2. Significant G × E effects on studied agronomic and physiological traits suggested varied responses of tested bread wheat genotypes.
Table 3. Combined analysis of variance and significant tests for agronomic traits and canopy temperature among 15 wheat genotypes evaluated in glasshouse and rainout shelter environments under non-stressed, pre- and post-anthesis drought stress conditions.
Agronomic and canopy temperature responses of wheat genotypes across drought conditions in the glasshouse environment
Agronomic and physiological responses of among wheat genotypes under NS, PrADS and PoADS in GH environment are presented in . Genotypes SYM-004, SYM-027 and SYM-014 recorded the lowest DF of 48, 48 and 49 days, respectively. Conversely, SYM-016 and SYM-012 recorded the highest DF of 74 and 84 days. Under PrADS, SYM-004, SYM-014 and SYM-027 were early flowering with ≈ 47 days, whereas SYM-010, SYM-016 and SYM-012 were late flowering (> 70 days). Genotypes SYM-004, SYM-014 and SYM-027 were early flowering (< 50 days), whereas SYM-012 and SYM-016 were late flowering (> 70 days) under PoADS condition.
Table 4. Mean values of agronomic traits and canopy temperature among 15 wheat genotypes evaluated under non-stressed (NS), pre-anthesis (PrADS) and post-anthesis (PoADS) drought stress conditions in the field environment.
The lowest DM (∼ 118 days) was observed for SYM2-004, compared with SYM-008, SYM-012, SYM-016 and SYM-042 which were late maturing and recorded ≥148 DM under NS condition. Under PrADS condition, SYM-006 and SYM-014 were early maturing (∼118 days), compared with SYM-012 which was late maturing (140 days). SYM-004 recorded the lowest DM of 120 days, whereas SYM-012 and SYM-016 were late maturing at 149 and 148 days, respectively, under PoADS condition. For PH, SYM-027 was the shortest (54.23 cm), whereas the highest PH of 103.45 cm was recorded for SYM-008 under NS condition. Genotypes SYM-014 and SYM-027 recorded the lowest PH of 64 and 65 cm, whereas SYM-008 was the tallest recording PH of 96.32 cm under PrADS condition. SYM-027 and SYM-008 recorded the shortest and tallest plants of 54.93 and 100.53 cm under PoADS condition, respectively.
The lowest NSPS of 14 and 12 was recorded for SYM-014 and SYM-047 compared with SYM-012, SYM-042 and SYM-016 (∼19) under PrADS and PoADS conditions. NKPS differed significantly among studied genotypes under PrADS and PoADS conditions. SYM2-019 and SYM-012 recorded the highest NKPS of 44 and 51, compared with the lowest NKPS (29) recorded for SYM-037 under PrADS condition. Under PoADS condition, SYM-027 recorded the lowest NKPS (20), whereas SYM-019 and SYM-012 recorded NKPS of 43 and 45, respectively.
For TKW, SYM-027 and SYM-014 recorded the lowest TKW of 32.63 and 34.60 g, whereas SYM-008, SYM-010, SYM-037 and SYM-044 recorded TKW > 58 g under NS condition. SYM-027 and SYM-037 recorded TKW of 31 g which was the lowest compared with 56.07 and 61.34 g recorded for SYM-016 and SYM-010 under PrADS condition. Under PoADS condition, genotypes SYM-012, SYM-016 and SYM-044 recorded the highest TKW > 58 g.
Significantly lower GY of < 500 g recorded for genotypes SYM-004, SYM-010, SYM-029 and SYM-038, whereas significantly higher GY of > 1000 g was recorded for SYM-037 and SYM-044 under NS condition. Under PrDS condition, SMY-027 and SYM-037 recorded significantly low GY of < 200 g compared with SYM-012 and SYM-016 which were significantly high-yielding recording GY > 500 g. Genotypes SYM-014 and SYM-027 were significantly (p < 0.001) low-yielding recording GY < 200 g under PoADS condition. On the contrary, genotypes SYM-006 and SYM-037 were high-yielding (GY > 500 g) under PoADS condition.
CT1 differed significantly (P < 0.001) among test genotypes across drought conditions. Genotypes SYM-019 and SYM-037 recorded low CT1 with a mean of 16°C, compared with SYM-016, SYM2-042 and SYM-044 which recorded higher CT1 of 18.15°C, 18.40°C and 19.0°C, respectively, under NS condition. SYM-042 and SYM-044 recorded high CT1 of 20.90°C and 21.85°C, compared with low CT1 (15°C) recorded for SYM-027 under PrADS condition. SYM-006 and SYM-012 recorded the lowest and highest CT1 of 15.90°C and 18.10°C, respectively, under PoADS condition.
Genotypic differences were observed for CT2 under NS and PoADS conditions. Under NS condition, SYM-019 and SYM-027 recorded low CT2 of 14.52°C and 14.60°C, whereas SYM-010 and SYM-044 recorded the highest CT2 of > 17°C under similar condition. Genotypes SYM-008 and SYM-047 recorded CT2 of 13.65°C, compared with higher CT2 of 20.25°C, 20.85°C and 22.70°C recorded for SYM-042, SYM-037 and SYM-019 under PoADS condition, in that order.
Agronomic and canopy temperature responses of wheat genotypes under drought conditions in the field environment
The mean values of studied agronomic and physiological traits among wheat genotypes under NS, PrADS and PoADS in the FLD environment are presented in . The lowest DF of 73, 76 and 74 days was recorded for SYM-004 compared with SYM-008 which recorded the highest DF of 93, 94 and 93 days under NS, PrADS and PoADS conditions, respectively.
Table 5. Mean values of agronomic traits and canopy temperature among 15 wheat genotypes evaluated under non-stressed (NS), pre-anthesis (PrADS) and post-anthesis (PoADS) drought stress conditions in the field environment.
Significantly lower DM (123, 119 and 120 days) were observed for SYM-014 compared with higher DM of 144, 144 and 147 days recorded for SYM-037 and SMY-016 under NS, PrADS and PoADS conditions, in that order. The shortest PH of 80, 79 and 82 cm were recorded for genotypes SYM-029, and SYM-014, whereas the highest PH of 99, 99 and 100 cm was recorded for SYM-010, SMY-004 and SMY-047 under NS, PrADS and PoADS conditions, respectively. NSPS varied from 18 (SMY-014) to 23 (SYM-042) under PrADS, and from 19 (SYM-019) to 23 (SYM-037) under PoADS conditions. NKPS varied from 40 (SYM-014) to 73 (SYM-019), and from 43 (SYM-008) to 62 (SYM-012) under both PrADS and PoADS conditions.
TKW did not differ significantly (P > 0.05) among tested wheat genotypes under NS and PrADS conditions (). Under PoADS, highly significant (P < 0.001) genotypic differences were observed for TKW which varied from 34 (SYM-029) to 56.10 g (SYM-008) with a mean of 45.19 g across test genotypes.
Genotypes SYM-014 and SYM-029 recorded the lowest GY of 814 and 854 g, whereas SYM-012, SYM-038, SYM-042 and SYM-044 recorded the highest GY of > 1300 g under NS condition. Under PrDS condition, SYM-029 recorded the lowest GY of 264 g compared with 1308, 1434 and 1673 g recorded for genotypes SYM-008, SYM-037 and SYM-019 under PrADS condition, in that order. Genotypes SYM-012 was low-yielding (GY = 688 g) compared with SYM-042 which was high yielding (GY = 2227 g) under PoADS condition.
CT1 differed significantly (P < 0.001) among studied wheat genotypes only under PoADS across drought conditions (). Except for genotype SYM-016 which recorded low CT1 of 21.49°C, other genotypes recorded CT1 > 27°C. Genotypes SYM-042 and SYM-044 recorded lower CT2 of 17.10°C and 17.25°C, whereas SYM-004 recorded high TC2 of 24.10°C.
Trait association under drought conditions
Pearson correlation coefficients (r) for agronomic traits and canopy temperature under NS, PrADS and PoADS are presented in . Under NS condition, DF positively and significantly correlated with DM (r = 0.75; p < 0.001), PH (r = 0.52; p < 0.05) and TKW (r = 0.57; p < 0.05) across environments ((A)). DM positively and significantly correlated with NSPS (r = 0.65; p < 0.001) and TKW (r = 0.54; p < 0.05) ((A)). PH positively and significantly correlated with TKW (r = 0.62; p < 0.05), TKW (r = 0.79; p < 0.001) and CT1 (r = 0.54; p < 0.05). NSPS was positively associated GY (r = 0.58; p < 0.05) under NS condition across environments. NKPS positively and weakly correlated with GY (r = 0.56; p < 0.05) under NS condition.
Figure 1. Pearson correlation coefficients (r) of agronomic traits and canopy temperature among bread wheat genotypes under non-stress (A), pre-anthesis (B) and post-anthesis (C) drought conditions across test environments. DF; days to 50% flowering DM; days to 50% maturity, PH; plant height, NSPS; number of spikelets per spike, NKPS; number of kernels per spike, TKW; thousand kernel weight, CT1; canopy temperature at early grain-filling stage, CT2; canopy temperature at mid-grain-filling stage.
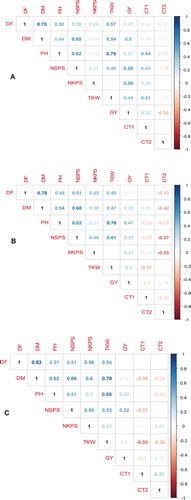
Under PrADS, DF was positively and strongly correlated with DM (r = 0.78; p < 0.001) ((B)). DM positively and weakly correlated with PH (r = 0.54; p < 0.05), but strongly correlated with NSPS (r = 0.68; p < 0.05). PH strongly and positively correlated with NSPS (r = 0.62; p < 0.05) and TKW (r = 0.76; p < 0.001). NSPS positively and significantly associated with TKW (r = 0.61; p < 0.05) and negatively correlated with CT2 (r = −0.57; p < 0.05). NKPS negatively and significantly associated with CT2 (r = −0.55; p < 0.05).
Positive and significant associations were observed between DF with DM (r = 0.83; p < 0.001), PH (r = 0.51; p < 0.05), NSPS (r = 0.51; p < 0.05) and TKW (r = 0.56; p < 0.05) under PoADS condition across environments ((C)). DM positively and strongly correlated with PH (r = 0.62; p < 0.05), NSPS (r = 0.66; p < 0.05), NKPS (r = 0.60; p < 0.05) and TKW (r = 0.79; p < 0.001). PH positively and strongly correlated with TKW (r = 0.68; p < 0.05) under PoADS condition. Positive and significant correlations were observed between NSPS with NKPS (r = 0.55; p < 0.05), TKW (r = 0.53; p < 0.05) and GY (r = 0.52; p < 0.05).
Principal component analysis of studied traits
Explained variance (EV), proportion of total variance (PTV) and cumulative variance (CV) explained for studied traits among wheat genotypes under NS, PrADS and PoADS conditions are presented in . Under NS condition, PCA identified three PCs under NS condition with an explained variation of 74%. PC1 positively correlated with DF and DM, whereas PC2 positively correlated with PH, NSPS, TKW and CT1 with both PCs accounting for 45% and 17% of the total variation, respectively. NKPS and GY recorded positive loading scores with PC3, whereas CT2 recorded a negative loading and all traits accounted for 12% of the total variation.
Table 6. Principal component analysis showing explained variance (VE), proportion of total variance (PTV) and cumulative variance (CV) for agronomic traits and canopy temperature among wheat genotypes under non-stress (NS), pre-anthesis (PrADS) and post-anthesis (PoADS) conditions across test environments.
Under PrADS condition, PCA identified three PCs which accounted for a variation of 76%. DF, DM, PH, NSPS and TKW recorded positive loadings with PC1 which accounted for 45% of the total variation. PC2 recorded a positive loading score with NKPS and a negative loading score with CT2 accounted for 19% of the total variation. PC3 negatively correlated with CT2 which accounted for 12% of the total variation.
Under PoADS condition, PC1 positively correlated with DF, DM, PH, NSPS, NKPS and TKW and accounted for 45% of the total variation. CT1 and CT2 positively correlated with PC2 which accounted for 19% of the total variation, whereas PC3 positively correlated with GY which accounted for 18% of the total variation.
Clustering of bread wheat genotypes based on studied traits
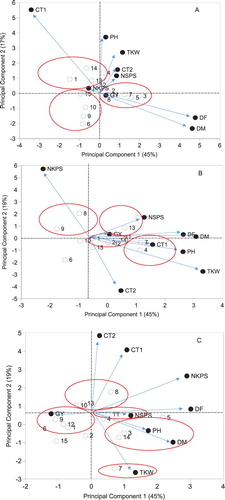
Groupings of wheat genotypes and studied traits under NS, PrADS and PoADS conditions across environments are shown in . Vectors are projected from the biplot origin for studied traits and correlation between traits are shown by smaller angles. Under NS condition, genotypes SYM-040, SYM-010, SYM-038, SYM-042 and SYM-044 recorded large values for NSPS, NKPS, PH, TKW and CT1 ((A)). SMY-006, SMY-008, SMY-016 and SMY-019 grouped together with longer DF and DM. SMY-014, SMY-027 and SMY-029 grouped with higher GY potential under NS condition ((A)). Under PrADS condition, genotypes SMY-019, SMY-027 and SMY-029 were grouped with higher NKPS and GY ((B)). SMY-004, SMY-008, SMY-010, SMY-016, SMY-037 and SMY-044 grouped with high DF, DM, PH, TKW and CT1. Genotypes SMY-019 and SMY-027 grouped based on increased NKPS ((B)). Genotypes SYM-019, SMY-29 and SMY-042 grouped with higher CT1 and CT2 values under PoADS condition ((C)). SYM-004, SMY-014, SMY-027 and SYM-033 grouped with higher GY potential, whereas SMY-008 and SYM-044 grouped based on increased PH and DM ((C)). SMY-016 grouped separately based on higher TKW ((C)).
Figure 2. Clustering of the tested wheat genotypes and assessed traits under non-stress (A), pre-anthesis drought (B) and post-anthesis drought (C) conditions across environments. DF; days to 50% flowering DM; days to 50% maturity, PH; plant height, NSPS; number of spikelets per spike, NKPS; number of kernels per spike, TKW; thousand kernel weight, CT1; canopy temperature at early grain-filling stage, CT2; canopy temperature at mid-grain-filling stage. See the code of genotypes in .
Discussion
Developing wheat genotypes with high drought tolerance during key wheat developmental stages such as anthesis and grain-filling stages is key to improve yield potential and gains under water-limited environments. The current study screened wheat genotypes for pre- and post-anthesis drought responses to identify and select candidate genotypes for breeding or cultivation in drought-prone environments to improve yield gains. Genotype, environment and genotype × environment interaction effects were significant for assessed traits suggesting a differential response of genotypes. This is useful to identify and select key agronomic traits useful for cultivar improvement and deployment for improving yield in low-yielding and drought-prone environments ().
Agronomic traits are widely targeted in wheat improvement programmes to develop high-yielding genotypes with enhanced levels of abiotic stress tolerance (Chen et al. Citation2012; Lopes et al. Citation2012; Sharma et al. Citation2012; Aisawi et al. Citation2015; Wu et al. Citation2014; Gao et al. Citation2017). Breeding early flowering and maturing wheat genotypes is an important breeding objective associated with drought escape and avoidance (Chen et al. Citation2016; Mondal et al. Citation2016; Ochagavía et al. Citation2018). In the present study, pre- and post-anthesis drought stress had a negligible effect on flowering and maturation times across the studied wheat genotypes ( and ). Further, DF and DM were poorly and non-significantly correlated with grain yield under drought stress conditions ((B and C)), indicating that the studied wheat population does not enhance grain yield potential by manipulating phenology. Similar to present findings, Mwadzingeni et al. (Citation2016) reported poor and non-significant correlations between DF and DM with grain yield, but positive associations with yield-related traits in wheat under drought stress condition. Chairi et al. (Citation2018) and Yao et al. (Citation2019) reported wheat yield gains over time were not attributed by phenological variation. However, DF and DM positively and significantly correlated with plant height, number of spikelets per spike, number of kernels per spike and thousand kernel weight across drought conditions ((B and C)), suggesting phenology may affect grain yield potential through its effects on yield-component traits.
Plant height is a key trait that enhances yield potential and gains in wheat (Beche et al. Citation2014; Gummadov et al. Citation2015; Würschum et al. Citation2015; Zhang et al. Citation2016). The current study revealed positive correlations between plant height with a number of seeds per spike, thousand kernel weight and grain yield under drought stress conditions ((B and C)) suggesting higher plant height enhanced yield potential (Mwadzingeni et al. Citation2016). Plant height of 70–100 cm is reportedly optimum for improving yield potential in wheat (Beche et al. Citation2014; Chairi et al. Citation2018; Yao et al. Citation2019). Most of the test genotypes in the present study maintained plant height within this critical threshold level ( and ).
The number of spikelets per spike has a direct effect on the number of grains per spike resulting in grain yield improvement (Chairi et al. Citation2018; Würschum et al. Citation2018). Positive correlations were recorded between the number of spikelets per spike with the number of grains per spike, thousand kernel weight and grain yield amongst the tested genotypes under drought stress ((B and C)). Álvaro et al. (Citation2008) reported poor correlations between grain number per spike and the number of spikelets per spike contradicting the present findings. Conversely, Mwadzingeni et al. (Citation2016) and Würschum et al. (Citation2018) reported a positive association between the number of spikelets per spike and the number of kernels per spike concurring with the current study. Therefore, a strategic crossing of novel wheat genotypes possessing high spikelet number per spike, number of kernels per spike and thousand kernel weight is useful to improve yield potential under water-limited environments (Gaju et al. Citation2009; Gao et al. Citation2017).
The number of grains per spike is a useful agronomic trait for improving grain yield potential and gains in wheat (Yu et al. Citation2014; Alonso et al. Citation2018; Würschum et al. Citation2018; Liu et al. Citation2018). The present study revealed a moderate and positive correlation between the number of grains per spike with grain yield under pre-anthesis drought and poor correlation between the same traits under post-anthesis drought stress condition ((B and C)). Grain yield improvement under pre-anthesis drought stress condition could partly be explained by the cooler canopy (r = −0.55) compared with high canopy temperature (r = 0.23) under post-anthesis drought conditions, respectively. The lack of association between grain yield and grain number is reportedly caused by the trade-off between these two yield components, attributed to higher canopy temperatures during grain filling (Quintero et al. Citation2018). The positive correlation observed between the number of kernels per spike and thousand kernel weight (r = 0.31) under post-anthesis drought stress condition suggests that selection for a higher number of grains per spike and thousand kernel weight may offset grain yield among test genotypes (Bustos et al. Citation2013). Therefore, the simultaneous selection of these traits is possible and can improve yield gains among the studied wheat populations.
Grain yield potential and gains in wheat are significantly associated with higher thousand kernel weight (Morgounov et al. Citation2010; Tian et al. Citation2011; Zheng et al. Citation2011; Lopes et al. Citation2012; Aisawi et al. Citation2015). The current study revealed low and positive correlations between thousand kernel weight and grain yield (r = 0.30; r = 0.20) under pre- and post-anthesis drought stress conditions compared with non-stress condition (r = 0.41). These observations are in agreement with previous reports that suggested selection response for thousand kernel weight is limited under low-yielding environments (Sharma et al. Citation2012; Lopes et al. Citation2012). Simultaneous breeding for high grain number and thousand kernel weight has been limited and slow due to trade-offs between these yield-related traits (Gaju et al. Citation2009). The present study revealed positive correlations between thousand kernel weight and number of kernels per spike under non-stressed (r = 0.46), pre-anthesis (r = 0.61) and post-anthesis (r = 0.53) drought stress conditions. This suggested selection for higher kernel weight and the number of spikelets per spike will likely improve grain yield among the studied wheat population. Gaju et al. (Citation2009) suggested selecting genotypes with a higher number of spikelets per spike is critical to increases in grain number and thousand kernel weight. Further, Bustos et al. (Citation2013) suggested recombination of wheat genotypes expressing high grain number and thousand kernel weight is a useful strategy to increase yield potential in wheat
Canopy temperature is an important physiological trait associated with drought tolerance useful to identify high-yielding wheat genotypes under water-limited environments (Olivares-Villegas et al. Citation2007; Thapa et al. Citation2018). Further, canopy temperature is well-associated with yield gains in wheat (Lopes et al. Citation2012; Pinto et al. Citation2017; Thapa et al. Citation2018). Canopy temperature at early grain-filling poorly and negatively (r = −0.20; r = −0.20) correlated with grain yield under both pre- and post-anthesis drought stresses ((B and C)). This indicated a cooler canopy temperature during early grain filling can improve yield potential in wheat. On the contrary, canopy temperature at mid-grain-filling stage positively and poorly correlated with grain yield (r = 0.15; r = 0.17) among wheat genotypes under both drought conditions ((B and C)), suggesting higher canopy temperature during mid-grain-filling stages may not improve grain yield potential. Similar to the current study, Amani et al. (Citation1996) and Olivares-Villegas et al. (Citation2007) reported highly significant and positive correlations between canopy temperature and grain yield among wheat genotypes under drought stress condition. Generally, cooler plant canopy during mid-grain filling is associated with enhanced drought tolerance and yield potential under the water-limited condition in wheat (Thapa et al. Citation2018).
Developing drought-tolerant wheat genotypes through targeted selection of yield-component traits that improve yield response and drought-adaptation is useful to improve yield potential and gains in water-stressed environments (Sharma et al. Citation2012; Cossani and Reynolds Citation2015; Mondal et al. Citation2016; Crespo-Herrera et al. Citation2018; Guzmán et al. Citation2017; Hernández-Espinosa et al. Citation2018). The present study identified genotypes SMY-006, SMY-008, SMY-016, SMY-042 and SMY-044 as high-yielding under pre- and post-anthesis drought stress conditions suitable for direct cultivation in heat and drought-stressed environments ( and ; (B and C)). Further, the identified wheat genotypes are useful genetic resources for the strategic crossing to develop breeding populations to improve yield gains under water-limited environments.
In conclusion, the current study assessed drought response of wheat genotypes to identify pre- and post-anthesis drought-tolerant genotypes for cultivation or breeding for water-stressed environments. Heat and drought-tolerant wheat genotypes such as SMY-006, SMY-008, SMY-016, SMY-042 and SMY-044 were identified as drought tolerant and high-yielding useful for breeding or cultivation in water-limited environments to improve yield potential and gains.
Acknowledgments
Thanks are due to CIMMYT for the provision of the elite wheat genotypes used in the study. The University of KwaZulu-Natal and National Research Foundation of South Africa are acknowledged for all-round support of this study.
Disclosure statement
No potential conflict of interest was reported by the author(s).
Notes on contributors
Sibusiswangaye Yolanda Mdluli is currently a PhD student in Plant Breeding at the University of KwaZulu-Natal, African Centre for Crop Improvement, South Africa.
Prof. Hussein Shimelis is a Plant Breeder, Chair of Crop Science and Deputy Director for the African Centre for Crop Improvement (ACCI) at the University of KwaZulu-Natal, South Africa.
Dr Jacob Mashilo is a Crop Scientist at the Limpopo Department of Agriculture and Rural Development (Research Services), Towoomba Research Station, Bela-Bela, Limpopo Province, South Africa.
ORCID
Jacob Mashilo http://orcid.org/0000-0001-9015-043X
Additional information
Funding
References
- Abdolshahi R, Nazari M, Safarian A, Sadathossini TS, Salarpour M, Amiri H. 2015. Integrated selection criteria for drought tolerance in wheat (Triticum aestivum L.) breeding programs using discriminant analysis. Field Crops Res. 174:20–29. doi: 10.1016/j.fcr.2015.01.009
- Aisawi KAB, Reynolds MP, Singh RP, Foulkes MJ. 2015. The physiological basis of the genetic progress in yield potential of CIMMYT spring wheat cultivars from 1966 to 2009. Crop Sci. 55:1749–1764. doi: 10.2135/cropsci2014.09.0601
- Alonso MP, Mirabella NE, Panelo JS. 2018. Selection for high spike fertility index increases genetic progress in grain yield and stability in bread wheat. Euphytica. 214:112–125. doi: 10.1007/s10681-018-2193-4
- Álvaro F, Isidro J, Villegas D, García del Moral LF, Royo C. 2008. Old and modern durum wheat varieties from Italy and Spain differ in main spike components. Field Crops Res 106:86–93. doi: 10.1016/j.fcr.2007.11.003
- Amani I, Fischer RA, Reynolds MP. 1996. Canopy temperature depression association with yield of irrigated spring wheat cultivars in a hot climate. J Agron Crop Sci. 176:119–129. doi: 10.1111/j.1439-037X.1996.tb00454.x
- Balota M, Green AJ, Griffey CA, Pitman R, Thomason W. 2017. Genetic gains for physiological traits associated with yield in soft red winter wheat in the Eastern United States from 1919 to 2009. Eur J Agron. 84:76–83. doi: 10.1016/j.eja.2016.11.008
- Beche E, Benin D, Da Silva CL, Munaro LB, Marchese JA. 2014. Genetic gain in yield and changes associated with physiological traits in Brazilian wheat during the 20th century. Eur J Agron. 61:49–59. doi: 10.1016/j.eja.2014.08.005
- Bustos DV, Hasan AK, Reynolds MP, Calderini DF. 2013. Combining high grain number and weight through a DH-population to improve grain yield potential of wheat in high-yielding environments. Field Crops Res. 145:106–115. doi: 10.1016/j.fcr.2013.01.015
- Chairi F, Vergara-Diaz O, Vatter T, Aparicio N, Nieto-Taladriz MT, Kefauver SC, Bort J, Serret MD, Araus JL. 2018. Post-green revolution genetic advance in durum wheat: The case of Spain. Field Crops Res. 228:158–169. doi: 10.1016/j.fcr.2018.09.003
- Chen X, Min D, Yasir TA, Hu YG. 2012. Evaluation of 14 morphological, yield-related and physiological traits as indicators of drought tolerance in Chinese winter bread wheat revealed by analysis of the membership function value of drought tolerance (MFVD). Field Crops Res. 137:195–201. doi: 10.1016/j.fcr.2012.09.008
- Chen H, Moakhar NP, Iqbal M, Pozniak C, Hucl P, Spaner D. 2016. Genetic variation for flowering time and height reducing genes and important traits in western Canadian spring wheat. Euphytica. 208:377–390. doi: 10.1007/s10681-015-1615-9
- Cossani CM, Reynolds MP. 2015. Heat stress adaptation in elite lines derived from synthetic hexaploid wheat. Crop Sci. 55:2719–2735. doi: 10.2135/cropsci2015.02.0092
- Crespo-Herrera LA, Crossa J, Huerta-Espino J, Vargas M, Mondal S, Velu G, et al. 2018. Genetic gains for grain yield in CIMMYT’s semi-arid wheat yield trials grown in suboptimal environments. Crop Sci. 58:1890–1189. doi: 10.2135/cropsci2018.01.0017
- Dube E, Kilian W, Mwadzingeni L, Sosibo NZ, Barnard A, Tsilo TJ. 2019. Genetic progress of spring wheat grain yield in various production regions of South Africa. SA J Plant Soil. 36:1, 33–39. doi: 10.1080/02571862.2018.1469793
- FAOSTAT. 2019. [Accessed 2019 September 18]. http://www.fao.org/faostat/en/#data/QC.
- Gaju O, Reynolds MP, Sparkes DL, Foulkes MJ. 2009. Relationships between large-spike phenotype, grain number, and yield potential in spring wheat. Crop Sci. 49:961–973. doi: 10.2135/cropsci2008.05.0285
- Gao F, Ma D, Yin G, Rasheed A, Dong Y, Xiao Y, Xia X, Wu X, He Z. 2017. Genetic progress in grain yield and physiological traits in Chinese wheat cultivars of Southern Yellow and Huai Valley since 1950. Crop Sci. 57:760–773. doi: 10.2135/cropsci2016.05.0362
- Gummadov N, Keser M, Akin B, Cakmak M, Mert Z, Taner S, Ozturk I, Topal A, Yazar S, Morgounov A. 2015. Genetic gains in wheat in Turkey: winter wheat for irrigated conditions. Crop J. 3:507–516. doi: 10.1016/j.cj.2015.07.007
- Guzmán C, Autrique E, Mondal S, Huerta-Espino J, Singh RP, Vargas M, Crossa J, Amaya A, Peña RJ. 2017. Genetic improvement of grain quality traits for CIMMYT semi-dwarf spring bread wheat varieties developed during 1965–2015: 50 years of breeding. Field Crops Res. 210:192–196. doi: 10.1016/j.fcr.2017.06.002
- Guzmán C, Autrique JE, Mondal S, Singh RP, Govindan V, Morales-Dorantes A, Posadas-Romano G, Crossa J, Ammar K, Peña RJ. 2016. Response to drought and heat stress on wheat quality, with special emphasis on bread-making quality, in durum wheat. Field Crops Res. 186:157–165. doi: 10.1016/j.fcr.2015.12.002
- Hernández-Espinosa N, Mondal S, Autrique E, Gonzalez-Santoyo H, Cross J, Huerta-Espino J, Singh RV, Guzmán C. 2018. Milling, processing and end-use quality traits of CIMMYT spring bread wheat germplasm under drought and heat stress. Field Crops Res. 215:104–112. doi: 10.1016/j.fcr.2017.10.003
- Keser M, Gummadov N, Akin B, Belen S, Mert Z, Taner S, Topal A, Yazar S, Morgounov A, Sharma RC, Ozdemir F. 2017. Genetic gains in wheat in Turkey: Winter wheat for dryland conditions. Crop J. 5:533–540. doi: 10.1016/j.cj.2017.04.004
- Li K, Yang X, Liu Z, Zhang T, Lu S, Liu Y. 2014. Low yield gap of winter wheat in the North China Plain. Eur J Agron. 59:1–12. doi: 10.1016/j.eja.2014.04.007
- Liu C, Yang Z, Hu YG. 2015. Drought resistance of wheat alien chromosome addition lines evaluated by membership function value based on multiple traits and drought resistance index of grain yield. Field Crops Res. 179:103–112. doi: 10.1016/j.fcr.2015.04.016
- Liu D, Zhang L, Hao M, Ning S, Yuan Z, Dai S, Huang L, Wu B, Yan Z, Lan X, Zheng Y. 2018. Wheat breeding in the hometown of Chinese Spring. Crop J. 6:82–90. doi: 10.1016/j.cj.2017.08.009
- Liwani U, Magwaza LS, Sithole NJ, Odindo AO, Tsilo TJ. 2018. Physiological responses of irrigated wheat (Triticum aestivum L.) genotypes to water stress. Acta Agric Scand Sect B Soil Plant Sci. 68:524–533.
- Liwani U, Magwaza LS, Odindo AO, Sithole NJ. 2019. Growth, morphological and yield responses of irrigated wheat (Triticum aestivum L.) genotypes to water stress. Acta Agric Scand Sect B Soil Plant Sci. 69:369–376.
- Lopes MS, Reynolds MP, Manes Y, Singh RP, Crossa J, Braun HJ. 2012. Genetic yield gains and changes in associated traits of CIMMYT spring bread wheat in a “historic” set representing 30 years of breeding. Crop Sci. 52:1123–1131. doi: 10.2135/cropsci2011.09.0467
- Matlala M, Shimelis H, Mashilo J. 2019. Genotype-by-environment interaction of grain yield among candidate dryland wheat genotypes. S Afr J Plant Soil. 6:299–306. doi: 10.1080/02571862.2019.1566502
- Mkhabela SS, Shimelis H, Odindo AO, Mashilo J. 2019. Response of selected drought tolerant wheat (Triticum aestivum L.) genotypes for agronomic traits and biochemical markers under drought-stressed and non-stressed conditions. Acta Agric Scand Sect B Soil Plant Sci. 69(8):674–689.
- Mondal S, Singh RP, Mason ER, Huerta-Espino J, Autrique E, Joshi AK. 2016. Grain yield, adaptation and progress in breeding for early-maturing and heat-tolerant wheat lines in South Asia. Field Crops Res. 192:78–85. doi: 10.1016/j.fcr.2016.04.017
- Morgounov A, Zykinb V, Belanb I, Roseevab L, Zelenskiyc Y, Gomez-Becerrad HF, Budakd H, Bekes F. 2010. Genetic gains for grain yield in high latitude spring wheat grown in Western Siberia in 1900–2008. Field Crops Res. 117:101–112. doi: 10.1016/j.fcr.2010.02.001
- Mwadzingeni L, Shimelis H, Tesfay S, Tsilo TJ. 2016. Screening of bread wheat genotypes for drought tolerance using phenotypic and proline analyses. Front Plant Sci. 7:1–12. doi: 10.3389/fpls.2016.01276
- Ochagavía H, Prieto P, Savin R, Griffiths S, Slafer G. 2018. Dynamics of leaf and spikelet primordia initiation in wheat as affected by Ppd-1a alleles under field conditions. J Exp Bot. 69:2621–2631. doi: 10.1093/jxb/ery104
- Olivares-Villegas JJ, Reynolds MP, McDonald GK. 2007. Drought-adaptive attributes in the Seri/Babax hexaploid wheat population. Funct Plant Biol. 34:189–203. doi: 10.1071/FP06148
- Pinto RS, Molero G, Reynolds MP, Ibrahim A. 2017. Identification of heat tolerant wheat lines showing genetic variation in leaf respiration and other physiological traits. Euphytica. 213:76. doi: 10.1007/s10681-017-1858-8
- Quintero A, Molero G, Reynolds MP, Calderini DF. 2018. Trade-off between grain weight and grain number in wheat depends on G x E interaction: A case study of an elite CIMMYT panel (CIMCOG). Eur J Agron. 92:17–29. doi: 10.1016/j.eja.2017.09.007
- Reynolds MP, Pask AJD, Hoppitt WJE, Sonder K, Sukumaran S, Molero G. 2017. Strategic crossing of biomass and harvest index-source and sink-achieves genetic gains in wheat. Euphytica. 213:257. doi: 10.1007/s10681-017-2040-z
- Sharma RC, Crossa J, Velu G, Huerta-Espino J, Vargas M, Payne TS, Singh RP. 2012. Genetic gains for grain yield in CIMMYT Spring bread wheat across International environments. Crop Sci. 52:1522–1533. doi: 10.2135/cropsci2011.12.0634
- Thapa S, Jessup KE, Pradhan GP, Rudd JC, Liu S, Mahan JR, Devkota RN, Baker JA, Xue Q. 2018. Canopy temperature depression at grain filling correlates to winter wheat yield in the U.S. Southern high Plains. Field Crops Res. 217:11–19. doi: 10.1016/j.fcr.2017.12.005
- Thungo Z, Shimelis H, Odindo AO, Mashilo J. 2019. Genotype-by-environment interaction of elite heat and drought tolerant bread wheat (Triticum aestivum L.) genotypes under non-stressed and drought-stressed conditions. Acta Agric Scand Sect B Soil Plant Sci. 69:725–733.
- Tian Z, Jing Q, Dai T, Jiang D, Cao W. 2011. Effects of genetic improvements on grain yield and agronomic traits of winter wheat in the Yangtze River Basin of China. Field Crops Res. 124:417–425. doi: 10.1016/j.fcr.2011.07.012
- Wu W, Li C, Ma B. 2014. Genetic progress in wheat yield and associated traits in China since 1945 and future prospects. Euphytica. 196:155–168. doi: 10.1007/s10681-013-1033-9
- Würschum T, Langer SM, Longin CFH. 2015. Genetic control of plant height in European winter wheat cultivars. Theor Appl Genet. 128:865–874. doi: 10.1007/s00122-015-2476-2
- Würschum T, Leiser WL, Langer SM. 2018. Phenotypic and genetic analysis of spike and kernel characteristics in wheat reveals long-term genetic trends of grain yield components. Theor Appl Genet. 131:2071–2084. doi: 10.1007/s00122-018-3133-3
- Yao Y, Lv L, Zhang L, Yao H, Dong Z, Zhang J, Ji J, Jia X, Wang H. 2019. Genetic gains in grain yield and physiological traits of winter wheat in Hebei Province of China, from 1964 to 2007. Field Crops Res. 239:114–123. doi: 10.1016/j.fcr.2019.03.011
- Yu M, Mao S, Chen G. 2014. QTLs for uppermost internode and spike length in two wheat RIL populations and their affect upon plant height at an individual QTL level. Euphytica. 200:95–108. doi: 10.1007/s10681-014-1156-7
- Zhang Y, Xu W, Wang W, Dong H, Qi X, Zhao M, Fang Y, Gao Y, Hu L. 2016. Progress in genetic improvement of grain yield and related physiological traits of Chinese wheat in Henan Province. Field Crops Res. 199:117–128. doi: 10.1016/j.fcr.2016.09.022
- Zheng TC, Zhang XK, Yina GH, Wanga LN, Hana YL, Chen L, et al. 2011. Genetic gains in grain yield, net photosynthesis and stomatal conductance achieved in Henan Province of China between 1981and 2008. Field Crops Res. 122:225–233. doi: 10.1016/j.fcr.2011.03.015