
 ?Mathematical formulae have been encoded as MathML and are displayed in this HTML version using MathJax in order to improve their display. Uncheck the box to turn MathJax off. This feature requires Javascript. Click on a formula to zoom.
ABSTRACT
The objective of this study was to determine phenotypic variation for yield and yield-related traits among cowpea genotypes and select best candidate genotypes for breeding. Hundred cowpea genotypes were evaluated across two environments using an alpha lattice design with two replications. The pooled data were subjected to analysis of variance, correlation and principal component analyses (PCA). Significant differences were observed among cowpea genotypes for assessed traits. PCA revealed three principal components contributing to 77.75% of the total variation. Grain yield was significantly correlated with most of the traits. The genotypic coefficient of variation was relatively higher, whereas the phenotypic coefficient of variation values were moderate for branch number, seed number per pod, and high for seed number per plant and pod weight per plant. Heritability and genetic advance values respectively ranged from 37.27% to 97.2% and 73.3% to 2242.6% for the studied traits. High direct path coefficient value of 0.71 for pod weight per plant with highly significant correlation with grain yield was observed. The study identified cowpea genotypes such as Glenda RV 465, RV 574, RV 115, RV 28, RV 419, RV 28, RV 419, RV 213, RV 550, RV 470, RV 111, RV 315 and RV 550 with better responses for yield and yield-related traits.
Introduction
Cowpea [Vigna unguiculata (L.) Walp., Fabaceae (2n = 2× = 22)] is an important legume crop in the tropics and sub-tropical regions of the world (Ehlers and Hall Citation1997; Freire-Filho et al. Citation2005), and it is often the primary source of protein and minerals for low-income populations in such regions (Gerrano, van Rensburg, Kutu Citation2019). Most of the world’s cowpea production is produced in sub-Saharan African (SSA) countries such as Nigeria, Burkina Faso, United Republic of Tanzania, Cameroon, Niger, Mali and Kenya (FAOSTAT Citation2018). In South Africa, the crop is predominantly grown by small-scale farmers under dryland conditions due to its inherent drought tolerance and atmospheric nitrogen fixation (i.e. rhizobium bacteria) which allows it to grow and improve poor soil fertility an essential component in many cropping systems (Fall et al. Citation2003). Several plant parts including its grains, green pods and leaves are consumed as leafy vegetable, whereas the vines/haulms are used as animal feed (Oyekan Citation1977). As a result, genetic improvement of the crop through development of agronomically superior genotypes possessing farmer-preferred traits and enhanced nutrition is useful for improving food security in SSA (Gerrano, van Rensburg, Kutu Citation2019; Gerrano, van Rensburg, Venter, et al. Citation2019). Development of highly superior and high-performing genotypes can be achieved through exploitation of cowpea genetic resources to identify and select suitable genotypes with desirable phenotypic traits for use in improvement programmes (Desalegne et al. Citation2016; Lazaridi et al. Citation2017; Xiong et al. Citation2018).
Phenotypic diversity analysis using morphological traits has been extensively used to establish genetic relatedness between and within species and for studying variability and correlated traits in cowpea (Ghalmi et al. Citation2010; Xiong et al. Citation2018; Gore et al. Citation2019). For example, Molosiwa et al. (Citation2016) assessed phenotypic variation of cowpea germplasm collected from Botswana and reported phenotypic differences for agronomic traits such as peduncle length, seed width, seed thickness, pods per peduncle, and hundred seed weight. High genetic distance and diversity among cowpea genotypes were assessed by Adewale et al. (Citation2011) using agronomic traits. Abiola and Adesoye (Citation2013) assessed variability in cowpea using phenotypic descriptors and reported large variation among the studied cowpea genotypes for number of seeds per pod, pod length, plant height, peduncle length, seed weight and number of pods per plant. Understanding the level of genetic diversity is essential for effective conservation and utilisation of germplasm resources (Huaqiang et al. Citation2012). However, morphological traits are influenced by environmental factors, which may result in varying relationship patterns (Smith and Smith Citation1989; Selvi et al. Citation2003). Nevertheless, they are highly effective for selection (Magloire Citation2005). The estimates of heritability help in the selection of elite genotypes from diverse genetic population. Similarly, genetic advance measures the amount of progress that could be expected with selection of a character. High heritability, coupled with high genetic advance, indicates improvement could be made for a character by simple selection (Tefera et al. Citation2017).
Although, previous studies assessed phenotypic diversity among cowpea genetic resource from sub-Saharan Africa, very few studies have been conducted in South Africa (Gerrano et al. Citation2015; Gerrano, van Rensburg, Kutu Citation2019), which motivates the identification, selection and recommendation of few genotypes for direct cultivation and use in improvement programmes (Gerrano et al. Citation2015; Gerrano, van Rensburg, Kutu Citation2019). Furthermore, cowpea is currently regarded as underutilised and neglected legume crop in the country mostly cultivated by resource-poor farmers using unimproved landrace varieties. In the country, the grain yield is estimated between 0.25 and 1.0 ton/ha which is much lower than the grain yield potential of 3.0 ton/ha (Asiwe Citation2009). Hence, an effort to improve cowpea production through breeding of high-yielding genotypes is urgently required to ensure food and nutrition security, especially among poor-households who rely on the cultivation of cowpea and other crops for sustenance. As a result, the available cowpea genetic pool in the country requires further assessment to identify genotypes with desirable agronomic attributes for breeding. In view of the above discussion, the objective of the current study was to estimate variability, heritability and genetic advance for yield and yield-related traits among cowpea genotypes under different environmental conditions of South Africa.
Materials and methods
Plant material
Hundred cowpea genotypes maintained in the gene bank of the Agricultural Research Council-Grain Crops (ARC-GC) in Potchefstroom, North West Province of South Africa, were planted in Potchefstroom (26.7145° S, 27.0970° E) and Roodeplaat in Pretoria (25.6450° S, 28.3579° E), South Africa during 201/18 growing season. The Potchefstroom site is composed of hutton soil, whereas the Roodeplaat site is composed of sandy loam soil. Potchefstroom is located at an altitude of 1344 m above sea level, and the average minimum and maximum temperature are 9.61°C and 25.48°C, respectively, with an average annual total rainfall of 618.88 mm. Roodeplaat is located in Pretoria at an altitude of 1159 m above sea level with an annual rainfall of 573 mm and a mean temperature of 17.3°C. Information of accession names and sources of origin is presented in .
Table 1. List of cowpea accessions used in the study.
Experimental layout and crop management
Genotypes were evaluated under field conditions using an alpha lattice design with two replications. The intra- and inter-row spacing of 100 and 30 cm was maintained, respectively. Each plot consisted of two rows of 4 m length. Pre-emergent herbicide was applied immediately after planting at a rate of 800 ml per 300 L of water. NPK fertiliser (2:3:2) was top dressed just before the flowering stage. Plants were irrigated using sprinklers three times in a week and weeds were removed manually as necessary.
Data collection and analyses
Data on days to fifty percent flowering (DFW), number of branches (BRN), pod number per plant (PNP), pod weight per plant (PWP), hundred seed weight (HSW), seed number per pod (SPD), seed number per plant (SNP), and grain yield (GRY) were recorded on plot basis. Quantitative data were collected using a standard descriptor list for cowpea (IBPGR Citation1993). Data were subjected to analysis of variance (ANOVA) using GenStat 18th Edition. The replications and blocks were treated as fixed factors whereas genotypes, environment and their interactions were treated as random factors. The linear model used for data analysis was:
where Yijkl is the observed value of genotype i in block l and replication k of environment j, μ is the grand mean, Gi is the effect of genotype i, Ej is the environment or location effect, Rk(j) is the effect of replication k in environment j, Bl(jk) is the effect of block l in environment j and replication k, GEij is the interaction effect of genotype i with environment j, and εijkl is the error (residual) effect of genotype i in block l and replication k of environment j.
Correlation and path coefficient analyses
Correlation analysis was performed to describe the pattern of association among the studied agronomic traits using RStudio version 3.2.3. Path coefficient analysis was conducted using a genotypic correlation matrix set up as A = B × C for grain yield. In this matrix, vector ‘A’ represents the genotypic correlation coefficients of grain yield vs. other agronomic traits. In the same vector ‘B’ is the value of genotypic correlation for all possible combinations among the traits and vector ‘C’, the path coefficients. The inverse of matrix B was calculated using the Matrix Inverse function (MINVERSE) of Microsoft Excel 2010. The path coefficients were calculated as the product of vector A and each row of B−1 using the matrix multiplication (MMULT) function of Microsoft Excel. Direct and indirect path coefficients were calculated according to Dewey and Lu (Citation1959). Grain yield was considered as the response variable, whereas other traits as causal variables.
Principal component analysis
Principal component analysis (PCA) based on the correlation matrix was performed in GenStat 18th Edition. The eigenvectors derived from the PCA were used to identify the variables that tend to have a strong relationship with a particular PC. Biplots of the principal component analysis were constructed to identify genotypes with suitable agronomic traits for effective selection and breeding.
Genetic parameters
The genetic parameters (phenotypic, genotypic and error variance) including phenotypic and genotypic coefficient of variation were computed using mean squares of alpha lattice ANOVA model as below. The variance components were estimated according to Burton (Citation1951).where MSg is the mean square due to genotypes, MSe is the error mean square and r is the number of replications.
where Mean is the grand mean of a trait.
According to Deshmukh et al. (Citation1986), PCV and GCV values greater than 20% are regarded as high, whereas values less than 10% are considered low and values between 10% and 20% considered medium.
Heritability (H2): heritability in broad sense for all traits was computed using the formula given by Falconer and Mackay (Citation1996).where H2 is the heritability in broad sense,
is the phenotypic variance and
is the genotypic variance.
Expected genetic advance (GA) in absolute unit (GA) percent of the mean (GAM) assuming selection was estimated at 5% selection (Johnson et al. Citation1955):where K is the standardised selection differential at 5% selection intensity (k = 2.06), δ2
p is the phenotypic standard deviation on mean basis and H2 is the heritability in broad sense.
Genetic advance as a percentage of the mean was calculated to compare the extent of the predicted advance of different traits under selection using the following formula:where GAM is the genetic advance as a percentage of the mean, GA is the genetic advance under selection and Mean is the mean of the population in which selection employed.
Results and discussion
Effect of genotype, environment and genotype-by-environment interaction on agronomic traits.
Analysis of variance revealed significant (p < 0.001) differences among genotypes for studied traits such as number of branches per plant, number of pods per plant, pod weight per plant, hundred seed weight, seed number per pod, and grain yield (), indicating genetic variability in the characters. Similarly, the environment showed significant (p < 0.05) differences for all the traits except for seed number per plant. Significant (p < 0.05) genotype-by-environment (G × E) interaction effect was observed for number of branches per plant, pod number per plant, days to flowering which implies diverse nature of the genotypes under diverse environments. Pod weight per plant, hundred seed weight, seed number per pod, seed number per plant and grain yield recorded non-significant.
Table 2. Analysis of variance showing mean square values and significance test of agronomic traits among cowpea genotypes in different sites during 2017/18 season.
Similarly, previous studies on cowpea genotypes indicated significant G × E on several agronomic traits such as number of branches, number of pods per plant, number of seeds per pod, pod diameter, plant height, pod length, hundred seed weight, grain yield, days to flowering maturity, plant height, grain yield, and number of seeds per pod in cowpea (Martos-Fuentes et al. Citation2017; Gerrano, van Rensburg, Kutu Citation2019). Ddamulira et al. (Citation2017) reported significant G × E on grain yield among cowpea genotypes. The non-significant G × E observed for yield and yield-related traits in the current study suggests that the studied genotypes were fairly stable across test environments. Stability analysis across divergent environments in South Africa is useful to identify germplasm sources with suitable traits for recommendation.
Pairwise correlation coefficient analysis of agronomic traits
Agronomic traits highly correlated with grain yield are useful for selection and can be targeted in improvement programmes to increase yield gains (Kamara et al. Citation2011). A correlation matrix showing Pearson’s correlation coefficients depicting the level of association among agronomic traits is presented in . Highly significant (p < 0.001) negative association was observed between days to flowering with number of branches (r = −0.26**). In contrary, Gerrano et al. (Citation2015) reported non-significant correlation between such traits in cowpea. Pod number per plant was significantly and positively correlated with pod weight (r = 0.55**), seed number per pod (r = 0.34**), seed number per plant (r = 0.84**) and grain yield (r = 0.71**). Gerrano et al. (Citation2015) reported negative correlation between number of pods per plant with number of seeds per pod with grain yield in cowpea, contradicting present findings. Lazaridi et al. (Citation2017) reported highly significant and positive correlations between number of pods per plant with number of seeds per plant and grain yield concurring with present findings. Hence, the current study suggested that selection of cowpea genotypes with high pod number will result in grain yield improvement.
Figure 1. Correlation coefficient matrix showing associations of agronomic traits among cowpea genotypes evaluated across two environments. DTF, days to flowering; BRN, number of branches; PNP, pod number per plant; PWP, pod weight per plant; HSW, hundred seed weight; SPD, seed number per pod; SNP, seed number per plant; GY, grain yield.
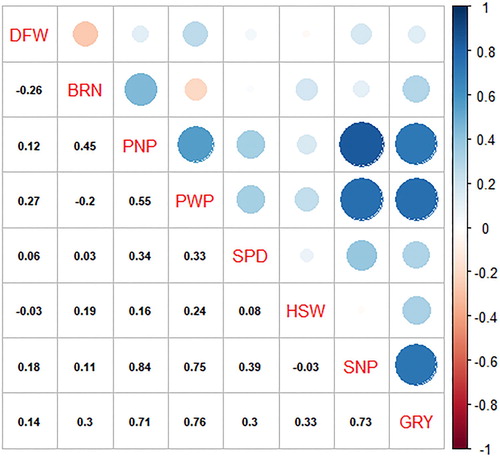
Cowpea genotypes such as 90K-284-2, 98K-503-1, RV 111, RV 115, RV 213, RV 470, RV 501, RV 550 and TVU 2095 recorded pod number per plant ≥ 60 and higher grain yield per plant (≥45 g). Pod weight was positively associated with seed number per pod (r = 0.33**), hundred seed weight (r = 0.24*), seed number per plant (r = 0.75**) and grain yield (r = 0.76**). Some cowpea genotypes including 86D-1010, 90K-284-2, 98K-503-1, CH-47, GLENDA, ITOOK-1263, RV 115, RV 121, RV 202, RV 207, RV 213, RV 419, RV 465, RV 470, RV 477, RV 499, RV 501 and RV 550 recorded high pod weight which resulted in high grain yield. Seed number per pod was highly correlated with seed number per plant (r = 0.39**) and grain yield (r = 0.30**); whereas seed number per plant and hundred seed weight were positively and significantly correlated with grain yield (r = 0.73** and r = 0.33**), respectively. Similar to the current study, Lazaridi et al. (Citation2017) and Gerrano, van Rensburg, Kutu (Citation2019) reported significant correlation between hundred seed weight and grain yield in cowpea. Contrastingly, Martos-Fuentes et al. (Citation2017) reported non-significant correlation between grain yield and kernel weight in cowpea. Genotypes 86D-1010, 90K-284-2, 98K-503-1, CH-47, GLENDA, ITOOK-1263, RV 121, RV 344, RV 419, RV 440, RV 477 and RV 550 recorded higher thousand grain weight (≥ 20 g) and high grain yield. Hundred seed weight of the genotypes in the current study was higher than the hundred seed weights reported by Belko et al. (Citation2014). The result indicates that the grain weight can be improved through strategic recombination of the identified genotypes.
Path coefficient analysis of agronomic traits
Path analysis is useful in improvement programmes to identify and select traits with direct influence on traits of economic importance such as grain yield. Direct and indirect path coefficient values of studied agronomic traits are presented in . A high direct path coefficients value of 0.71 with significant correlation with grain yield (rg = 0.76; p < 0.01) was observed between pod weight per plant and grain yield. These suggested direct selections of high pod weight can improve grain yield potential in cowpea. Cowpea genotypes such as RV 115, RV 121, RV 213, RV 28, RV 470, RV 477, RV 501, RV 550 and TVU 2095 recorded higher pod weights of 50, 89, 126, 55, 58, 106, 53 and 85 g respectively. Further, most of these genotypes recorded higher grain yield than most of the tested genotypes (Data not shown). Additionally, a moderate direct path coefficient value of 0.2 with highly significant (p < 0.01; rg = 0.73) correlation to grain yield was observed for number of seeds per pod indicating direct selection targeting this trait can improve grain yield potential in cowpea. Genotypes such as 83s-911, 86D-1010, 98D-1399, 99K-494-6, RV 111, RV 115, RV 409, RV 414, RV 470, RV 500, RV 550 and TVU 2095 recorded higher number of seed per pod (≥13), thus serving as useful germplasm for improvement of this trait.
Table 3. Direct (diagonal and bold font) and indirect (off-diagonal) path coefficient values of agronomic traits in cowpea.
Principal component analysis of studied agronomic traits
Principal component analysis (PCA) is useful to identify influential traits for effective selection and use in cultivar development. In the current study, PCA revealed three most important PCs (i.e. PC1, PC2 and PC3) among the studied agronomic traits, which contributed 44.0%, 19.0% and 12.70% variation, respectively, with a total variation of 75.2% (). Agronomic traits that contributed the most to variation in PC1 were days to flowering, pod number per plant, pod weight per plant, seed number per pod and grain yield, whereas, PC2 was positively correlated with number of branches and negatively correlated with hundred seed weight. Further, PC3 was positively correlated with seed number per pod Gerrano, van Rensburg, Kutu (Citation2019) also reported that influential traits in cowpea include number of pods per plant, number of seeds per pod, hundred seed weight and grain yield.
Table 4. Principal component analysis showing eigenvectors, percent and cumulative variation of agronomic traits among 100 cowpea genotypes.
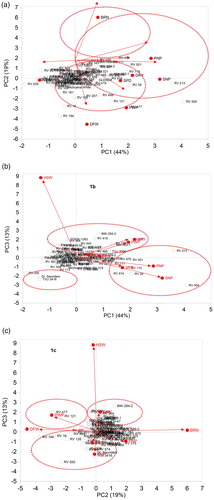
PCA bi-plots are very effective to identify genotypes possessing multiple traits to design an appropriate breeding strategy. PCA bi-plots (i.e. PC1 vs. PC2, PC1 vs. PC3 and PC2 vs. PC3) based on combined data across test environments showing groupings of cowpea genotypes and agronomic traits is shown in . Cowpea genotypes Bechuana white, RV 161, RV 16, RV 194, RV 126, RV 207, RV 499, RV 121 and RV 447, 98K-503-1 and TVU 2095 were grouped together based on longer days to flowering and high pod weight per plant ((a)). Similarly, Glenda, RV 465, RV 574, RV 115, RV 28, RV 419, RV 28, RV 419, RV 213, RV 550, RV 470, RV 111, RV 315 and RV 550 were grouped together based on high seed number per pod, seed number per plant, pod number per pod and grain yield ((a,b)) useful for breeding for enhanced agronomic performance. Strategic recombination of these genotypes may improve gains for these traits in the progeny (Olajide and Ilori Citation2016). Genotypes ITOOK-1263, RV 344, RV 440, 86-D-1010, CH-47, 90K-284-2, RV-419 and RV-121 were grouped based on high values for thousand seed weight ((b,c)) useful for breeding for increased grain weight. RV 205, Dr. Saunders and TVU 3416 were grouped based on low values for pod weight per plant, seed number per pod, hundred seed weight and grain yield ((b)). These findings suggest the use of such genotypes as parents may result in low genetic gains targeting improvement of these traits.
Figure 2. Bi-plots of principal components showing % variation accounted for PC1 vs. PC2, PC1 vs. PC3 and PC2 vs. PC3 and relationships among cowpea genotypes and agronomic traits based on combined data across test environments. DFW, days to flowering; BRN, number of branches; PNP, pod number per plant; PWP, pod weight per plant; SPD, seed number per pod; HSW, hundred seed weight; SNP, seed number per plant; GRY, grain yield.
Variance components, heritability, genotypic and phenotypic coefficients of variation and genetic gain among agronomic traits
Estimated variance components, phenotypic coefficient of variation (PCV) and genotypic coefficient of variation (GCV) and other parameters, studied agronomic traits based on combined data across the environments are presented in . Further, parameters such as genotypic (σ2 G), environmental (σ2 E) and phenotypic (σ2 P) variances, broad-sense heritability (H2) and genetic gain were estimated (). Phenotypic, genotypic, environmental and genotype by location variances were high for seed number per plant, pod weight, pod number per plant, days to flowering and grain yield. In the current study, all the studied traits recorded high GCV, whereas medium PCV values were observed for number of branches per plant (29.79%), seed per pod (22.74%) and days to flowering (26.13%), whereas the remainder of the traits recorded high values (≥44%). High values of PCV and GCV observed for studied traits in the present study suggest effective selection for these traits. Further, this also indicated the existence of substantial phenotypic variability among the tested cowpea genetic resource. Similar reports of high PCV and GCV for agronomic traits such as green pod yield per plant (Vidya et al. Citation2002; Narayanankutty et al. Citation2003); number of pods per plant (Vidya et al. Citation2002; Narayanankutty et al. Citation2003; Pal et al. Citation2003; Girish et al. Citation2006); ten pod weight (Xiong et al. Citation2002; Narayanankutty et al. Citation2003; Vavilapall et al. Citation2013); hundred fresh seed weight (Kumawat et al. Citation2005; Manggoel et al. Citation2012) and number of primary branches per plant (Nehru and Manjunath Citation2001) were reported to be highly variable in cowpea.
Table 5. Estimates of mean, variance, broad sense heritability, genotypic and phenotypic coefficients of variation and genetic advance of agronomic traits in cowpea.
Genetic advance (GA) values ranged from 71.86 to 2242.6% with seed number per pod recording the maximum GA value of 2242.56%, followed by pod weight (376.76), grain yield (324.21), pod number per plant (320.13), and days to flowering (260.57). High values of expected genetic advance in vegetable cowpea were also observed for green pod yield per plant (Kumawat et al. Citation2005; Vavilapall et al. Citation2013) and pod weight Narayanankutty et al. (Citation2003) in cowpea. However, low GA was recorded for number branches per plant (71.86) and seed number per pod (96.21), and are in agreement with Khanpara et al. (Citation2016).
Heritability is classified as low (<30%), medium (30–60%) and high (≥60%), according to Johnson et al. (Citation1955). In the current study, broad-sense heritability ranged from 38.36 (grain yield) to 97.2% (hundred seed weight). All agronomic traits under study recorded high heritability values suggesting additive gene effects control the expression of the traits. Similar results were reported by Omoigui et al. (Citation2006), Adeyanju and Ishiyaku (Citation2007), and Manggoel et al. (Citation2012) in cowpea. Additionally, Khanpara et al. (Citation2016) also reported high heritability values for traits such as days to 50% flowering, number of primary branches per plant, number of seeds per pod, pod weight, number of pods per plant and green pod yield per plant. Further, this suggested that the phenotypes were the true representative of their genotypes for these traits and that selection based on phenotypic value could be reliable.
Genetic advance expressed as percentage (GG) was high for pod weight (1296.2%) followed by hundred seed weight (1235.3%), seed number per plant (1126.1%), grain yield (965.56%) and pod number per plant (909.76%). Current findings concur with similar findings by Hermes et al. (Citation2018) who reported higher GG (36.06) for number of pods per plant, and 84.11 for 100 GG values for seed weight. Traits such as pod weight, number of pods per plant and for characters such as days to 50% flowering, and number of seeds per pod (Khanpara et al. Citation2016; Hermes et al. Citation2018). Srinivas et al. (Citation2017) also reported that number of branches per plant, plant height, pod yield per plot, total number of pods per plant and number of seeds per pod exhibit high GG values in cowpea. Furthermore, high heritability and genetic advance were recorded for pod weight (80.03%; 1296.42), days to flowering (91.93%; 538.29), pod number per plant (91.46%; 909.79), seed number per plant (93.75%; 1126.11), hundred seed weight (97.15%; 1235.31), and seed number per pod (96.21%; 468.4). High values for heritability coupled with high genetic advance for studied agronomic traits, which indicates additive gene action control the expression inheritance of these traits in cowpea (Johnson et al. Citation1955; Ubi et al. Citation2001). Planned crosses among complementary cowpea genotypes possessing these traits may result in improved genetic gains and enhanced performance of progenies.
In conclusion, this study indicated that significant variability exists among cowpea genotypes for agronomic traits. Thus, there exist opportunities for selection of superior cowpea genotypes for use in improvement programmes. Cowpea genotypes namely: Glenda, RV 465, RV 574, RV 115, RV 28, RV 419, RV 28, RV 419, RV 213, RV 550, RV 470, RV 111, RV 315 and RV 550 were selected for breeding with suitable yield and yield-related traits.
Acknowledgements
The first author would like to thank the Department of Science and Technology for funding. The first author gratefully appreciates the technical assistance of Dinah Scott and staff of the Agricultural Research Council-Grain Crops in Potchefstroom.
Disclosure statement
No potential conflict of interest was reported by the author(s).
Notes on contributors
Maletsema Alina Mofokeng is a Researcher in Plant Breeding at the Agricultural Research Council-Grain Crops, Potchefstroom, South Africa.
Jacob Mashilo is a Crop Scientist at the Limpopo Department of Agriculture and Rural Development, Limpopo Province, South Africa.
Paul Rantso is a Senior Technician in Plant Breeding at the Agricultural Research Council-Grain Crops, Potchefstroom, South Africa.
Hussein Shimelis is a Plant Breeder and the Deputy Director for African Centre for Crop Improvement (ACCI) at the University of KwaZulu-Natal, South Africa.
ORCID
Jacob Mashilo http://orcid.org/0000-0001-9015-043X
Additional information
Funding
References
- Abiola TA, Adesoye AI. 2013. Cluster analysis technique for assessing variability in cowpea (Vigna unguiculata L. Walp) accessions from Nigeria. Ratar Povrt. 50(2):1–7. doi: 10.5937/ratpov50-4069
- Adewale BD, Adeigbe OO, Aremu CO. 2011. Genetic distance and diversity among some cowpea (Vigna unguiculata (L.) Walp) genotypes. Int J Plant Sci. 1:9–14.
- Adeyanju AO, Ishiyaku MF. 2007. Genetic study of earliness in cowpea [Vigna unguiculata (L.) Walp] under screen house condition. Int J Plant Breed Genet. 1:34–37. doi: 10.3923/ijpbg.2007.34.37
- Asiwe JAN. 2009. Needs assessment of cowpea production practices, constraints and utilization in South Africa. Afr J Biotechnol. 8:5383–5388.
- Belko N, Cisse N, Diop NN, Zombre G, Thiaw S, Muranaka S, Ehlers JD. 2014. Selection for post-flowering drought resistance in short- and medium-duration cowpeas using stress tolerance indices. Crop Sci. 54:25–33. doi: 10.2135/cropsci2012.12.0685
- Burton GW. 1951. Quantitative inheritance in Pearl Millet (Pennisetum glancum). Agron J. 43:409–417. doi: 10.2134/agronj1951.00021962004300090001x
- Ddamulira G, Santos CAF, Alanyo M, Ramathani I, Maphosa M. 2017. Maturity, protein content and yield stability of cowpea in Uganda. SA J Plant Soil. 34:255–261. doi: 10.1080/02571862.2016.1274919
- Desalegne BA, Mohammed S, Dagne K, Timko MT. 2016. Assessment of genetic diversity in Ethiopian cowpea [Vigna unguiculata (L.) Walp.] germplasm using simple sequence repeat markers. Plant Mol Biol Rep. 34:978–992. doi: 10.1007/s11105-016-0979-x
- Deshmukh SN, Basu SN, Reddy PS. 1986. Genetic variability character association and path coefficients of quantitative traits in Virginia bunch varieties of groundnut. Ind J Agric Sci. 56:816–821.
- Dewey DR, Lu KH. 1959. A correlation and path coefficient analysis of components of crested wheat grass seed production. Agron J. 51:515–518. doi: 10.2134/agronj1959.00021962005100090002x
- Ehlers JD, Hall AE. 1997. Cowpea (Vigna unguiculata (L.) Walp.). Field Crops Res. 53:187–204. doi: 10.1016/S0378-4290(97)00031-2
- Falconer DS, Mackay TFC. 1996. Introduction to quantitative genetics, 4th ed. Essex: Prentice Hall.
- Fall L, Diouf D, Fall-Ndiaye MA, Badiane FA, Gueye M. 2003. Genetic diversity in cowpea [Vigna unguiculata (L.) Walp.] varieties determined by ARA and RAPD techniques. Afr J Biotechnol. 2:48–50. doi: 10.5897/AJB2003.000-1009
- FAOSTAT. 2018. Food systems for better nutrition. Accessed on 11 February 2020.
- Freire-Filho FR, Ribeiro VQ, Barreto PD, Santos AA, Melhoramento G. 2005. Feijão-caupi: avanços tecnológicos. Freire Filho FR, Lima JAA, Ribeiro VQ, editors. Brasília: EMBRAPA. p. 487–497.
- Gerrano AS, Adebola PO, van Rensburg WS J, Laurie SM. 2015. Genetic variability in cowpea (Vigna unguiculata (L.) Walp.) genotypes. S Afr J Plant Soil. 32:165–174. doi: 10.1080/02571862.2015.1014435
- Gerrano AS, van Rensburg WSJ, Kutu FR. 2019. Agronomic evaluation and identification of potential cowpea (Vigna unguiculata L. Walp) genotypes in South Africa. Acta Agric Scand Sect B Soil Plant Sci. 69:295–303.
- Gerrano AS, van Rensburg WSJ, Venter SL, Shargie NG, Amelework BA, Shimelis HA, Labuschagne MT. 2019. Selection of cowpea genotypes based on grain mineral and total protein content. Acta Agric Scand Sect B Soil Plant Sci. 69:155–166.
- Ghalmi N, Malice M, Jacquemin JM, Ounane SM, Mekliche L, Baudoin JP. 2010. Morphological and molecular diversity within Algerian cowpea (Vigna unguiculata (L.) Walp.) landraces. Genet Resour Crop Evol. 57:371. doi: 10.1007/s10722-009-9476-5
- Girish G, Viswanatha KP, Manjunath A, Yogeesh LN. 2006. Genetic variability, heritability and genetic advance analysis in cowpea [Vigna unguiculata L. (Walp.)]. Environ Ecol. 24:1172–1174.
- Gore PG, Tripathi K, Pratap A, Bhat KV, Umdale SD, Gupta V, Pandey A. 2019. Delineating taxonomic identity of two closely related Vigna species of section Aconitifoliae: V. trilobata (L.) Verdc. and V. stipulacea (Lam.) Kuntz in India. Genet Resour Crop Evol. 1–11. doi:10.1007/s10722-019-00767-9.
- Hermes AT, Carlos CA, Miguel EC, Darlin AP, Andrea GB. 2018. Estimation of genetic parameters in white seed cowpea (Vigna unguiculata (L) Walp). Austr J of Crop Sci. 12:1016–1022. doi: 10.21475/ajcs.18.12.06.PNE1105
- Huaqiang T, Manman T, Qian L, Yongpeng Z, Jia L, Huanxiu L. 2012. A review of molecular makers applied in cowpea (Vigna unguiculata L. Walp.). Breed J Life Sci. 6:1190–1199.
- IBPGR. 1993. International Board for Plant Genetic Resources Spore 38. CTA Wageningen, Netherlands.
- Johnson HW, Robinson HF, Comstock RE. 1955. Estimation of genetic and environmental variability in soybeans. Agron J. 47:314–318. doi: 10.2134/agronj1955.00021962004700070009x
- Kamara AY, Tefera H, Ewansiha SU, Ajeigbe HA, Okechukwu R, Boukar O, Omoigui LO. 2011. Genetic gain in yield and agronomic characteristics of cowpea cultivars developed in the Sudan Savannas of Nigeria over the past three decades. Crop Sci. 51:1877–1886. doi: 10.2135/cropsci2010.12.0698
- Khanpara SV, Jivani LL, Vachhani JH, Kachhadia VH. 2016. Genetic variability, heritability and genetic advance studies in vegetable cowpea [Vigna unguiculata (L.) Walp.]. Electr J Plant Breed. 7:408–411. doi: 10.5958/0975-928X.2016.00050.8
- Kumawat KC, Raje RS, Kumhar BL. 2005. Genetic variation in yield and yield components in cowpea [Vigna unguiculata L. (Walp.)]. Ann Agri-Bio Res. 10:21–23.
- Lazaridi E, Ntatsi G, Savvas D, Bebeli PJ. 2017. Diversity in cowpea (Vigna unguiculata (L.) Walp.) local population from Greece. Genetic Resour Crop Evol. 64:1529–1551. doi: 10.1007/s10722-016-0452-6
- Magloire N. 2005. The genetic, morphological and physiological evaluation of African cowpea genotypes. Bloemfontein: University of Free State.
- Manggoel W, Uguru MI, Ndam ON, Dasbak MA. 2012. Genetic variability, correlation and path coefficient analysis of some yield components of ten cowpea [Vigna unguiculata (L.) Walp] accessions. J Plant Breed Crop Scie. 4:80–86.
- Martos-Fuentes M, Fernández JA, Ochoa J, Carvalho M, Carnide V, Rosa E, Pereira G, Barcelos C, Bebeli PJ, Egea-Gilabert C. 2017. Genotype by environment interactions in cowpea (Vigna unguiculata L. Walp.) grown in the Iberian Peninsula. Crop Past Sci. 68:924–931. doi: 10.1071/CP17071
- Molosiwa OO, Chiyapo G, Joshuah M, Stephen MC. 2016. Phenotypic variation in cowpea (Vigna unguiculata [L.] Walp.) germplasm collection from Botswana. Int J Biod Conserv. 8(7):153–163. doi: 10.5897/IJBC2016.0949
- Narayanankutty C, Mili R, Jaikumaran U. 2003. Variability and genetic divergence in vegetable cowpea. J Maharashtra Agricultural University. 28:26–29.
- Nehru SD, Manjunath A. 2001. Genetic variability for yield and accessory characters in cowpea [Vigna unguiculata L. (Walp.)]. Ind J Agric Res. 45:99–101.
- Olajide AA, Ilori CO. 2016. Estimation of heterosis for some important quantitative traits in cowpea under drought stress. Crop Sci. 56:3024–3030. doi: 10.2135/cropsci2016.03.0155
- Omoigui LO, Ishiyaku MF, Kamara AY, Alabi SO, Mohammed SG. 2006. Genetic variability and heritability studies of some reproductive traits in cowpea [Vigna unguiculata (L.) Walp.]. Afr J Biotechnol. 5:1191–1195.
- Oyekan PO. 1977. Reaction of some cowpea varieties to Fusarium oxysporum f.sp. tracheiphilum in Nigeria. Trop Grain Legum Bull. 8:47–49.
- Pal AK, Maurya AN, Singh B, Ram D, Kumar S. 2003. Genetic variability, heritability and genetic advance analysis in cowpea [Vigna unguiculata L. (Walp.)]. Orissa J Hortic. 31:94–97.
- Selvi R, Muthiah AR, Maheswaran M, Shanmugasundaram P. 2003. Genetic diversity in the genus Vigna based on morphological traits and isozyme markers. Sabrao J Breed Genet. 35:103–112.
- Smith JSC, Smith OS. 1989. The description and assessment of distances between inbred lines of maize: II. The utility of morphological, biochemical, and genetic descriptors and a scheme for the testing of distinctiveness between inbred lines. Maydica. 34:151–161.
- Srinivas J, Kale VS, Nagre PK. 2017. Evaluation of different cowpea varieties and genotypes. Int J Pure Appl Biosci. 5(3):329–334. doi: 10.18782/2320-7051.4097
- Tefera A, Sentayehu A, Leta T. 2017. Genetic variability, heritability and genetic advance for yield and its related traits in rainfed lowland rice (Oryza sativa L.) genotypes at Fogera and Pawe, Ethiopia. Adv Crop Sci Technol. 5:2.
- Ubi EB, Mignouna H, Obigbesan G. 2001. Segregation for seed weight, pod length and days to flowering following cowpea cross. Afr Crop Sci J. 9:463–470. doi: 10.4314/acsj.v9i3.27592
- Vavilapall S, Celine VA, Dugg S, Padakipatil S, Magadum S. 2013. Genetic variability and heritability studies in bush cowpea [Vigna unguiculata (L.) Walp. Legume Genom Genet. 4:4–8.
- Vidya C, Oommen SK, Vijayaraghava K. 2002. Genetic variability and heritability of yield and related characters in yard-long bean. J Tropical Agric. 40:11–13.
- Xiong H, Qun J, Shi A, Mou B, Wu D, Sun J, Shu X, Wang Z, Lu W, Ma J, Weng Y, et al. 2018. Genetic differentiation and diversity upon genotype and phenotype in cowpea (Vigna unguiculata L. Walp.). Euphytica. 214:4. doi: 10.1007/s10681-017-2088-9