
ABSTRACT
Nordic conditions necessitate varieties adapted to marginal environments (short vegetation period, winter damages etc.) to reduce environmental influence on yield and quality. This study evaluated yield and quality variability of five spring and six winter wheat varieties grown in six locations throughout Estonia during 2011–2014. The variation of quality parameters was larger in spring wheat, according to the coefficient of variation. Average protein content for spring wheat was 13.6%, for winter wheat 13.3%. Average gluten content was 29.1% for spring wheat, 29.4% for winter wheat. Spring wheat varieties ‘Manu’ and ‘Quarna’ and winter wheat varieties ‘Ada’, ‘Fredis’, and ‘Ramiro’ had the highest baking quality. Protein and gluten content variation for both types of wheat depended mostly on the year. Baking strength W was higher for spring wheat. Variation of W of spring wheat depended more on genotype while variation of winter wheat more on year. The ratio of tenacity and extensibility (P/L) was similar for both wheat types; variation depended most on genotype. Average yield of winter wheat was 6.8 and spring wheat 5.3 t ha−1. ‘Nemunas’, ‘Kallas’, and ‘Skagen’ were high yielding among winter wheat varieties and had the best stability according to cultivar superiority index
Introduction
In 2018, wheat was the second most produced cereal after maize, with worldwide production greater than 734 Mt (Food and Agriculture Organization of the United Nations Citation2019). Wheat production in the European Union was 138 Mt in 2018, approximately 23.7 Mt of it were produced in Northern Europe. The UK and Denmark are the largest wheat producers in Northern Europe. In 2018, the Baltic countries produced 4.7 Mt. Estonia has been exporting wheat since 2005. Over the period 2005–2015 the cereal grain export increased eight times. The value of Estonian cereal export was 205.4 million EUR in 2019 with wheat accounting for 105.2 million EUR (581 354 t) (Estonian Chamber of Agriculture and Commerce). The share of wheat in cereal exports from Estonia is significant. Estonian wheat is exported to EU and other countries including Algeria, Morocco, Saudi Arabia, and Egypt (Knight Citation2017).
For nearly half a century, the international wheat breeding system has delivered improved high yielding varieties of wheat that created the Green Revolution and underpinned strong growth in wheat productivity (Dixon et al. Citation2009). Commonly, high yield negatively correlates with protein content. Cultivation of varieties with higher yield potential and using precision agrotechnology has increased the average yield in Estonia. By the results of Farmers Yield Competition, the highest recorded yield of winter wheat was 11.9 t ha–1 in 2019 and that of spring wheat 8.4 t ha−1 in 2015 (Viljelusvõistlus Citation2020).
Under Nordic conditions, the choice of an appropriate variety is essential. Abiotic stresses such as winter and frost damage, and drought affect grain yield in the Nordic-Baltic region, and thus, varieties adapted to the local abiotic stresses are required (Ingver et al. Citation2010; Peltonen-Sainio et al. Citation2016; Chawade et al. Citation2018). Winter hardiness is important for winter wheat (WW), and a relatively short vegetation period for spring wheat (SW). These requirements limit variety choice and preclude selecting a highly productive genotype from among those developed in Central or Western Europe.
Wheat quality is important for the internal milling industry and for export. Estonian wheat traders and mills set relatively similar quality requirements. Protein content of the highest quality grain is required to be 14%, gluten content 28%, falling number 275 s, and bulk density 770 g l–1. The respective parameters of the lower quality grain are 10–11%, 20–22%, 180 s, 720–730 g l−1 (Scandagra Citation2020; Tartu Mill Citationn.d.). Quality parameters for exported wheat are set by the importing country and could be different.
Protein content is the most commonly used wheat quality parameter. Research studies have shown that protein content of SW usually exceeds that of WW (Endo et al. Citation1990; Chung et al. Citation2003; Maghirang et al. Citation2006). Protein content positively correlates with gluten proteins (Wieser and Kieffer Citation1999; Mikulikova et al. Citation2009) and thus, both parameters are valuable for estimating baking quality of wheat lot.
Dough baking strength (alveograph parameter W) and the ratio of tenacity (P) and extensibility (L), P/L, are also common quality parameters for some regions of wheat export. The alveograph was introduced in France by Chopin in the 1920s, and since that time, has been used extensively in Europe, South America, and the Middle East for testing flour quality. Branlard et al. (Citation1991) reported an important positive correlation between bread volume and alveograph energy in French wheat.
Williams et al. (Citation2008) reviewed factors (genotype, environment, and genotype by environment interaction) affecting wheat baking quality. Research was conducted in different parts of world.
Since the choice of genotypes and environments used in experiments influences the outcomes observed, a great diversity was observed in the effect of genotype, environment, and G x E on quality in the publications reviewed. Each study is unique, which makes comparison among studies difficult. (Williams et al. Citation2008)
Insufficient data are available to evaluate quality parameters of different wheat varieties grown across multiple environments in Estonia. There is little information on quality variation attributable to differential responses of genotypes to environmental conditions. Both, grain yield and baking quality may vary considerably depending on the year and growing environment, but the traders demand primary grain with relatively constant quality. To maintain high yield and technological quality, the ideal genotype has to express consistent genetic potential regardless of varying environmental factors or growing conditions. The quality of a genotype usually reacts similarly to quantitative characteristics to varying environmental conditions (Grausgruber et al. Citation2000). The ideal variety has an optimal mean value with very low variance in parameters, when measured across environments (Peterson et al. Citation1992).
Different concepts of stability exist. According to the static concept of stability (also called as the ‘biological‘ concept), stable genotypes perform consistently across environments (Becker Citation1981; Becker and Léon Citation1988; Knapp et al. Citation2017). A genotype is considered to be stable if its among-environment variance is small (Lin et al. Citation1986). One parameter used to describe this type of stability is the coefficient of variability (CV). This measure depends on the diversity of environments in the experiments. A low level of variation according to CV may mean low levels of different characteristics, for example, consistently low yield levels every year. Francis and Kannenberg (Citation1978) suggested using CV as a stability statistic in combination with mean yield and environmental variance.
Breeders prefer the dynamic concept of stability (also called the ‘agronomic’ concept) with high yield performance of varieties (Becker and Léon Citation1988). There are many measures of dynamic stability, but one of the most common is Wrickle’s ecovalence (Wi) (Wrickle Citation1962). According to Becker and Leon (Citation1988) ecovalence measures the contribution of a G to the GxE interaction. Genotypes with low values of Wi (high ecovalence) have smaller deviations from the mean across environments and thus are considered more stable. Wi is not generally associated with yield level (Flores et al. Citation1998).
Lin and Binns (Citation1988a) proposed superiority index (Pi) as a measure of genotypic performance which integrates yield and stability. Pi of genotype i, is defined as the mean square distance between genotype i and the genotype with the maximum response (Lin and Binns Citation1988a, Citation1988b). Thus, Pi describes the relative stability of a genotype; a low Pi value indicates high relative stability (Flores et al. Citation1998). The smaller the estimated value of Pi is, the shorter the distance to the genotype with the maximum value, and thus, the better is performing. These three stability parameters do not correlate with each other (Knapp et al. Citation2017; Temesgen et al. Citation2015).
The purposes of the present research were:
To study the yield and baking quality parameters of common winter and spring wheat varieties in Nordic-Baltic conditions.
To explore whether and to what extent varieties adapted to Nordic-Baltic conditions meet the quality requirements set by the local wheat processing industry and the export market.
To determine the stability of yield and quality parameters of wheat varieties suitable for growing in Nordic-Baltic conditions and the factors affecting their variability.
Materials and methods
Yield and baking quality characteristics of six WW (‘Ada’, ‘Fredis’, ‘Ramiro’, ‘Skagen’, ‘Kallas’, ‘Nemunas’) and five SW (‘Manu’, ‘Mooni’, ‘Quarna’, ‘Specific’, ‘Uffo’) varieties were studied over four years (2011–2014). In 2020, all the varieties used in this study, except for ‘Nemunas’, were certified seed and farmed commercially. In 2011–2013, the experiments were conducted in six different locations around Estonia; in 2014, WW was grown in one location and SW in three locations. Wheat varieties and growing conditions were representative of Estonian agricultural practices with N fertiliser level 92–216 kg N ha−1 (). Fertilisers and plant protection products were used in accordance with commercial practices and rates common to the area. All experimental farms were situated in the area of fertile arable soils which are the best regions for wheat cultivation in Estonia. The varieties were grown on plots of 10 m2 in four replications. The experimental plots were located inside the wheat production fields. The plots were randomised in complete block design.
Table 1. Geographic coordinates and N fertiliser level (N kg ha–1) in trial locations.
The weather conditions in the trial years were very variable. In 2011, damage from snow mould (Microdocium nivale) was observed in early spring and high temperatures during the vegetation period caused some stress. Grain yield was below average and protein content was high. In 2012, June was rainy and cool, whereas average temperatures in other months were slightly above average. The moderate temperature regime resulted in high yields, but the lack of sunshine during the vegetation period led to lower baking quality. In 2013, low winter temperatures and the absence of snow damaged WW. However, the growing period was warm, especially the beginning of summer. Increased precipitation during April and May was followed by drought during the subsequent months. In 2014, the lack of snow and low winter temperatures influenced WW overwintering. The temperature during the growing period was above average but with extreme anomalies. The temperatures in the second part of May and July were extremely high, whereas in the second part of June, extremely low.
Grain yield (GY) was expressed at the 14% moisture level. Protein content (PC) and gluten content (GC) were determined using XDS Rapid Content Analyzer XM 1100 (FOSS NIRSystems Inc.). NIR analyzer was calibrated against the approved reference method by using WinISI 4 Calibration software. An alveograph (Chopin Technologies, Villeneuve la Garenne, France) was used to measure wheat visco–elastic properties (AACCI Approved Method 54–30.02).
All statistical analyses were performed using statistical package Agrobase 20TM (Agronomix Software Inc., Winnipeg, MN, Canada). One-way analysis of variance (ANOVA) was used to test differences of yield and quality characteristics of varieties. The 3-way ANOVA was used to test the effects of genotype (G), location (L) and year (Y), and all two-way interactions (G by L, G by Y, and L by Y). The relative contribution of each factor to the total variance was calculated based on the sum of squares for individual factors and was expressed as determination coefficient R². Coefficient of variation (CV), Wrickle's ecovalence (Wi), and cultivar superiority index (Pi) were used to measure stability. Total of 19 WW environments (year by site) and 21 SW environments were submitted to stability analyses. Average (Avg), minimum (Min), maximum (Max), and median values (Mdn) were used as descriptive statistics and were calculated as the average of the 19 test sites for WW and 21 for SW.
Results
Yield
The average yield across all environments of WW was 6.8 t ha–1 and 5.3 t ha–1 for SW (). Over the four experimental years, the maximum yield for the WW trial plots was 11.4 t ha–1, SW maximum yield was 9.7 t ha–1. According to the CV, yield variation of WW was slightly larger than SW.
Table 2. Descriptive statistics of main parameters as average of all spring wheat or winter wheat genotypes, locations, and years.
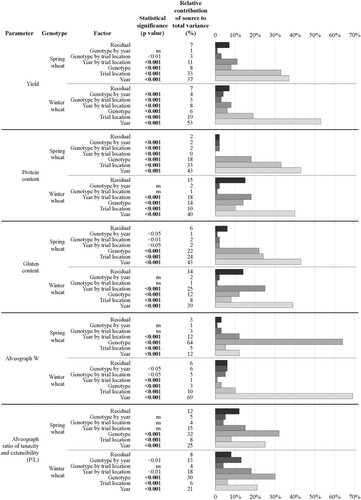
According to the determination index R², WW yield variation was most affected by Y, whereas both Y and L influenced SW yield variation (). G effect on the yield variation of both WW and SW was relatively small, 6% and 8%, respectively. The Y by L interaction impact on yield variation was larger for SW. Yield negatively correlated with most quality parameters (PC, GC, and W) (). Correlations of WW were stronger.
Figure 1. Sources of variation of yield and quality parameters of spring and winter wheat genotypes as measured by determination index R². Statistical significance (p-value) of different factors according to 3-way ANOVA. p-values less than 0.001 are presented in bold.
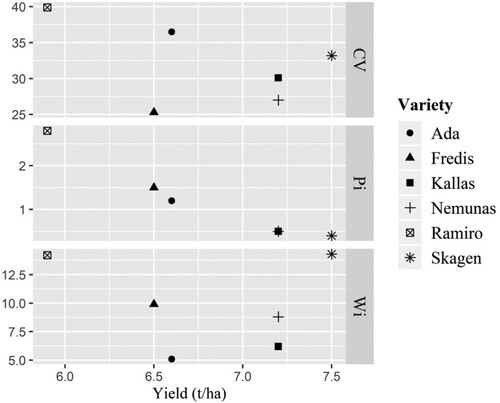
The highest yielding SW variety was ‘Uffo’ but variability was also highest according to CV and Wi (). WW varieties ‘Skagen’, ‘Kallas', and ‘Nemunas’ had highest yields among WW varieties (). The yield of ‘Skagen’ was more variable according to the Wi parameter. ‘Ramiro’ had the lowest yield and it was variable according to all stability parameters. Yields of WW varieties were less stable compared with SW varieties.
Figure 2. Stability parameters vs yield of spring wheat varieties. LSD0.05 for yield = 0.15 t ha–1.
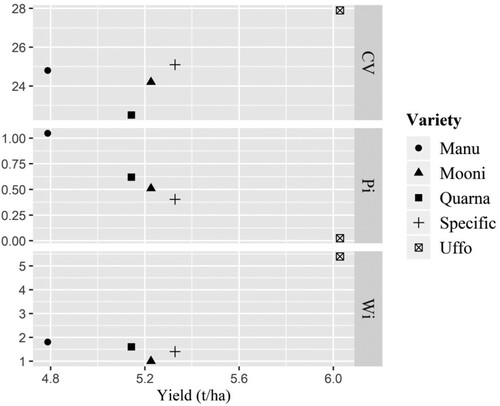
Figure 3. Stability parameters vs yield of winter wheat varieties. LSD0.05 for yield = 0.34 t ha–1.
Protein and gluten content
The average protein content of SW was only 0.3 percentage points higher than the protein content of WW. The minimum value for both wheat types was similar, although the maximum value differed over a wider range. Protein content variation for both wheat types depended on the Y by 40% (WW) and by 43% (SW). L effect for SW was 33%, whereas for WW the figure was significantly smaller. The G effect for protein content variation of SW and WW was quite similar. The Y by L interaction effect was more pronounced for WW compared to SW. The Pi value of WW variety ‘Fredis’ was the lowest while its protein content was the highest for different experimental years and locations. Among SW genotypes, ‘Quarna’ and ‘Manu’ had larger average PC. These varieties also had the lowest Pi values. According to the CV stability measure, the most stable SW variety was ‘Quarna’ but ‘Mooni’ had lowest Wi value. The high yielding SW variety ‘Uffo’ had the lowest PC in every year (data are not presented by the years in tables in this publication).
The average gluten content for WW and SW were similar. The median value of gluten content was higher for WW and CV was higher for SW. Minimum and maximum values of gluten content for SW were 13.9% and 48.2%, respectively, and for WW, 17.8 and 42.4%. The CV value of both protein content and gluten content were larger for SW than for WW. PC was positively related to GC. The variability of PC and GC values was quite similar according to the CV parameter but their differences in ecovalence values were larger, especially for WW. The Y effect on GC variation was similar to the Y influence on PC for both wheat types. The influence of L and G was much larger for SW than for WW, but the Y by L interaction effect was much higher for WW compared to SW.
Alveograph parameters
For SW, the average alveograph W value for all varieties, years and locations was 254 × 10–4 J, and for WW 213 × 10–4 J (further in the text, alveograph W will be reported without the units ×10−4 J). The W values for SW varied more. The W value variation for WW largely depended on the Y. All other factors had relatively minor effects. The W variation for SW largely depended on G, while the impact of Y and L were minor. SW variety ‘Quarna’ had the highest average W value. Its Pi value was 0, but variance according to the Wi was the highest.
The average P/L ratio was similar for WW and SW and the main effect on its variation had genotype. Both protein and gluten content correlated with the W value. For WW, the correlation was stronger. Protein content and gluten content values of WW correlated negatively with the P/L ratio. For SW, the correlations were not significant. W and P/L correlated negatively for WW and positively for SW.
Discussion
High yields are one of the essential parameters in wheat farming. Farmers aim to increase yields by selecting the most suitable genotype or adjusting various agricultural techniques. In 2011–2014, the average SW yield constituted 78% of the WW yield (). The median value of WW yield was about 2 t ha–1 higher (). Therefore, the yield potential of autumn-sown cereal crops is considerably higher than that of spring-sown crops even in Nordic conditions. A crop stand already established in spring is able to respond immediately to rising temperatures and the increase of solar radiation, since a spring crop cannot be sown until there are suitable soil conditions, a certain part of the growing season is lost (Hay and Porter Citation2006). The vegetation period for WW starts in the second part of April while the sowing time of spring cereals is usually not until the end of April or beginning of May in Estonia.
During 2011–2014, the average yield of wheat in production fields varied by 15% in Estonia (calculation based on the data presented at www.stat.ee). In Finland, yield variation during the same period was 3% (calculation based on FAOSTAT yield data). The majority of wheat grown in Estonia was WW (Statistics Estonia Citation2019), and in Finland SW (Finnish Cereal Committee Citation2015). As shown in , WW yield variation in Estonia was primarily caused by Y, while SW yield variation depended on both Y and L. The impact of genotype on yield variation, for both WW and SW, was minor. Similar results have been reported by Tarakanovas and Ruzgas (Citation2006) and Studnicki et al. (Citation2016). Still, the winter-hardy WW varieties decrease the risk of crop failure. Winter hardiness is one of the main limiting factors for winter wheat cultivation in Nordic and Baltic countries (Armoniene et al. Citation2013). Although the average WW yield was larger, its minimum value was similar to that of SW, as shown in . During the experimental years, there was one year (2011), when winter damage of WW was particularly significant, and the minimum yield levels of WW varieties were registered. Thus, yield variation was affected by the winter hardiness of various WW genotypes.
Among all WW varieties, ‘Skagen’, ‘Kallas’, and ‘Nemunas’ were the varieties with the longest growing periods and the highest yield, exceeding 7 t ha–1 (; data on growing periods were from Estonian Crop Research Institute wheat breeding collection trials (2011–2014) and are not included in this article). These varieties had the lowest Pi values but ‘Ada’ has lowest Wi value, as shown in . ‘Ramiro’ is valued by Estonian farmers because of short vegetation period. Among all WW varieties, the yield of ‘Ramiro’ was the lowest and varied most according to CV and its Pi and Wi values were also high (). PC and GC of ‘Ramiro’ were high, but variability was high also (). The average yield of the most productive SW variety, ‘Uffo,’ was 6 t ha–1 (), which was at the same level as the lowest WW yield from ‘Ramiro’ (). The yield of ‘Uffo’ was the largest of the SW during all experimental years and in all locations, which could be demonstrated by having a lower Pi value compared to other varieties but the variance according to Wi and CV was the largest, as shown in . ‘Uffo’ also had the longest vegetation period among all SW varieties used in the study. The variety with the lowest yield was SW ‘Manu’ (), which is an early ripening variety.
Producing high quality bread flour should be a motivation to cultivate SW as it typically has better baking characteristics than WW (Finnish Cereal Committee Citation2015). Chung et al. (Citation2003), found that SW showed significantly higher mean values of protein content and gluten content than WW. According to Maghirang et al. (Citation2006) ‘several researchers have shown that, compared with HRW wheat, HRS is the superior wheat class, generally due to higher protein content, while others have shown no distinct quality difference between the two wheat classes’. As shown in , this study found no significant difference between average PC of SW and WW. The protein content of both wheat types was similar, but the variation was larger for SW (), compared to WW (). Fredriksson et al. (Citation1997) concluded that protein content can be more affected by growing conditions in SW than in WW. Our study confirms that conclusion.
Table 3. Averaged quality data of spring wheat varieties over locations and years.
Table 4. Averaged quality parameters of winter wheat varieties over locations and years.
Protein content strongly correlated with gluten content for both wheat types (), which agrees with other studies (Hanell et al. Citation2004; Vazquez et al. Citation2012). Average gluten content levels were similar for WW and SW (). High yielding SW variety ‘Uffo’ was the only variety with unusually low protein and gluten content in this trial (). Thus, the data of this variety could have reduced the average protein content and gluten content of SW. Late ripening varieties with high yield potential had the lowest gluten content (‘Uffo’, ‘Kallas’, ‘Nemunas’), as shown in and . WW ‘Fredis’ and SW ‘Manu’ and ‘Quarna’ had the highest protein and gluten content values ( and ), accompanied with good stability indicators ( and ) – these varieties are better choices in order to grow high-quality wheat. Spring wheat maximum GC value (48.2%) was measured in 2011 (trial site Hulja, variety ‘Manu’). In the same year and location, the highest PC was also determined in the grains of ‘Manu’. High GC and PC were associated with its low yield level (2 t ha–1). The second highest GC (48.1%) was determined in the grain of the variety ‘Quarna’ (location: Jõgeva). In 2011, drier-than-average and above-average temperatures were measured and could be the reason of higher than average values of GC. This is consistent with findings that the primary effect on protein content and baking quality came from weather conditions rather than the cropping system (Johansson and Svensson Citation1997; Hanell et al. Citation2004; Karaman Citation2020). The highest GC of WW occurred in the same year. In a winter wheat experiment carried out in neighbouring Baltic country, Latvia, in 2011, quite high GC was also measured (Linina and Ruza Citation2015).
Table 5. Correlation coefficients between quality traits and grain yield of SW and WW.
Protein and gluten content variation depended on the genotype to a relatively small extent in both wheat types (this relation was smaller in WW in this study), as shown in . The results of other studies are similar and indicate that the impact of the environment outweighs the influence of genotype (Peterson et al. Citation1992; Rharrabti et al. Citation2003; Koppel and Ingver Citation2008; Mut et al. Citation2010; Surma et al. Citation2012). Protein concentration is determined by genetic background, but it is also significantly influenced by environmental factors such as nitrogen and water availability, as well as temperature levels (Stapper and Fisher Citation1990; McDonald Citation1992; Tea et al. Citation2004).
The relative contributions of G, E and G × E varied across studies, but traits associated with PC were more influenced by E and G × E than those associated with protein quality, dough rheology and starch characteristics, where G effect were more important. (Williams et al. Citation2008)
Protein content, gluten content, and yield were inversely related, as shown in . This trend is in accordance with other research studies (Peltonen Citation1992; Rharrabti et al. Citation2003; Surma et al. Citation2012). There are important differences in the protein content – yield relationship that depend on the production area (environment) as well as cereal species and genotypes within species (Fowler et al. Citation1990; Fowler Citation2003). The negative relation between grain yield and protein content also holds for correlation within elite and quality wheat variety groups in Germany, indicating that this relation cannot be broken easily (Laidig et al. Citation2017). Both wheat yield and quality potential are important as the price is dependent on the quality.
There are not officially recognised certified wheat quality classes in Estonia, but there are existing requirements and, therefore, de facto quality classes, set by private wheat traders and mills. Tartu Mill, the largest grain purchaser in Estonia, requires protein content of premium quality grain to be above 14%, and protein content of the lowest quality grain to be greater than 11% (Tartu Mill). By the results of this study SW ‘Manu’ and ‘Quarna’ could by qualified as class I (premium baking quality) wheat in two out of four experimental years, and class II the other two years. SW ‘Specific’ and ‘Mooni’ qualified as class III most years, and SW ‘Uffo’ only as class IV (feed wheat). All WW varieties met the quality requirement of class I in three years out of four. The gluten content of both wheat types met higher quality requirements than the protein content.
The alveograph test has been introduced to assess the quality of wheat grown in Estonia for export markets where these parameters are important. Different W values are set as import quality requirements by different countries. Additionally, most countries require a certain minimal protein content level. For instance, for wheat export to Algeria and Egypt need to have a minimum protein content of 11% and a minimum W value of 160. Spain and Italy set the minimum protein content at 14% and the minimum W value at 275. The higher is the W value, combined with high protein content, the higher the price paid when exported to Spain (J. Toomet, personal communication with author, 22 January 2018). All WW varieties met the requirements for Algeria and Egypt in three out of the four experimental years. However, ‘Ada’, ‘Fredis’, and ‘Ramiro’ only met the Spanish and Italian requirements in one out of four years. The average values of the other varieties were lower. In several varieties, the protein content reached the required level, but the W value was lower than necessary, or vice versa. Among SW genotypes, only ‘Quarna’ met the quality standards set by Italy and Spain in three years out of four. However, ‘Manu’ conformed to the lower standards of Algeria and Egpyt in three out of four years. ‘Quarna’ met the lower requirements all years, and ‘Specific’ in two of four years.
SW ‘Manu’ is known as variety with excellent baking quality in Estonia and Finland. However, ‘Manu’ did not have the highest or most stable W (). Preston et al. (Citation1987) claim there exist certain complications related to the application of W as a quality parameter.
A large part of the problem in assessing the quality of hard red spring and hard white spring wheat with the alveograph is related to starch damage and the water absorbing capacity of the flours produced from the wheat. The standard methods for the alveograph tests call for testing at a fixed water absorption of 50%. Dough prepared at 50% absorption from hard common wheat flour could be significantly under-hydrated and, therefore, stiff and inextensible. (Preston et al. Citation1987)
The P/L value for export should not exceed 1.0 (J. Toomet, personal communication with author, 22 January 2018). In this study, the average value of all varieties was lower than this limit. The P/L ratio of all varieties met export quality requirements in all years.
According to Branlard et al. (Citation2001), dough baking strength, W, is influenced by genotype. Surma et al. (Citation2012), pointed out that genotype and environment had similar importance for the variation of W. Kaya and Sahin (Citation2015) found that both W and P/L were sensitive to G × E and genetic variation was considerably lower for W and P/L compared to environmental variation. As shown in , for WW, genotype only accounted for 3% of W’s variation. The main effect (69%) came from the year. SW was different with the effect of year only accounting for 12% of the variation of the W value but genotype accounted for 64% (). This may be caused by the extraordinary high W value of ‘Quarna’ compared to the other varieties. The average W value of ‘Quarna’ was 409 compared to the second highest W value of ‘Specific’, 269 (). The alveograph W values of ‘Quarna’ and ‘Specific’ had lower CV% than the other two SW varieties; the ecovalence Wi value of ‘Quarna’ was high (). ‘Skagen’ had the best Wi value for alveograph W among WW (). ‘Ada’ had the best stability according to Pi (). According to Migliorini et al. (Citation2016), W was strongly affected by year and variety, but P/L did not have any significant difference among years and varieties. This differs with the current study as P/L was mainly affected by the genotype, but the influence of Y and Y by L interaction were also important, as shown in .
Both protein and gluten content had significant positive correlation with the W value, as shown in . Reese et al. (Citation2007) also found there was positive correlation between PC and alveograph W but not for all varieties in South Dakota. Toth (Citation2006) found that protein content and W correlation depended on the variety and fertilisation level. Alveograph W value of WW correlated negatively with yield; it was not significantly different for SW (). This is consistent with findings by Surma et al. (Citation2012) and Trethowan et al. (Citation2008) that the yield and alveograph W were inversely related. P/L was negatively correlated with PC, GC, and W for WW, correlations for SW were not significant ().
France is the biggest wheat producer and exporter in EU (Enghiad Citation2015), and United Kingdom is the largest wheat producer in North Europe (FAOSTAT). There are four classes of wheat according to quality traits in France (Schäfer and Ferret Citation2006) and premium quality wheat needs to have PC higher than 11.5% and W higher than 170 (FranceAgriMer & ARVALIS - Institut du végétal Citation2016). In the UK wheat varieties are listed in four classes while wheat for export is divided into ‘ukp’ (semi-hard varieties, suitable for both EU and non-EU bread-making) and ‘uks’ (soft milling wheat, suitable for biscuit making, with low protein) categories (Agriculture and Horticulture Development Board Citation2020). For semi-hard wheat the minimum protein content has to be 11–13%, W value of 170, gluten content of 23.7% and P/L maximum of 0.9 (Agriculture and Horticulture Development Board Citation2020). The median value for WW protein content was 13.2% in our study. Most of the SW and WW genotypes analysed in this study met the requirements of the premium class of French wheat quality classes or ‘bread-making wheat’ for the United Kingdom’s export class. ‘Quarna’ conformed best to the high criterion while ‘Mooni’ and ‘Uffo’ had the lowest quality. The results of this study showed that the quality of wheat grown in Estonia is comparable with the quality of bread wheat grown in France or the UK.
Although Estonia is not a large producer of wheat in Europe, the produced grain is of high quality in most of years and conforms to both local and export quality standards. The recommendation of wheat varieties for farmers in Estonia has to be based on the aims – whether the grain is grown for local food industry or for export. Varieties with high yield potential and high-quality requirements are found in both wheat types. Some varieties have more stable yields or quality levels and are less influenced by the environment. In Nordic-Baltic conditions it is important to use varieties which are well adapted to marginal environments in order to reduce the influence of environment on yield and grain quality parameters.
Disclosure statement
No potential conflict of interest was reported by the author(s).
Additional information
Funding
Notes on contributors
Reine Koppel
Reine Koppel, MSc, is a researcher in the Estonian Crop Research Institute with experience in plant breeding (bread wheat and spelt), wheat baking quality, wheat growing in organic conditions. She is a co-author of 11 wheat and 1 triticale varieties. She has participated in several national and international projects.
Anne Ingver
Anne, Ingver, PhD, is a researcher in the Estonian Crop Research Institute with long-term experience in spring wheat breeding for yield stability, high grain quality and resistance to biotic and abiotic stresses in changing climate. She is a co-author of 7 spring and 5 winter wheat varieties. The main area of interest is the development of new spring wheat cultivars with increased yield performance, quality and disease resistance for Estonia. She has participated in several national and or international projects.
Pille Ardel
Pille Ardel, deputy director in Estonian Crop Research Institute, her responsibility is seed certification, plant breeders’ rights and variety representation. She was coordinating the project ‘Widening the selection of cereals for food and non-food uses and development of suitable growing technologies for achievement of required qualities’
Tiia Kangor
Tiia Kangor, MSc, is a researcher in Estonian Crop Research Institute with experience in cereals agrotechologies, including plant nutrition. She has participated in several scientific projects. The main area of interest is the effect of biostimulants on grain yield, quality and soil properties.
Hannah Joy Kennedy
HannahJoy Kennedy, M.Sc. University of California Davis, is a research editor and researcher at the Estonian Crop Research Institute in image analysis for weed detection and plant phenotyping.
Mati Koppel
Mati Koppel, PhD, is a senior research fellow at Institute of Agricultural and Environmental Siences at the Estonian University of Life Sciences. His research interests include development of disease monitoring system; adaptation of decision support systems and disease forecasting models for local climatic conditions and agronomic practises; efficacy evaluation of fungicides and biological control agents. Currently leading the long term program in knowledge transfer in plant production including different aspects of integrated pest management and precision farming. He has been coordinator or partner of more than 20 national or international projects.
References
- Agriculture and Horticulture Development Board. 2020. Growing cereals for exports. Knowledge Library. [accessed 04.08.2020]. https://ahdb.org.uk/Contents/Item/Display/16527.
- Armoniene R, Liatukas Ž, Brazauskas G. 2013. Evaluation of freezing tolerance of winter wheat (Triticum aestivum L.) under controlled conditions and in the field. Zemdirbyste. 100(4):417–424. DOI:10.13080/z-a.2013.100.053.
- Becker HC. 1981. Correlations among some statistical measures of phenotypic stability. Euphytica. 30:835–840. DOI:10.1007/BF00038812.
- Becker HC, Léon J. 1988. Stability Analysis in Plant Breeding. Plant Breed. 101(1):1–23. doi:10.1111/j.1439-0523.1988.tb00261.x.
- Branlard G, Dardevet M, Saccomano R, Lagoutte F, Gourdon J. 2001. Genetic diversity of wheat storage proteins and bread wheat quality. Euphytica. 119:59–67. DOI:10.1023/A:1017586220359.
- Branlard G, Rousset M, Loisel W, Autran JC. 1991. Comparison of 46 technological parameters used in breeding for bread wheat quality evaluation. J Genet Breed. 45(4):263–279. http://pascal-francis.inist.fr/vibad/index.php?action=search&terms=6127533.
- Chawade A, Armoniené R, Berg G, Brazauskas G, Frostgård G, Geleta M, Gorash A, Henriksson T, Himanen K, Ingver A, … Weih M. 2018. A transnational and holistic breeding approach is needed for sustainable wheat production in the Baltic Sea region. Physiol Plant. 164(4):442–451. DOI:10.1111/ppl.12726.
- Chung OK, Ohm JB, Lookhart GL, Bruns RF. 2003. Quality characteristics of hard winter and spring wheats grown under an over-wintering Condition. J Cereal Sci. 37(1):91–99. DOI:10.1006/jcrs.2002.0484.
- Dixon J, Braun HJ, Braun HJ, Kosina P. 2009. Overview: Transitioning wheat research to meet the future demands of the developing world. In: J. Dixon, H.-J. Braun, P. Kosina, J. Crouch, editors. Wheat facts and futures 2009. International Maize and Wheat Improvement Center; p. 1025; https://repository.cimmyt.org/handle/10883/1265.
- Endo S, Okada K, Nagao S, D’Appolonia BL. 1990. Quality characteristics of hard red spring and winter wheats. I. Differentiation by reversed- phase high-performance liquid chromatography and milling properties. Cereal Chem. 67(5):480–485. https://www.cerealsgrains.org/publications/cc/backissues/1990/Documents/CC1990a113.html.
- Enghiad A. 2015. Examining the response of world wheat prices to climatic and market dynamics [Colorado State University]. http://hdl.handle.net/10217/170355.
- Estonian Chamber of Agriculture and Commerce. Eesti Põllumajandus Kaubanduskoda. Teravilja ja rapsi tootmine. 9. okt. 2019. [accessed 03.08.2020]. http://epkk.ee/teravili/.
- FAOSTAT. 2019. [accessed 04.11.2019]. http://www.fao.org/faostat/en/#data.
- Finnish Cereal Committee. 2015. Production of cereal and oilseed crops in Finland (2nd ed.). [accessed 15.10.2018]. http://www.vyr.fi/document/1/39/a754962/inengl_1ca381b_Production_of_cereal_crops_in_Finland_2014_10.pdf.
- Flores F, Moreno MT, Cubero JI. 1998. A comparison of univariate and multivariate methods to analyse GxE interaction. Field Crops Res. 56(3):271–286. DOI:10.1016/s0378-4290(97)00095-6.
- Food and Agriculture Organization of the United Nations. 2019. FAOSTAT. Food and Agriculture Organization of the United Nations. http://www.fao.org/faostat/en/#data.
- Fowler DB. 2003. Crop nitrogen demand and gr95ain protein concentration of spring and winter wheat. Agron J. 95(2):260–265. http://pascal-francis.inist.fr/vibad/index.php?action=search&terms=14629968.
- Fowler DB, Brydon J, Darroch BA, Entz MH, John AM. 1990. Environment and genotype influence on grain protein concentration of wheat and rye. Agronmy Res. 82(4):655–664. DOI:10.2134/agronj1990.00021962008200040002x.
- FranceAgriMer, & ARVALIS - Institut du végétal. 2016. Quality of French wheat at delivery to inland collection silos. In Harvest 2016 (Issue October). http://franceexportcereales.org/wp-content/uploads/2015/06/ENQ-CER-qualitéBTanglais-A16.pdf.
- Francis TR, Kannenberg LW. 1978. Yield stability studies in short-season maize. I. A descriptive method for grouping genotypes/yield stability studies in short-season maize. I. A descriptive method for grouping genotypes. Can J Plant Sci. 58(4):1029–1034. http://agris.fao.org/agris-search/search.do?recordID=US201302831092.
- Fredriksson H, Salomonsson L, Salomonsson A-C. 1997. Wheat cultivated with organic fertilizers and urea: baking performance and dough properties. Acta agriculturae scandinavica. Sect B. Soil Plant Sci. 47(1):35–42. http://agris.fao.org/agris-search/search.do?recordID=DK9721799.
- Grausgruber H, Oberforster M, Werteker M, Ruckenbauer P, Vollmann J. 2000. Stability of quality traits in Austrian-grown winter wheats. Field Crops Res. 66(3):257–267. http://agris.fao.org/agris-search/search.do?recordID=US201302956588.
- Hay R, Porter J. 2006. The physiology of crop yield (2nd ed.). Oxford: Blackwell Publishing Ltd.
- Hanell U, L-baeckström G, Svensson G. 2004. Quality studies on wheat grown in different cropping systems: a holistic perspective. Acta agriculturae scandinavica: section B. Soil Plant Sci. 54(4):254–263. DOI:10.1080/09064710410030302.
- Ingver A, Tamm I, Tamm Ü, Kangor T, Koppel R. 2010. The characteristics of spring cereals in changing weather in Estonia. Agron Res. 8:553–562. https://agronomy.emu.ee/category/volume-08-2010/special-issue-iii/.
- Johansson E, Svensson G. 1997. Yield and protein concentration. influences of weather on yield in some Swedish wheat cultivars grown during the period 1975 to 1996. Swed J Agric Res. 27(3):129–133.
- Kaya Y, Sahin M. 2015. Non-parametric stability analyses of dough properties in wheat. Food Sci Technol. 35(3):509–515. DOI:10.1590/1678-457X.6642.
- Karaman M. 2020. Evaluation of yield and quality performance of some spring bread wheat (Triticum aestivum L.) genotypes under rainfall conditions. Int J Agric Environ Food Sci. 4(1):19–26. DOI:10.31015/jaefs.2020.1.4.
- Knapp S, Brabant C, Oberforster M, Grausgruber H, Hiltbrunner J. 2017. Quality traits in winter wheat: comparison of stability parameters and correlations between traits regarding their stability. J Cereal Sci. 77:186–193. DOI:10.1016/j.jcs.2017.08.011.
- Knight S. 2017. EU-28 Grain and Feed Annual Report 2017. In GAIN Report (Global Agricultural Information Network). https://gain.fas.usda.gov/Recent GAIN Publications/Grain and Feed Annual_London_EU-28_3-30-2017.pdf.
- Koppel R, Ingver A. 2008. Comparision of yield and quality traits of winter and spring wheat. Latv J Agron. 11:83–89. http://agris.fao.org/agris-search/search.do?recordID=LV2009000049.
- Laidig F, Piepho HP, Rentel D, Drobek T, Meyer U, Huesken A. 2017. Breeding progress, variation, and correlation of grain and quality traits in winter rye hybrid and population varieties and national on-farm progress in Germany over 26 years. Theor Appl Genet. 130(5):981–998. DOI:10.1007/s00122-017-2865-9.
- Lin CS, Binns MR. 1988a. A method of analysing cultivar x location x year experiments: a new stability parameter. Theor Appl Genet. 76(3):425–430. DOI:10.1007/BF00265344.
- Lin CS, Binns MR. 1988b. A superiority measure of cultivar performance for cultivar × location data. Can J Plant Sci. 68(1):193–198. DOI:10.4141/cjps88-018.
- Lin CS, Binns MR, Lefkovitch LP. 1986. Stability analysis: where do we stand? Crop Sci. 26(5):894–900. http://pascal-francis.inist.fr/vibad/index.php?action=search&terms=7894407.
- Linina A, Ruza A. 2015. Weather conditions effect on fresh and stored winter wheat grain gluten quantity and quality. Crop Sci Prod. 25:148–153.
- Maghirang EB, Lookhart GL, Bean SR, Pierce RO, Xie F, Caley MS, Wilson JD, Seabourn BW, Ram MS, Park SH, et al. 2006. Comparison of quality characteristics and breadmaking functionality of hard red winter and hard red spring wheat. Cereal Chem. 83(5):520–528. DOI:10.1094/CC-83-0520.
- McDonald G. 1992. Effects of nitrogenous fertilizer on the growth, grain yield and grain protein concentration of wheat. Aust J Agric Res. 43(5):949–967. http://pascal-francis.inist.fr/vibad/index.php?action=getRecordDetail&idt=6125988.
- Migliorini P, Spagnolo S, Torri L, Arnoulet M, Ceccarelli S. 2016. Agronomic and quality characteristics of old, modern and mixture wheat varieties and landraces for organic bread chain in diverse environments of northern Italy. Eur J Agron. 79(13):131–141. DOI:10.1016/j.eja.2016.05.011.
- Mikulikova D, Masar S, Horvathova V, Kraic J. 2009. Stability of quality traits in winter wheat cultivars. Czech J Food Sci. 27:403–417. DOI:10.17221/96/2009-CJFS.
- Mut Z, Aydin N, Bayramoglu HO, Ozcan H. 2010. Stability of some quality traits in bread wheat (Triticum aestivum) genotypes. J Environ Biol. 31(4):489–495. http://www.jeb.co.in/journal_issues/201007_jul10/paper_18.pdf.
- Peltonen-Sainio P, Venäläinen A, Mäkelä HM, Pirinen P, Laapas M, Jauhiainen L, Kaseva J, Ojanen H, Korhonen P, Huusela-Veistola E, et al. 2016. Harmfulness of weather events and the adaptive capacity of farmers at high latitudes of Europe. Clim Res. 67(3):221–240. DOI:10.3354/cr01378.
- Peltonen J. 1992. Tissue nitrogen as a Base for Recommendations of Additional nitrogen to spring wheat in Southern Finland. Acta agriculturae scandinavica. B – Soil Plant Sci. 42:164–169.
- Peterson C, Graybosch R, Baenziger P, Grombacher A. 1992. Genotype and environment effects on quality characteristics of hard red winter wheat. Crop Sci. 32:98–103.
- Preston KR, Kilborn RH, Dexter JE. 1987. Effects of starch damage and water absorption on the alveograph properties of Canadian hard red spring wheats. Can Inst Food Sci Technol J. 20(2):75–80. DOI:10.1016/S0315-5463(87)71093-1.
- Reese CL, Clay DE, Beck D, Englund R. 2007. Is protein enough for assessing wheat flour quality? Salt Lake City, Utah: Western Nutrient Management Conference.
- Rharrabti Y, Villegas D, Royo C, Martos-Núñez V, García del Moral L. 2003. Durum wheat quality in Mediterranean environments II. Influence of climatic variables and relationships between quality parameters. Field Crops Res. 80:133–140. DOI:10.1016/S0378-4290(02)00177-6.
- Scandagra. 2020. Kvaliteeditingimused [Quality conditions]. [accessed 09.11.2019]. www.scandagra.ee/viljainfo/vastuvott/vilja-kvaliteeditingimused.
- Schäfer W, Ferret M. 2006. French wheat classes – A compendium of flour improvement. In: L. Popper, W. Schäfer, W. Freund, editors. Future of flour. p. 95–100 1st ed. Agrimedia GmbH. http://mehlverbesserung.de/english/know-how/future-of-flour.html.
- Stapper M, Fisher R. 1990. Genotype, sowing date and plant spacing influence on high-yielding irrigated wheat in southern New South Wales. Aust J Agric Res. 41(6):1021–1041.
- Statistics Estonia. 2019. [accessed 04.09.2020]. http://pub.stat.ee/px-web.2001/I_Databas/Economy/01Agriculture/02Agricultural_production/02Crop_production/02Crop_production.asp.
- Studnicki M, Wijata M, Sobczyński G, Samborski S, Gozdowski D, Rozbicki J. 2016. Effect of genotype, environment and crop management on yield and quality traits in spring wheat. J Cereal Sci. 72:30–37. DOI:10.1016/j.jcs.2016.09.012.
- Surma M, Adamski T, Banaczak Z, Kaczmarek Z, Kuczynska A, Majcher M, Lugowska B, Obouchowski W, Salmonovicz B, Krystkowiak K. 2012. Effect of genotype, environment and their interaction on quality parameters of wheat breeding lines of diverse grain hardness. Plant Prod Sci. 15(3):192–203.
- Tarakanovas P, Ruzgas V. 2006. Additive main effect and multiplicate interaction analyses of grain yield of wheat varieties in Lithuania. Agron Res. 4(1):91–98.
- Tartu Mill. n.d. Vilja kokkuost [Purchase of grain]. [accessed 09.02.2018]. www.tartumill.ee/et/tarnijale/.
- Tea I, Genter T, Naulet N, Boyer V, Lummerzheim M, Kleiber D. 2004. Effect of foliar sulfur and nitrogen fertilization on wheat storage protein composition and dough mixing properties. Cereal Chem. 81:759–766.
- Temesgen T, Keneni G, Sefera T, Jarso M. 2015. Yield stability and relationships among stability parameters in faba bean (Vicia faba L.) genotypes. Crop J. 3(3):258–268. DOI:10.1016/j.cj.2015.03.004.
- Toth A. 2006. Estimation of alveographic quality of winter wheat varieties and the factors affecting quality [University of Debrecen]. https://dea.lib.unideb.hu/dea/handle/2437/79564.
- Trethowan R, Peña R, Ginkel M. 2008. The effect of indirect tests for grain quality on the grain yield and industrial quality of bread wheat. Plant Breed. Plant Breed. 120:509–512. DOI:10.1046/j.1439-0523.2001.00651.x.
- Vazquez D, Berger A, Cuniberti M, Bainotti C, Miranda M, Scheeren P, Jobet C, Zúñiga J, Cabrera G, Verges R, et al. 2012. Influence of cultivar and environment on quality of Latin American wheats. J Cereal Sci. 56:169–203.
- Viljelusvõistlus. 2020. Rekordid [Records]. [accessed 15.03.2020]. http://www.viljelusvoistlus.ee/rekordid.
- Wieser H, Kieffer R. 1999. Correlations of the amount gluten protein types to the technological properties of wheat flours determined on a micro-scale. J Cereal Sci. 34:19–27.
- Williams R, O’Brien L, Eagles H, Solah V, Jayasena V. 2008. The influences of genotype, environment, and genotype x environment interaction on wheat quality. Aust J Agric Res. 59(2):95–111. DOI:10.1071/AR07185.
- Wrickle G. (1962). Evaluation method for recording ecological differejnces in field trials. Pflanzenzücht, 47, 92–96.