
 ?Mathematical formulae have been encoded as MathML and are displayed in this HTML version using MathJax in order to improve their display. Uncheck the box to turn MathJax off. This feature requires Javascript. Click on a formula to zoom.
ABSTRACT
Low phosphorus (P) in agricultural ecosystems limits growth of bambara. Field trials were carried out at 2 P levels (0 and 35 kg/ha) to determine the variation of 12 bambara genotypes in phosphorus efficiency, identify P-efficient and responsive genotypes for cultivation in sub-optimal P environments. Genotypes differed significantly (P ≤ .05) in plant biomass, grain and biological yields due to P levels and seasonal effects. BAM002, BAM010 and BAM011 recorded high grain yields in both seasons. Phosphorus accumulation (PA) in biomass, grain and biological yields was influenced by genotype, P levels and genotype * P levels interaction. High yielding P-efficient and responsive genotypes including BAM002, BAM010 and BAM011 also had high values of phosphorus physiological efficiency index and phosphorus harvest index at low P indicating that they are P-efficient. Genotypes were classified into four and three groups based on the relationship between total PA and grain yield at low and adequate P, respectively. Moreover, genotypes were categorised into in-efficient, medium and efficient based on total index score. Principal component analysis grouped together the genotypes BAM002, BAM010 and BAM011 at both P levels. These genotypes are adapted to P-deficient soils and utilise acquired P efficiently for optimum grain production.
Introduction
Bambara groundnut (Vigna subterranea L. Verdc) is an orphaned African grain legume that thrives well in regions receiving less than 800 ml annual rainfall (Feldman et al. Citation2019; Mateva et al. Citation2020). It is ranked the third most important pulse crop in Africa after groundnut (Arachis hypogaea L.) and cowpeas (Vigna unguiculata) (Shiyam et al. Citation2016). The crop fixes up to 28.42 kg/ha N due to its symbiotic association with a variety of rhizobia (Mayes et al. Citation2019). Nutritionally, bambara grain contains 55.5–70.0% carbohydrate, 4–12% lipids, 3–5% ash, 362–414 kcal/100 g metabolisable energy, 17–24% protein and 3–12% fibre providing a complete meal (Halimi et al. Citation2019). Owing to its drought resilience and nutritional attributes, bambara groundnut has the potential to contribute to climate change adaptation and nutritional security in sub-Saharan Africa. Despite the usefulness of bambara, the crop yields are low ranging between 300 and 850 kg/ha due to phosphorus deficiency especially in acidic soils (Mayes et al. Citation2019; Temegne et al. Citation2019). This is because it is highly sensitive to P deficiency as P is essential for both nodulation and biological N2-fixation (Nziguheba et al. Citation2016).
The critical threshold of soil acidity occurs at the pH range of 4.5–5.0 in Sub-Saharan Africa (Nziguheba et al. Citation2016). These soils have high amount of aluminium and iron on which P is adsorbed tightly, making it unavailable for uptake by plants. Liming is known to raise the soil pH by correcting calcium deficiency and thereby improving overall crop performance. However, the resource constrained smallholder farmers in the Sub-Saharan Africa do not apply lime. In the absence of liming, farmers have to apply high rates of phosphate fertiliser to obtain reasonable yields. Unfortunately, P-fertiliser application is low because it is an even more expensive input than lime, creating a clear need to develop farming systems that produce more under limited P availability.
A feasible alternative is to adopt crop cultivars that withstand low available P in acidic soil and respond to applied P to help achieve initial gains in crop productivity. Therefore, breeding of bambara groundnut for high P uptake and use efficiency is a prerequisite to enhance production in P-deficient soils. To facilitate breeding of P-efficient and responsive bambara, there is need to evaluate genotypes at both low and adequate P. Genotypic variation for phosphorus acquisition and use efficiencies exists in grain legumes including cowpea (Ojo et al. Citation2007), common bean (Namayanja et al. Citation2014), soybean (Zhou et al. Citation2016) and mungbean (Irfan et al. Citation2017). Bambara groundnut cultivars exhibit wide genetic diversity and respond variably to P application (Shiyam et al. Citation2016; Mayes et al. Citation2019). Based on variation in P efficiency crop cultivars are categorised into four groups as: (a) efficient responsive, (b) inefficient responsive, (c) efficient non-responsive and (d) inefficient nonresponsive (Nziguheba et al. Citation2016; Irfan et al. Citation2017). Although previous studies have documented genetic diversity among bambara groundnut (Odongo et al. Citation2015), no studies on P acquisition and use efficiencies have been carried out in this crop. Cultivation of P-efficient bambara genotypes would result in reduced P fertiliser needs and improved P fertiliser use efficiency when such genotypes are supplied with moderate rate of P fertiliser. The present study evaluated the genetic variation for P-efficiency in bambara groundnut genotypes to identify P-efficient and responsive genotypes for cultivation in sub-optimal P environment.
Materials and methods
Plant materials
Twelve genotypes of bambara groundnut were sourced from a collection maintained at the Department of Biological Sciences, University of Eldoret, Kenya. These are identified as BAM001, BAM002, BAM003, BAM004, BAM005, BAM006, BAM007, BAM008, BAM009, BAM010, BAM011 and BAM012. They are traditional cultivars collected from farmers in western Kenya. Information on seed colour and collection sites is presented in .
Table 1. Bambara groundnut genotypes used in the study.
Experimental location
Two field trials were conducted at Ligala [0.2516°N, 34.2547°E] in Siaya County in western Kenya during the long and short rain seasons of the year 2018. The site is located at an altitude of 1293 m above sea level in the Lower Midland Sugar Cane Zone (LM1) with a mean annual temperature of 20.9–21.8°C (Jaetzold et al. Citation2010). This agro-ecological zone is characterised by a long cropping season between February and July, followed by a medium one with moderate rains from August to December. The rainfall received ranges from 750 to 950 mm in the long rain season in 10 out of 15 years. The total rainfall during the short rain season is 600–800 mm, with a reliability of 66%. The growing period during the long and short rain seasons lasts for >190 and 130–150 days, respectively. Acrisols are the predominant soil type in the area.
Soil sampling and analyses
Prior to setting up the trials, soil from the experimental site was analysed for selected physico-chemical characteristics. The soil was sampled following a zigzag pattern at a depth of 20 cm from the surface using an auger and mixed to form a composite sample. Soil pH was determined in 1:2 (w/v) soil: distilled water suspensions as described by Anderson and Ingram (Citation1993). Total percent organic carbon was determined following Walkley–Black procedure (Nelson and Sommers Citation1982). Kjeldahl nitrogen was measured according to Jackson (Citation1962). Soil extractable phosphorus and potassium were calculated using AB-DTPA as an extraction solution (Soltanpour and Workman Citation1979). 500 mg of sieved soil was placed in 40 ml of 0.5 N HCl and left to stand at room temperature for 5 min followed by measurement of calcium and magnesium in the filtrate (Sahrawat Citation1987). Mechanical analysis for soil separates was performed according to a hydrometer method by dispersing soil in sodium hexametaphosphate (Bouyoucos Citation1962). The soil at the experimental site was a sandy clay loam characterised by low pH, low extractable P and with a history of poor crop production. Other physio-chemical attributes of soil characteristics are presented in .
Table 2. Initial physio-chemical properties of soil at Ligala in Siaya County, Kenya.
Experimental design and crop establishment
Field trials were setup in a split-plot design using two P levels (no P addition) and adequate (35 kg/ha) with three replications. P levels represented the main plots while genotypes were the sub plots (McDonald et al. Citation2015). An individual genotype was planted in two rows measuring 3 m long, with a spacing of 33 cm between rows and 15 cm between plants within a row. P fertiliser was applied as triple superphosphate at sowing time. Urea and muriate of potash applied at the rate of 30 kg/ha provided nitrogen and potassium, respectively. N was applied as a starter dose to stimulate growth and nodulation. A week after emergence, the crop was thinned to two plants per hill and thereafter weeded thrice to keep the field free of weeds. In each season, five plants per genotype were harvested at maturity for yield determination. Grain and plant biomass consisting of roots, stems and leaves were air-dried and weighed for individual plants. Biological yield was estimated as the summation of grain and plant biomass yields (Irfan et al. Citation2017).
Phosphorus accumulation and P-related efficiency parameters
Phosphorus accumulation in the grains and plant biomass was assayed from plants grown in the field during the long rain season only. One gram (1 g) of grain or plant biomass from five individual plants per genotype were oven-dried at 70°C to constant weight. Dried grain and biomass were milled to fine powder. Milled samples were placed in conical flasks pretreated with hot 1:1 hydrochloric acid: distilled water to remove traces of P that might be adsorbed on the glassware. Pulverised samples were digested with 5:1 mixture of nitric acid and perchloric acid (HNO3:HClO4) to recover P from the material (Jones and Case Citation1990). One gram of milled sample was placed in a 250 ml conical flask, 10 ml concentrated nitric (V) acid was added and boiled for 30 min. On cooling, 5 ml of 70% perchloric acid was added and boiled gently until white dense fumes appeared. The mixture was cooled, 20 ml of distilled water was added, boiled further to release all the fumes signalling end of digestion. The solution was cooled, filtered through Whatman filter paper No 42 and transferred to a volumetric flask containing 25 ml of distilled water. Quantification of total P was carried out by the vanadate–molybdate method (Chapman and Pratt Citation1961). Phosphorus related parameters were calculated to establish the relationship between P and plant growth such as phosphorus stress factor (PSF) (Hunt Citation1978), phosphorus harvest index (PHI) (Siddiqi and Glass Citation1981), phosphorus physiological efficiency index (PPEI) and phosphorus biological yield efficiency ratio (PBER) (Jones et al. Citation1992), Phosphorus accumulation (PA) and total phosphorus accumulation (TPA) (Zhang et al. Citation2007) according to the equation below:
Phosphorus accumulation (PA):
Total phosphorus accumulation (TPA):
Phosphorus physiological efficiency index (PPEI):
Phosphorus biological yield efficiency ratio (PBER):
where biological yield is the sum of grain and straw yields.
Phosphorus harvest index (PHI)
Phosphorus stress factor (PSF)
Classification of bambara groundnut genotypes
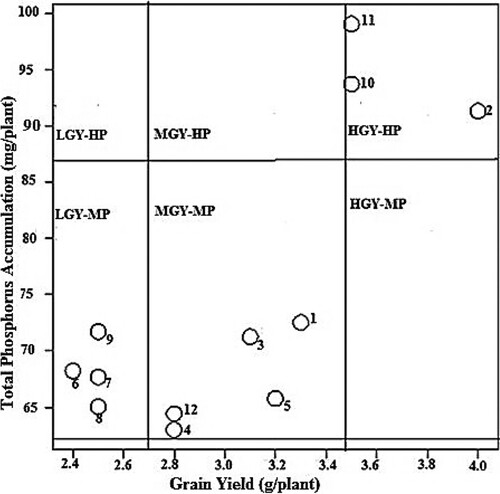
Based on the measured traits; plant biomass yield, grain yield, biological yield, plant biomass PA, grain PA, TPA, PHI, PPEI and PBER, the bambara genotypes were grouped as having low, medium and high P acquisition and use efficiencies using their index score at low and adequate P levels (Irfan et al. Citation2017). Classification was performed using absolute values with the population mean (µ) and standard deviation (SD) for each parameter per genotype (Gill et al. Citation2004). The values 1, 2 and 3 were used to classify the genotypes into groups: 1 (low) if mean < µ − SD, 2 (medium) if µ − SD < mean < µ + SD or 3 (high) if the mean is > µ + SD. Total index score (TIS) for each genotype was obtained by summation of the respective index scores of all parameters measured. The genotypes were further classified into various groups by plotting a graph in which grain yield (g/plant) was represented on the x-ordinate and total PA (mg/plant) on the y-ordinate. Each genotype in this graph was represented by a circle. LGY, MGY, and HGY represented low, medium, and high grain yield while LP, MP and HP indicated low, medium, and high PA of the tested genotypes (Irfan et al. Citation2017).
Statistical analysis
Data on plant biomass, grain and biological yields collected from five plants per genotype in the two experimental seasons were subjected to combined analysis of variance to test the significance of variation due to seasons, genotypes, P levels and their interactions. PA, PHI, PPEI and PBER derived from data collected during long rain season only were subjected to analysis of variance to examine significance due to genotype and P levels and their interaction. Analysis was performed using GenStat for Windows (GenStat Citation2003). Differences among treatment means were separated using Duncan's multiple range tests at P ≤ .05. Pearson correlation analysis was done to determine the relationship between grain yield and various phosphorus efficiency parameters at both levels of P. Principal Component Analysis (PCA) and biplots of the PCA were constructed to identify genotypes with suitable traits for effective selection and breeding to improve P-efficiency.
Results
Yield attributes of 12 bambara genotypes
Bambara groundnut genotypes varied significantly (P ≤ .05) in plant biomass, grain and biological yields due to P level and seasonal effect (). The interactions genotype * phosphorus and phosphorus * season were significant (P ≤ .05) for grain yield only. Genotype * season interaction showed significant (P ≤ .05) differences for plant biomass, grain and biological yields. Interaction of genotype * phosphorus * season for plant biomass, grain and biological yields was not significant. For the long rain season, the genotype BAM011 exhibited the maximum plant biomass of 18.39 g/plant at low P whereas BAM010 recorded the highest plant biomass of 20.37 g/plant at adequate P. On the other hand, BAM007 recorded the lowest plant biomass yield of 10.65 g/plant and 12.79 g/plant at low and adequate P, respectively. In the short rain season, BAM002 with 13.96 g/plant recorded the highest plant biomass while BAM007 had the lowest biomass of 10.23 g/plant at low P. BAM011 had the highest plant biomass of 15.36 g/plant whereas BAM007 recorded the least biomass of 11.93 g/plant at adequate P. Overall, the mean plant biomass yield increased by 14.79% and 12.67% due to P application during long and short rain seasons, respectively.
Table 3. Mean values of plant biomass, grain yield and biological yield for 12 Bambara genotypes grown in low and adequate P during long and short rain seasons in the year 2018 at Ligala.
Grain yield response of the Bambara groundnut genotypes varied from 2.1–3.19 g/plant at low P to 2.39–4.02 g/plant when supplied with adequate P during the long rain season (). There was a significant (P < .05) reduction in grain yield during short rain season, with values ranging from 1.36–2.03 g/plant at low P to 1.63–2.53 g/plant at adequate P. The maximum grain yield of 3.19 and 4.02 g/plant at low and adequate P supply was recorded for genotypes BAM011 and BAM002 in long rain season, respectively. BAM012 had the lowest grain yield of 2.1 g/plant at low P while BAM006 recorded the lowest grain yield of 2.39 g/plant with adequate P during long rain season. BAM010, BAM002 and BAM011 recorded highest grain yield of 1.86, 2.00 and 2.03 g/plant at low P during the short rain season, respectively. At adequate P, BAM002, BAM010 and BAM011 registered the highest grain yield of 2.33, 2.36 and 2.53 g/plant during the short rain season, respectively. BAM001 and BAM004 had the lowest grain yield of 1.43 and 1.63 g/plant at low and adequate P, respectively. Overall, seasonal effect led to grain yield reduction of 34.29% and 34.00% at low and adequate P, respectively. Biological yield ranged from 12.78–21.59 g/plant at low P to 15.28–23.91 g/plant under adequate P supply during the long rain season. BAM011 and BAM010 recorded the highest biological yield at low P and adequate P, respectively whereas BAM007 had the least biological yield at both P levels. Overall, the biological yield of the bambara genotypes increased from 16.70 g/plant at low P to 19.30 g/plant at adequate P, representing 15.57% increase due to P during the long rain season. Similarly, biological yield increased from 14.08 g/plant at low P to 16.04 g/plant at adequate P. In the short rain season, BAM002, BAM010 and BAM011 recorded the maximum biological yield at low and adequate P.
Plant biomass and grain phosphorus accumulation
Phosphorus accumulation (PA) in the plant biomass, grain and biological yields was significantly (P ≤ .05) influenced by genotype, P levels and genotype * P levels interaction (). PA in the plant biomass ranged from 27.17 to 46.5 mg/plant at low P to 49.49–78.93 mg/plant at adequate P. BAM002 and BAM011 had the highest PA at low and adequate P supply, respectively. In contrast, BAM008 and BAM012 had the lowest PA in the biomass at both low and adequate P. Plant biomass P accumulation increased with P application. Phosphorus concentration in plant biomass was as high as 3-fold of the grain P. BAM002 recorded the highest PA of 18.02 mg/plant while BAM006 had the least amount of 8.91 mg/plant at low P. At adequate P, BAM002 exhibited the maximum PA in the grain of 23.78 mg/plant whereas BAM004 recorded the least grain PA of 13.01 mg/plant. Across genotypes, PA in the grain increased from 10.9 mg/plant in low P to 16.8 mg/plant at adequate P, translating to 53.66% increase in grain P upon supplementation. Total P accumulation in biomass (TPA) varied between 37.03 and 64.52 mg/plant at low P to 62.98–99.11 mg/plant when adequate P was supplied. BAM002 exhibited the highest TPA of 64.52 mg/plant in low P while BAM011 registered the highest TPA of 99.11mg/plant in adequate P. BAM008 and BAM004 recorded the lowest TPA of 37.03 mg/plant and 62.98 mg/plant at low and adequate P, respectively. On average, the TPA increased from 46.6 mg/plant in low P to 74.49 mg/plant at adequate P. There was a strong positive correlation (P ≤ .05) between total phosphorus accumulation with grain yield, plant biomass and biological yield at both low and adequate P (). Genotypes BAM002, BAM010 and BAM011 that recorded high grain yield also accumulated high amount of P at both levels of P. A significant positive correlation was also observed between plant biomass and grain yield of r = 0.80* and r = 0.99* (P ≤ .05) at low and adequate P levels, respectively.
Table 4. Mean values of phosphorus accumulation in plant biomass, grain and index scores of 12 Bambara genotypes grown at low and adequate P at Ligala in Siaya, Kenya.
Table 5. Pearson correlation matrix showing relationship between total phosphorus accumulation and grain yield, plant biomass and biological yield for 12 Bambara genotypes at low and adequate P.
Phosphorus stress factor
Bambara genotypes differed significantly (P ≤ .05) at low P for relative suppression in grain yield (). Phosphorus stress factor (PSF) varied from 7.53% to 28.61% among the tested genotypes at low P. All Bambara genotypes were responsive to addition of P exhibiting PSF of greater than 7.53%. BAM010 and BAM012 were the most responsive genotypes recording PSF of 28.61% and 28.33%, respectively. The least reduction in grain yield was observed in BAM006 with PSF value of 7.53%.
Phosphorus efficiency parameters
Phosphorus harvest index (PHI) was significantly (P ≤ .05) influenced by genotype and genotype * P level while P level alone had no effect (). PHI ranged from 15.01% in BAM004 to 24.03% in BAM001 at low P. Under adequate P, PHI varied from 20.42% in BAM011 to 26.01% in BAM002. Genotypes BAM010 and BAM011 showed higher PHI at low P compared to adequate P level. Overall, genotypes with a high PHI, produced higher grain yield than those having low PHI.
Table 6. Mean values of phosphorus efficiency indices of 12 Bambara genotypes grown at low and adequate P supply.
Phosphorus physiological index in grain (PPEI) varied significantly among genotypes at each level of P. The interaction effect between genotype and P level was not significant (). All of the genotypes showed higher values of PPEI at low P than adequate P. Genotypes BAM001 and BAM012 exhibited the highest PPEI value of 52.22 g of grain mg−1 P and 61.1 g of grain mg−1 P under adequate and low P, respectively. BAM008 recorded the lowest PPEI of 39.06 g grain mg−1 P and 42.5 g grain mg−1 P in adequate and low P, respectively. The mean PPEI increased from 46.28 g of grain mg−1 P in plants grown at low P to 51.7 g of grain mg−1 P under adequate P application.
Phosphorus biological yield efficiency ratio (PBER) differed significantly (P ≤ .05) between the two levels of P (). Interaction between genotypes and phosphorus levels for PBER varied significantly (P ≤ .05). Bambara genotypes recorded high PBER values at low P, ranging from 299.11 to 376.15 g biomass mg−1 P. PBER values decreased to 236.45–293.89 g biomass mg−1 P upon application of P (). The maximum PBER value of 376.15 g and 293.89g biomass mg−1 P was observed in genotypes BAM008 and BAM005 at low and adequate P, respectively. BAM002 recorded the least PBER values of 299.1 and 236.5 g biomass mg−1 P under low and adequate P. BAM008 and BAM012 recorded the highest PBER values but registered low biological yield at low P.
Grouping of bambara groundnut genotypes
Bambara genotypes were classified into in-efficient, medium and efficient based on total index score (TIS) derived from plant biomass, grain yield, biological yield, PA in plant biomass, PA in the grain, TPA, PSF, PHI, PPEI and PBER (). BAM002 and BAM011 achieved the highest index score of 26 and 24, respectively at low P and were classified as P-efficient at low P. Three genotypes: BAM007, BAM008 and BAM009 with index scores of 18, 18 and 17 were grouped as P-inefficient at low P conditions. The rest of the genotypes were ranked as medium at low P. BAM002, BAM010 and BAM011 recorded the highest total index score of 23 and were grouped as P efficient at adequate P supply. BAM008 recorded the lowest total index score of 15 and was classified as P-inefficient at adequate P. The remaining 8 genotypes were grouped as medium in performance at adequate P.
Table 7. Classification of 12 Bambara genotypes within three performance levels based on total index scores of grown at low and adequate P.
The 12 bambara genotypes were distributed further into 4 groups based on the relationship between TPA and grain yield at low P (). BAM002 and BAM011 were grouped as high grain yield -high phosphorus uptake (HGY-HP) while BAM008 was placed in the medium grain yield-medium phosphorus uptake (MGY-LP) category at low P supply. Similarly, BAM012 was grouped as low grain yield-medium phosphorus uptake (LGY-MP). BAM008 in the group medium grain yield-low phosphorus uptake (MGY-LP) was P-inefficient with respect to the acquisition of native P. The rest of the genotypes (8) were grouped into medium grain yield-medium phosphorus uptake (MGY-MP) showing a medium potential in both P acquisition and utilisation in production of grains under low P conditions. BAM002, BAM010 and BAM011 were placed in HGY-HP at adequate P (). Four genotypes BAM006, BAM007, BAM008 and BAM009 were classified in LGY-MP. The remaining five genotypes were grouped in MGY-MP showing their medium potential in both P accumulation and grain yield at adequate P.
Figure 1. Distribution of 12 Bambara genotypes based on their grain yield and total P accumulation at low P. LGY = Low grain yield, MGY = Medium grain yield, HGY = High grain yield, LP = Low Phosphorus, MP = Medium Phosphorus, HP = High Phosphorus. Numbers in figure represent names of genotypes studied in the experiment as 1 = BAM001, 2 = BAM002, 3 = BAM003, BAM = 004, 5 = BAM005, 6 = BAM006, 7 = BAM007, 8 = BAM008, 9 = BAM010, 10 = BAM010, 11 = BAM011, 12 = BAM012.
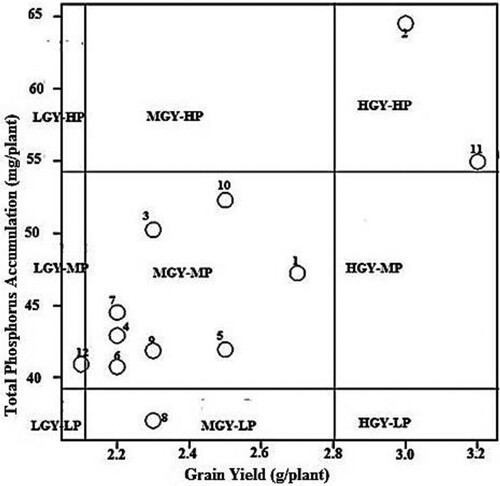
Figure 2. Distribution of 12 Bambara genotypes based on their grain yield and total P accumulation at adequate P. LGY = Low grain yield, MGY = Medium grain yield, HGY = High grain yield, LP = Low Phosphorus, MP = Medium Phosphorus, HP = High Phosphorus. Numbers in figure represent names of genotypes studied in the experiment as 1 = BAM001, 2 = BAM002, 3 = BAM003, BAM = 004, 5 = BAM005, 6 = BAM006, 7 = BAM007, 8 = BAM008, 9 = BAM010, 10 = BAM010, 11 = BAM011, 12 = BAM012.
Principal component analysis (PCA) at low P revealed two principal components among the studied parameters which contributed 67.71% and 17.37% variation, respectively, with a total variation of 85.05% (). Grain yield, PA in the grain and TPA contributed the most to variation in PC1 at low P, whereas, PC2 was positively correlated with PPEI and negatively correlated with PA for plant biomass at low P. PCA bi-plot at low P showing groupings of Bambara genotypes and parameters is shown in . Bambara genotypes BAM002, BAM010 and BAM011 were grouped together based on grain yield, PA in the grain, TPA, biological yield, plant biomass, and PA in plant biomass. BAM003, BAM004, BAM005, BAM006, BAM007, BAM008 and BAM009 were ranked together based on PBER. On other hand, BAM001 was grouped alone based on PHI and PPEI. PC1 and PC2 contributed 62.19% and 16.85% variation, respectively with a total variation of 79.04% at adequate P (). PA in plant biomass and TPA contributed the most to variation in PC1 at adequate P, whereas, PC2 was positively correlated with PBER and negatively correlated with PHI (). Grouping of bambara genotypes on the basis of different parameters at adequate P is shown in . BAM002, BAM010 and BAM011 were again clustered together at adequate P based on plant biomass, biological yield, PA in plant biomass, TPA, grain yield and PA in the grain. BAM004, BAM005, BAM006, BAM007, BAM008 and BAM009 were categorised together based on PBER at adequate P. BAM001 and BAM003 were grouped alone based on PPEI and PHI at adequate P, respectively.
Figure 3. Principal component analysis biplot of yield, phosphorus accumulation and phosphorus efficiency indices of 12 bambara genotypes grown at low P. PHI = Phosphorus Harvest Index, PPEI = Phosphorus Physiological Efficiency Index, PBER = Phosphorus Biological Efficiency Ratio. Numbers in figure represent genotypes as follows: 1 = BAM001, 2 = BAM002, 3 = BAM003, BAM = 004, 5 = BAM005, 6 = BAM006, 7 = BAM007, 8 = BAM008, 9 = BAM010, 10 = BAM010, 11 = BAM011, 12 = BAM012.
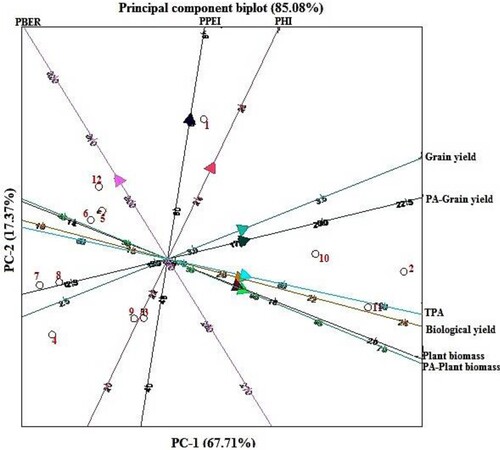
Figure 4. Bi-plot of principal components showing percent variation accounted for PC1 vs. PC2 and relationships among 12 bambara genotypes based on yield, phosphorus accumulation and phosphorus efficiency indices grown at adequate P. PHI = Phosphorus harvest index, PPEI = Phosphorus physiological efficiency index, PBER = Phosphorus biological efficiency ratio. Numbers in figure represent genotypes as follows: 1 = BAM001, 2 = BAM002, 3 = BAM003, BAM = 004, 5 = BAM005, 6 = BAM006, 7 = BAM007, 8 = BAM008, 9 = BAM010, 10 = BAM010, 11 = BAM011, 12 = BAM012.
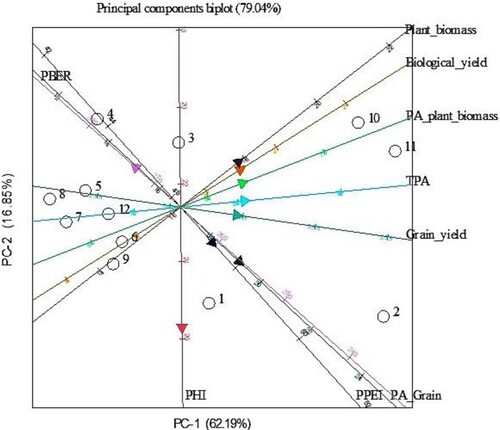
Table 8. Principal component analysis showing eigenvectors, percent and cumulative variation of yield, phosphorus accumulation and phosphorus efficiency indices of 12 bambara genotypes grown under low and adequate P.
Discussion
Low available P in the soil is a major nutritional constraint that limits plant growth leading to reduced crop yields. Plant biomass, grain and biological yields varied significantly in response to P and seasons while a significant interaction between genotype and phosphorus was observed for grain yield only as shown in . This demonstrates that bambara genotypes harbour useful genetic variation for response to soil P availability that could be exploited to enhance their ability to extract P from the soil with varying levels of P fertilisation. BAM002, BAM010 and BAM011 consistently recorded high grain yields at both levels of P during the long and short rain seasons and also had fairly high biomass, demonstrating their potential to partition more dry matter to grain production. Inherent genetic variation among mungbean and bambara genotypes has contributed to differences in grain yields and plant biomass under contrasting P supply (Irfan et al. Citation2017; Temegne et al. Citation2019). Some genotypes recorded high yields during both cropping seasons but registered significant reduction in biomass, grain and biological yields during the short rain season at both levels of P (). Likewise, there was significant interaction between genotype and season for plant biomass, grain and biological yields. The short rain season receives a lower amount of rainfall than the long rain season (Jaetzold et al. Citation2010), which partly explains the observed differences in crop performance in this study. Previous studies have reported that environmental variations observed in different sites and seasons contribute to differences in plant biomass and grain yield of crop genotypes (McDonald et al. Citation2015; Samago et al. Citation2018). Genotype * phosphorus * season interaction was non-significant since the interactions genotype * phosphorus and phosphorus * season did not vary across the genotypes for the agro-morphological attributes measured. BAM002, BAM010 and BAM011 produced consistently high biomass, grain and biological yields at low and adequate P supply across the seasons. These genotypes are desirable since they can successfully be grown in a wide range of P environments as well as different seasons with variable rainfall amount without compromising the yield.
Phosphorus accumulation (PA) in plant tissues indicates the capacity of the genotype to extract P from the soil. PA in the plant biomass, grain and biological yields was significantly (P ≤ .05) influenced by genotype and genotype × P level interaction () indicating that the bambara genotypes evaluated have differential ability to absorb P from the soil. Genotypic variation in P acquisition among genotypes of different crop species have been reported in mungbean (Irfan et al. Citation2017, Citation2020), wheat (Bilal et al. Citation2018) and cotton (Iqbal et al. Citation2019) among others. A significant and positive correlation between grain PA and grain yield was observed under low P (). This finding supports the assertion that crop genotypes which accumulate more P in the grains realise high grain yield (Yaseen and Malhi Citation2009; Bilal et al. Citation2018). As shown in , BAM002, BAM010 and BAM011 produced high grain yields and accumulated high amount of P in both biomass and grain at low and adequate P. These genotypes were considered to be efficient in acquisition of P from the soil as well as utilisation of absorbed P for production of biomass and grain at both levels of soil P. Genotypes with high acquisition of P are suitable genetic resources that should be promoted for cultivation owing to their inherent ability to produce high yield at relatively low soil P status that can be reached by applying lower rates of mineral P fertiliser than would be recommended.
Phosphorus stress factor (PSF) distinguishes between P-responsiveness and non-responsiveness of cultivars and the comparative ability of a cultivar to yield biomass and/or yield upon P addition (Irfan et al. Citation2020). PSF varied significantly among the bambara cultivars evaluated in this study (). All the genotypes responded to P application and showed reduction in grain yields due to low P (PSF > 0). A wide PSF range from 7.53% to 28.61% among genotypes demonstrates that the genotypes differ in their potential to tolerate conditions of PSF in the soil. A number of crops including wheat (Yaseen and Malhi Citation2009), mungbean (Irfan et al. Citation2017) and rice (Irfan et al. Citation2020) have shown genotype-dependent variation in PSF. BAM002, BAM003, BAM010 and BAM012 were the most P responsive genotypes demonstrating that increased productivity of these genotypes can be sustained under P fertilisation. Although BAM011 recorded high grain yield at both low and adequate P levels (), it had a lower PSF than BAM002 and BAM010 indicating that it is low-P tolerant and yields fairly well under varying P status in the soil. BAM002, BAM010 and BAM011 had a high P accumulation (PA) in both biomass and grain (), demonstrating their high P-utilisation efficiency. The differences in responsiveness of bambara genotypes to P application could be attributed to variation in the abilities of these genotypes to absorb, remobilize and efficiently utilise P over time (Fageria et al. Citation2011).
Phosphorus harvest index (PHI) that describes accumulation of higher amount of P in the grain than in biomass was influenced by the genotype and genotype * P level interaction. This demonstrated differential abilities of the genotypes to convert part of the plant P to grain P under different levels of soil P. The PHI of bambara genotypes did not significantly vary due to the effect of P levels (). This implies that reallocation of P from the biomass to grain was similar at both low and adequate P supply conditions. Genotypic variation for PHI at different rates of P fertiliser application has also been observed in a variety of crops including dry bean (Fageria et al. Citation2013), wheat (McDonald et al. Citation2015) and mungbean (Irfan et al. Citation2017). As shown in , BAM001, BAM002, BAM010 and BAM011 that had high grain yield also recorded high PHI values at low P, pointing to the ability of these genotypes to efficiently use internal P for grain production (Kruse et al. Citation2015). Since PHI varied in this study, there is need to investigate traits responsible for P translocation from various plant parts to the grain to provide insight into the underlying internal P-use efficiency mechanisms.
Phosphorus physiological efficiency index (PPEI) describes the efficiency of a genotype to utilise P and produce grain yield per unit of P absorbed in the above ground parts of the plant at maturity (Irfan et al. Citation2017). PPEI varied significantly from one genotype to another in both low and adequate P supply (), demonstrating differences in efficiency of these genotypes to utilise absorbed P. This shows that bambara genotypes differ significantly in terms of their P requirements for growth and grain yield. Therefore, the genotypes that accumulated more P under low P conditions can tolerate P-deficiency stress. Variation for PPEI under varying P supply has also been reported among the genotypes of many other crops including wheat and mungbean (Yaseen and Malhi Citation2009; Irfan et al. Citation2017). High yielding bambara genotypes BAM002, BAM010 and BAM011that exhibited high values of PPEI at low P, and low values under adequate P nutrition are P-efficient (). Apparently, these genotypes are well-adapted to low P environments since they can acquire and utilise P more efficiently for optimum grain production. Physiological biological efficiency ratio (PBER), which indicates the efficiency of a genotype to use P and measures the ability of a genotype to produce biomass per unit of absorbed P (Yaseen and Malhi Citation2009), also varied significantly at both levels of P and decreased with addition of P (). This shows that the bambara genotypes differed in their ability to produce biomass per unit of P absorbed from the soil. Both PPEI and PBER in the grain and biological yield decreased at high P supply. A similar trend was observed in mungbean genotypes, where higher PPEI and PBER values were recorded at low P than adequate P (Fageria et al. Citation2013; Irfan et al. Citation2017).
The bambara genotypes were grouped into four categories; HGY-HP, MGY-MP, LGY-MP and MGY-LP under low P supply (). The genotypes BAM002 and BAM011 in the HGY-HP category (, ) were efficient in P acquisition from soil as well as utilisation of the absorbed P to produce high grain yield under low P. However, BAM002 accumulated relatively more P (), and therefore seems to be less efficient in P utilisation than BAM011. BAM010 was grouped as MGY-MP, being medium in P acquisition and efficient in grain yield production. High grain yield with medium PA demonstrate an ability of the genotype to partition available resource to grain production under low P supply. BAM012 was grouped as LGY-MP, which shows that this genotype has low utilisation efficiency of the absorbed P (). At adequate P, the bambara genotypes were differentiated into the three categories: HGY-HP, MGY-MP and LGY-MP as presented in . BAM002, BAM010 and BAM011 were efficient in P acquisition and also classified as HGY-HP for their superior response to P application (; ). Hence, BAM010 shifted group from MGY-MP at low P to HGY-HP under adequate supply of P. Similarly, BAM008 that was initially categorised as MGY-LP at limited P changed to LGY-MP at adequate P supply together with BAM006, BAM007 and BAM009 (). This finding is consistent with results reported from previous studies on several crops (Irfan et al. Citation2017; Bilal et al. Citation2018). Evidently, some genotypes that perform well under P deficiency may have inferior response to added P. Therefore, it would be necessary to screen genotypes for P efficiency at both limiting and adequate P conditions to gauge their responsiveness to P fertilisation. Genotypes that consistently perform well at low and adequate P, as observed for BAM002, BAM010 and BAM011 in the present study are desirable. P utilisation efficient crop cultivars produce high yield per unit of absorbed P under P deficient conditions, since they have low internal P demand for normal metabolic activities and growth (Balemi and Negisho Citation2012). Consequently, such genotypes have low requirement for supplemental mineral P fertiliser to produce relatively high yield. Genotypes showing variation in P acquisition and utilisation efficiency and may be considered for cultivation on soils varying in P regime (Gill et al. Citation2004; Kruse et al. Citation2015).
Principal component analysis (PCA) showed that the first two principal components contributed a total variation of 85.05% and 79.04% at low and adequate P, respectively (). PCA grouped together the genotypes BAM002, BAM010 and BAM011 based on grain yield, PA in the grain, TPA, biological yield, plant biomass, and PA in plant biomass at low P supply as shown in . Similar clustering of these genotypes based on the same traits was achieved at adequate P (), indicating the usefulness of these traits in breeding for enhanced agronomic performance. The scores for these discriminative traits were characteristically high in the three genotypes BAM002, BAM010 and BAM011 that stand out as the most P efficient and responsive in the current study. Phosphorus acquisition, biomass and grain yields at low P supply have been identified as influential traits in the directional selection of P efficient crop genotypes (Bilal et al. Citation2018; Iqbal et al. Citation2019; Irfan et al. Citation2020). Strategic recombination of the P-efficient genotypes identified in the present study may improve gains for these traits in the progeny under low P supply. Besides contributing to breeding, the information on bambara genotype characterisation may be applied in low-input cropping systems to improve productivity of the crop.
In conclusion, this study demonstrates that bambara groundnut harbours genetic variation for P accumulation and P-utilisation efficiency. BAM002, BAM010 and BAM011 genotypes showed superior efficiency in P acquisition and utilisation while at the same time they responded well to P application across seasons. P efficient and responsive bambara genotypes would be multiplied and promoted for cultivation in low and adequate P fertilised soils. Since these genotypes varied in P utilisation efficiency, they have potential use as breeding material for future development of bambara varieties that are high yielding and adaptive to varying levels of P.
Acknowledgements
This work was supported by the McKnight Foundation under the Collaborative Crop Research Programme grant number 17-232. The study was implemented as part of the first author’s Master of Science thesis. We sincerely acknowledge the input and support provided by field staff during trial management. We are grateful to the University of Eldoret for laboratory space and technical assistance on soil and plant analysis.
Disclosure statement
No potential conflict of interest was reported by the author(s).
Additional information
Funding
Notes on contributors
Job Sikuku Wafula
Job Sikuku Wafula is postgraduate student registered for Master of Science in plant genetics at the University of Eldoret. He has interest in unravelling genetic variation for tolerance to phosphorus deficiency in bambara groundnuts in acid soils.
Benson Ouma Nyongesa
Benson Ouma Nyongesa is a lecturer of plant genetics at the University of Eldoret. His research interests include diversity studies and development of crops tolerant to low phosphorus and resistant to biotic and abiotic stresses using molecular tools.
Beatrice A. Were
Beatrice A. Were is an associate professor of genetics and plant breeding at the University of Eldoret. Her research work focuses on the improvement of crop resistance to biotic and abiotic stresses through resistance breeding and integration of environment friendly technologies in managing the ecological stresses.
Samuel Gudu
Samuel Gudu is professor of genetics and plant breeding at Rongo University. His research interests include genetics,plant breeding and agronomy. He is involved in breeding for P efficiency in a number of crops including sorghum, maize and sesame and management of acid soils.
References
- Anderson JM, Ingram JAI. 1993. Tropical soil biology and fertility. Wallingford: CAB.
- Balemi T, Negisho K. 2012. Management of soil phosphorus and plant adaptation mechanisms to phosphorus stress for sustainable crop production: a review. J Soil Sci Plant Nutr. 12(3):547–562.
- Bilal HM, Aziz T, Maqsood MA, Farooq M, Yan G. 2018. Categorization of wheat genotypes for phosphorus efficiency. PLoS One. 13(10):e0205471.
- Bouyoucos GJ. 1962. Hydrometer method improved for making particle size analysis of soils. Agron J. 54:464–465.
- Chapman HD, Pratt PF. 1961. Methods of analysis for soils, plants and waters. Riverside: University of California, Division of Agricultural Science.
- Fageria NK, Moreira A, dos Santos AB. 2013. Phosphorus uptake and use efficiency in field crops. J Plant Nutr. 33(13):2013–2022.
- Fageria NK, Santos AB, Heinemann AB. 2011. Lowland rice genotypes evaluation for phosphorus use efficiency in tropical lowland. J Plant Nutr. 34:1087–1095.
- Feldman A, Ho WK, Massawe F, Mayes S. 2019. Bambara groundnut is a climate-resilient crop: how could a drought-tolerant and nutritious legume improve community resilience in the face of climate change? In: Sarkar A, Sensarma SR, van Loon GW, editors. BT-sustainable solutions for food security: combating climate change by adaptation. Cham: Springer; p. 151–167. ISBN 978-3-319-77878-5.
- GenStat. 2003. GenStat for windows. Release 4.23DE discovery edition. Hemel Hempstead: VSN.
- Gill HS, Singh A, Sethi SK, Behl RK. 2004. Phosphorus uptake and use efficiency in different varieties of bread wheat (Triticum aestivum L). Arch Agron Soil Sci. 50:563–572.
- Halimi AR, Mayes S, Barkla B, King G. 2019. The potential of the underutilized pulse bambara groundnut (Vigna subterranea (L.) Verdc.) for nutritional food security. J Food Compos Anal. 77:47–59.
- Hunt R. 1978. Plant growth analysis. London: Edward Arnold; p. 37.
- Iqbal A, Gui H, Zhang H, Wang X, Pang N, Dong Q, Song M. 2019. Genotypic variation in cotton genotypes for phosphorus-use efficiency. Agronomy. 9:689.
- Irfan M, Aziz T, Maqsood MA, Bilal HM, Siddique KHM, Xu M. 2020. Phosphorus (P) use efficiency in rice is linked to tissue-specific biomass and P allocation patterns. Sci Rep. 10:4278.
- Irfan M, Shah JA, Abbas M. 2017. Evaluating the performance of mungbean genotypes for grain yield, phosphorus accumulation and utilization efficiency. J Plant Nutr. 40(19):2709–2720.
- Jackson ML. 1962. Soil chemical analysis. Englewood Cliffs (NJ): Prentice Hall; p. 151–153.
- Jaetzold R, Schmidt H, Hornetz B, Shisanya C. 2010. Farm management handbook of Kenya. Volume II: natural conditions and farm management information. Annex: Atlas of agro-ecological zones, soils and fertilizing by group of districts. Subpart A2: Nyanza Province, Siaya County. Ministry of Agriculture, Kenya, in Cooperation with the German Agency for Technical Cooperation (GTZ).
- Jones GPD, Jesso RS, Blair GJ. 1992. Alternative methods for the selection of phosphorus efficiency in wheat. Field Crops Res. 30:29–40.
- Jones JB, Case VW. 1990. Sampling, handling and analyzing plant tissue samples. In: Westerman RL, editor. Soil testing and plant analysis. 3rd ed. Madison (WI): SSSA; p. 389–428.
- Kruse J, Abraham M, Amelung W, Baum C, Bol R, Kühn O, Lewandowski H, Niederberger J, Oelmann Y, Rüger C, et al. 2015. Innovative methods in soil phosphorus research: a review. J Plant Nutr Soil Sci. 178:43–88.
- Mateva KI, Chai HH, Mayes S, Massawe F. 2020. Root foraging capacity in bambara groundnut (Vigna subterranea (L.) Verdc.) core parental lines depends on the root system architecture during the pre-flowering stage. Plants. 9:645.
- Mayes S, Ho WK, Chai HH, Gao X, Kundy AC, Mateva KI, Zahrulakmal M, Hahiree MKIM, Kendabie P, Licea LCS, et al. 2019. Bambara groundnut: an exemplar underutilised legume for resilience under climate change. Planta. 250:803–820.
- McDonald G, Bovil W, Taylor J, Wheeler R. 2015. Responses to phosphorus among wheat genotypes. Crop Pasture Sci. 66(5):430–444.
- Namayanja A, Semoka J, Buruchara R, Nchimbi S, Waswa M. 2014. Genotypic variation for tolerance to low soil phosphorous in common bean under controlled screen house conditions. Agric Sci. 5:270–285.
- Nelson DW, Sommers LE. 1982. Total carbon, organic carbon and organic matter. In: Page AL, Miller RH, Keeney DR, editors. Methods of soil analysis, part 2. Chemical and microbiological properties. Madison (WI): American Society of Agronomy; p. 539–579.
- Nziguheba G, Zingore S, Kihara J, Merckx R, Njoroge S, Otinga A, Vandamme E, Vanlauwe B. 2016. Phosphorus in smallholder farming systems of sub-Saharan Africa: implications for agricultural intensification. Nutr Cycl Agroecosyst. 104:321–340.
- Odongo FO, Oyoo ME, Wasike V, Owuoche JO, Karanja L, Korir P. 2015. Genetic diversity of bambara groundnut (Vigna subterranea L.Verdc.) landraces in Kenya using microsatellite markers. Afr J Plant Biotechnol. 14(4):283–291.
- Ojo DK, Ogunbayo SA, Idehen EO, Akinwale AF, Oduwaye OA. 2007. Genetic evaluation of phosphorus utilization in tropical cowpea (Vigna unguiculata L.Walp). Afr J Biotechnol. 3(1):77–83.
- Sahrawat KL. 1987. Determination of calcium, magnesium, zinc and manganese in plant tissue using a dilute HCl extraction method. Commun Soil Sci Plant Anal. 18(9):947–962.
- Samago TY, Anniye EW, Dakora FD. 2018. Grain yield of common bean (Phaseolus vulgaris L.) varieties is markedly increased by rhizobial inoculation and phosphorus application in Ethiopia. Symbiosis. 75:245–255.
- Shiyam JO, Nkor NN, Binang WB, Effa EB. 2016. Yield response of bambara groundnut (Voandzeia subterrenea L. Thours.) varieties to organomineral fertilizer in the coastal forest of southeastern Nigeria. SCIREA J Agri. 1:91–106.
- Siddiqi MY, Glass ADM. 1981. Utilization index: a modified approach to the estimation and comparison of nutrient utilization efficiency in plants. J Plant Nutr. 4(3):289–302.
- Soltanpour PN, Workman S. 1979. Modification of the NaHCO3 DTPA soil test to omit carbon black. Commun Soil Sci Plant Anal. 10:1411–1420.
- Temegne NC, Taffouo VD, Tadoh TC, Gouertoumbo WF, Wakem GA, Nkou FTD, Nuemsiand PPK, Youmbi E. 2019. Effect of phosphate fertilization on growth, yield and seed phosphorus content of bambara pea (Vigna subterranea) land races. J Anim Plant Sci. 29(3):703–713.
- Yaseen M, Malhi SS. 2009. Variation in yield, phosphorus uptake, and physiological efficiency of wheat genotypes at adequate and stress phosphorus levels in soil. Commun Soil Sci Plant Anal. 40:3104–3120.
- Zhang Z, Tian X, Duan L, Wang B, He Z, Li Z. 2007. Differential responses of conventional and bt-transgenic cotton to potassium deficiency. J. Plant Nutr. 30:659–670.
- Zhou T, Du Y, Ahmed S, Liu T, Ren M, Liu W, Yang W. 2016. Genotypic differences in phosphorus efficiency and the performance of physiological characteristics in response to low phosphorus stress of soybean in southwest of China. Front Plant Sci. 7:1776.