
ABSTRACT
The aim of this study was to assess the extent of genetic diversity among and within tef populations collected from acid-affected soils in Ethiopia, and to test the cross-amplification of markers linked to Al-toxicity tolerance in other cereals. Forty-two tef genotypes were studied using 33 highly polymorphic SSRs. About 55% of the amplified putative alleles were effective in discriminating the genotypes. The mean PIC value was 0.66, suggesting that the majority of the markers had high discriminatory power. The population structure analysis revealed the presence of two genetically distinct populations and clearly distinguished landraces from the rest. A significant difference in genetic diversity parameters was observed between the two inferred populations. The landraces consistently had higher values for all of the diversity parameters and had contrastingly a higher value of private alleles. The AMOVA showed highly significant (P = 0.001) genetic variation among tef populations and among genotypes, with variance contribution of 17% and 67%, respectively. Eighty-two percent of the Al-toxicity tolerance markers amplified 84 alleles. This finding suggests the possibility of in-situ preservation of rare alleles that may confer acid tolerance through the improvement of available landraces in acid affected soils. Thus, urgent efforts are needed to collect accessions from areas with acid-affected soils.
Introduction
Tef [Eragrostis tef (Zucc.) Trotter] is an allotetraploid (2n = 4x = 40) herbaceous annual crop grown as staple food crop in Ethiopia (Assefa et al. Citation2015). It belongs to the family Poaceae, subfamily Eragrostoideae, tribe Eragrosteae and genus Eragrostis. This genus contains about 300 species (Costanza et al. Citation1979), but Eragrostis tef is the only species grown as food crop for its grain. Wide genetic diversity within the genus Eragrostis exists mainly in Ethiopia (Vavilov Citation1951; Costanza et al. Citation1979; Ketema Citation1993). Tef has versatile adaptability and can be grown under varied climatic and edaphic conditions (Ketema Citation1993; NRC Citation1996). It is also among widely grown crops in the acid soil-affected areas of Ethiopia.
Soil acidity-associated nutrient imbalances are known to cause a decline in species richness (Houdijk et al. Citation1993; Roem and Berendse Citation2000). In Ethiopia, the introduction of oat (Avena sativa) to the farming system of the acid-affected areas of the central highlands has replaced a wide range of crops grown in these areas (IBC Citation2007). Rapid expansion of the acid-tolerant crop, Triticale (X Triticosecale Wittmark), is also threatening genetic resource in acid-prone areas. Mamo et al. (Citation1996) and Mamo and Killham (Citation1987) reported poor response of tef to fertiliser application on acidic soils. The presence of genetic variability within tef (E. tef) was reported (Ermias et al. Citation2013). The high prevalence of brown-seeded tef landraces was also reported in acid-affected areas and altitudes of over 2400 m (NRC Citation1996). Nevertheless, the underlying scientific reason is not well known and has, therefore, not been studied. Currently, the extension programme is promoting the use of lime along with high-valued white-seeded improved tef varieties in acid-prone areas. Such a move is also an emerging threat to brown-seeded local landraces in acid soil areas.
Although, in Ethiopia, diverse tef landraces have been growing in acidic soil for centuries, the extent of genetic diversity among tef accessions from acid-affected areas has not been methodically investigated. Highly polymorphic simple sequence repeat (SSR) markers that could detect the level of diversity among tef accessions were identified (Zeid et al. Citation2011; Zeid et al. Citation2012). As a natural and artificial selection force, soil acidity can result in the selection of acid-tolerant species and variants (Hede et al. Citation2001; Stodart et al. Citation2007; Caniato et al. Citation2011). Hence, knowledge on the extent of genetic diversity in acid-affected areas can assist in systematic conservation and the use of genetic resources.
Comparative mapping studies showed extensive synteny or colinearity among genomes of cereals (Zeid et al. Citation2010). Out of 812 expressed sequence tag (EST)-derived markers of sixteen grass species tested for cross-amplification on tef, about 30% of them were successfully (Zeid et al. Citation2010). Extensive synteny for Al-tolerance gene among the genomes of different cereals was also reported (Magalhaes et al. Citation2004; Miftahudin et al. Citation2005; Benito et al. Citation2010). Currently, diagnostic markers for Al-tolerance genes: TaALMT1 (Raman et al. Citation2005) and TaMATE (Ryan et al. Citation2009) for wheat, HvMATE (Wang et al. Citation2007) for barley, SbMATE (Caniato et al. Citation2007) for sorghum and ScALMT1 (Benito et al. Citation2010) for rye have been identified. In addition, a quantitative trait loci (QTL) marker for ZmMATE1 in maize that partly explained phenotypic variation for Al-tolerance was also identified (Maron et al. Citation2010). Similarly, a quantitative trait locus (QTL) marker completely linked to Al tolerance and partly explained phenotypic variation for the trait has been identified in rice (Xue et al. Citation2007). Compared with globally important cereals, tef has been generally less researched for Al tolerance. However, the presence of extensive synteny for the Al-tolerance gene among the genomes of different cereals suggests the possibility of using markers developed for well-studied species in marker-assisted breeding (MAB) of tef and other less studied cereals (Varshney et al. Citation2006). Hence, the objectives of this study were to investigate the extent of genetic diversity among tef accessions collected from acid-affected soil and to examine the transferability of Al-tolerance markers developed for other cereals.
Materials and methods
Genetic stock
Twenty-six dominant phenotypes were extracted from 192 tef accessions received from the Institute of Biodiversity Conservation (IBC), Addis Ababa, Ethiopia. Accessions belonging to acid-affected areas were selected based on their passport data. The accessions were planted at the Adet Agricultural Research Centre and were purified through single panicle selection based on panicle colour and form. Phenotypes with the highest frequency were considered as a dominant phenotype of each accession at each of the collection sites. Generally, 1–5 single panicle selections were formed from each accession and the average number of selections was 2.5 per accession. Areas with widespread and strong soil acidity problem were identified based on secondary information from various sources. Accordingly, 10 acid soil districts belonging to the north-western, western and south western parts of the country were identified. Finally, 26 dominant phenotypes representing the 10 acid soil-affected districts were used for this study. Sixteen additional materials consisting of three improved tef varieties, two mutant lines and their parent, one tolerant local selection, three parents of mapping population for tef Al-tolerant QTL, three pasture varieties of tef from South Africa, one E. pilosa acc-35 and one E.curvula var. Ermello totalling 42 genetic materials were used in this study. Detailed information of all genetic materials is presented in Supplementary Table 1.
DNA extraction
Five seedlings per genotype were planted in pots in a greenhouse. Leaves were collected from healthy and vigorous four-week-old seedlings during the morning hours from 6.00 to 9.00 AM Five individual seedlings per genotype were proportionally sampled and leaves were pressed onto labelled FTA cards (www.Sigma-Aldrich.com) and wrapped in polythene bags. Pestles were used to press the leaf sample until both sides of the FTA card were soaked with a leaf extract. New polythene sheet coverings were used for each of the samples. The pressing board and the pestle were rinsed with 70% ethanol between each sample to avoid cross-contamination. Finally, the FTA cards were allowed to dry at room temperature for 4 h and then stored in paper bags and shipped to SciCorp, the then ICOTEC, laboratory, Pietermaritzburg, South Africa, for SSR analysis. DNA extraction was undertaken according to Mbogori et al. (Citation2006) and Adugna et al. (Citation2011).
PCR amplification
The DNA was extracted from bulked samples from the FTA cards per sample at the INCOTEC laboratory in South Africa (www.incotec.com). Sixteen highly polymorphic SSR primer pairs were identified by (Zeid et al. Citation2011) and evaluated by (Zeid et al. Citation2012) () and 17 molecular markers were associated with Al tolerance in relatively well-studied five cereal crops, such as two TaALMT1 (Raman et al. Citation2005) and two TaMATE (Ryan et al. Citation2009; Tovkach et al. Citation2013) from wheat, four HvMATE from barley (Wang et al. Citation2007), two SbMATE from sorghum (Caniato et al. Citation2007) and three ScALMT1 (Benito et al. Citation2010) from rye, and two quantitative trait loci (QTL) markers for ZmMATE1 from maize (Maron et al. Citation2010). An additional QTL marker completely linked to Al tolerance from rice (Xue et al. Citation2007) () was used to study the level of diversity and transferability of Al-tolerance markers to tef genome. PCR products were fluorescently labelled and separated by capillary electrophoresis on an ABI 3130 automatic sequencer (Applied Biosystems, Johannesburg, South Africa).
Table 1. Characteristics of 16 diagnostic SSR markers and 17 markers linked to Al-tolerant genes used in a genetic diversity study of Eragrostis tef.
Genetic diversity analysis
Two approaches were adopted to investigate the genetic structure and diversity among the tef genotypes. In the first approach, polymorphisms were treated as binary data (presence or absence). The binary data were used to obtain a dissimilarity matrix using the Jaccard index. The matrix was used to run a cluster analysis based on Neighbor-joining employing the software DARwin 5.0 (Perrier and Jacquemoud-Collet Citation2006). However, to determine the genetic structure within and among genotypes, a second approach based on the co-dominant nature of the marker was adopted using GENALEX version 6.5 (Peakall and Smouse Citation2012). Out of the 33 markers used for phenotyping of the 42 tef genotypes, 5 markers were eliminated from the analysis. Markers CNLTS60 & B1 were found to be monomorphic and markers CNLTs33, CNLTS136a/b & M181 had more than 50% missing data. Genetic diversity parameters, such as the total number of alleles per locus (Na), the number of effective alleles per locus (Ne), observed heterozygosity (Ho), average gene diversity (He), the inbreeding coefficient (FIS) and polymorphic information content (PIC), were determined using the protocol of Nei and Li (Citation1979). The number of genotypes represented by each population was unbalanced. Hence, allelic richness was corrected for sample size differences and estimated by using the rarefaction method implemented in HP-Rare 1.0 (Kalinowski Citation2005).
In addition to the predetermined population stratification as landraces, varieties and breeding materials, the Bayesian genotypic clustering approach of STRUCTURE 2.3.4 (Pritchard et al. Citation2000) was used to determine the population structure existing with the 42 genotypes. An admixture model with independent allele frequencies, without prior population information, was used to simulate the population. Each individual is grouped in a given cluster using ‘membership coefficient’ for each cluster interpreted as a probability of membership. To assign individual genotype to a given population and for optimal alignment of genotypes, 10 replicate structure analysis was conducted. The genotype membership was determined by using the computer program CLUMPP (Jakobsson and Rosenberg Citation2007). The structure analysis result was visualised by using the online genetic software STRUCTURE HARVESTER (Earl and vonHoldt Citation2012). To examine the population structure, other genetic parameters such as Shannon’s Information Index (I), population differentiation (FST), gene flow (Nm), Nei’s unbiased genetic distance (GD) and identity (GI) were estimated using GenAlex. The partitioning of total genetic variation into within and among the predetermined and inferred populations was done with a molecular analysis of variance (AMOVA) procedure using GenAlex. Gene flow (Nm) was calculated using the formula: Nm = 0.25 ((1–FIS)/FIS).
Cluster analysis
The binary data were used to obtain a dissimilarity matrix using the Jaccard index. The matrix was used to run a cluster analysis. Cluster analysis was done based on neighbor-joining algorithm using the un-weighted pair group method using arithmetic average (UPGMA) in DARwin 5.0 software (Perrier and Jacquemoud-Collet Citation2006). A dendrogram was then generated on the dissimilarity matrix to investigate the genetic relationships among accessions, and the genetic distances between all pairs of individual accessions were estimated to draw a dendrogram. Bootstrap analysis was performed for node construction using 10,000 bootstraps.
Results
Intra-population genetic diversity
presents the genetic diversity measure within and among the 42 fet genotypes. Twenty-eight of thirty-three (85%) of the primer pairs successfully amplified DNA fragments within the expected amplicon size range. However, five markers (three diagnostic: CNLTs33, CNLTs60 and CNLTs136) and (two Al tolerance: M181 and B1) were excluded from the analysis, because some of them were monomorphic and others had missing data of more than 50%. Six of the markers (CNLTs42, CNLTs133, CNLTs157, CNLTs295, CNLTs380 and CNLTs455a/b) showed slightly wider ranges than the expected range, signifying the presence of additional new alleles. This may be due the inclusion of rare alleles in the tef collection from acid soil areas and/or mutant lines used in this study.
presents the summery of the genetic diversity parameters of 42 tef genotypes based on 28 SSR markers. The genotypes showed a wide range of allelic diversity from 2 to 27, with a mean of 7.75 alleles per locus. The highest allele number was observed from marker CNLTs42 and the lowest was from TAMATE1B. The 28 markers used in this study amplified a total of 217 putative alleles, of which 55% (120) were effective in discriminating the genotypes. Seventy one percent of the markers showed an Ho value of 0.0 and an FIS value of 1.0, suggesting that the majority of the loci were fixed and reached 100% homozygosity, which was expected from self-pollinated crops such as tef. The genotypes revealed a mean average gene diversity (He) of 0.66, indicating that the possibility of two randomly sampled alleles in a given genotype to be different was greater than 66%. The mean PIC value was 0.66, and 78.6% of the loci had PIC values of ≥0.50. This suggested that the majority of the loci used in this study were highly polymorphic. This, in turn, indicates that the majority of the markers had a high discriminatory power and were found to be highly suitable for genetic diversity analysis. The average major allele frequency was 0.47, demonstrating that the observed alleles were evenly distributed within the genotypes.
Table 2. Genetic diversity within and among 42 tef genotypes based on 28 SSR markers.
The results of the cross-amplification of Al-toxicity tolerance markers in tef showed that except M18, an Al-toxicity tolerance marker from sorghum, with over 50% missing data, all the 16 markers of Al-toxicity tolerance developed for five cereal crop species were successfully cross-amplified in a tef genetic background. The B1, an Al-toxicity tolerance marker from rye, was found to be monomorphic and failed to differentiate among the tef genotypes. Eighty-eight percent of the Al-toxicity tolerance markers amplified 84 alleles (39%) of the total amplified alleles in tef genotypes used in this study. Among the total Al-toxicity tolerance alleles amplified in the tef genetic background, 40% (48 alleles) were effective in discriminating tef genotypes. The PIC of cross amplified markers ranged between 0.43 for the TAMATE1B marker from wheat and 0.85 for the GWM165 marker from Barley ().
Inter-population genetic diversity
Based on the 28 polymorphic SSR markers, the most likely population structure was observed at K = 2, indicating the presence of two genetically distinct populations (). This analysis clearly distinguished landraces from improved varieties and breeding lines with few admixtures. The first subpopulation consisted of 25 genotypes, of which 88% were landraces collected from different regions of Ethiopia. In this subpopulation, the improved varieties (Gemechis & Tseday) and wild species E.curvula were clustered. Similarly, the second subpopulation consisted of 17 genotypes, of which a majority were released varieties and breeding lines. Landraces 212924, 225747, 237734 and 238223 were classified in the second subpopulation.
Figure 1. Structure analysis visualised Structure Harvester. (A) Population genetic structure partitioned into K subpopulations (B) Population structure analysis of tef accessions at K = 2 based on inferred ancestry (Q matrix). Subpopulation 1 is represented by dark blue and subpopulation 2 by red.
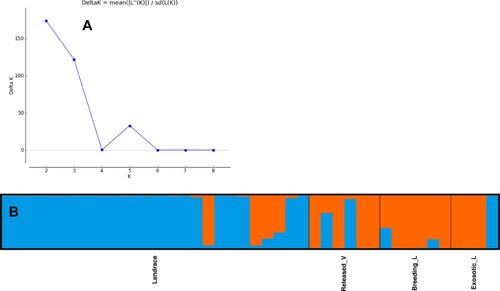
Inter-population genetic diversity analysis for the structure-generated two subpopulations indicated significant difference for five (Na, I, He, Pa and %P) of the eight genetic parameters used in this study (). The non-significant/slightly significant difference between landraces and the improved Ar, mean Na, I and Ho suggests the fact that the landraces had a narrow genetic base. Genetic diversity analysis for the four predetermined subpopulations revealed significant difference among the populations for all the genetic diversity parameters. The landraces consistently had higher values for all of the genetic diversity measures and were followed by the breeding materials. The observed higher private alleles for the landraces demonstrated that landraces may have specific alleles that assisted them to specifically adapt to acid soils.
Table 3. Genetic parameters of the 42 tef genotypes stratified based on structure analysis and based on a predetermined population structure in relation to cultivation status.
The result of analysis of molecular variance (AMOVA) showed a highly significant (P = 0.001) genetic variation among tef populations, among genotypes and within genotypes (). The between population variation was 17% of the total genetic variance in the structure-based stratification, whereas the predetermined population using cultivation status only explained 10% of the total variation. In the structure-based classification, about 67% of the genetic variation was attributed to variation among genotypes, while 16% was explained by variation within genotypes. However, based on cultivation status, the within population and the within genotype variation explained 73 and 17% of the total genetic variance, respectively. According to Wright (Citation1978) standard guidelines for the interpretation of genetic differentiation, all pairs of populations showed a moderate level of differentiation. However, the landraces showed relatively high degrees of differentiation (0.15) from the rest of the subpopulations. Gene flow between the landraces and the rest of the subpopulation was less than the gene flow between any other two subpopulations. High gene flow values of 2.51 and 2.32 were observed between the breeding materials and the exotic genotypes, and the breeding materials and the released varieties, respectively. This is expected because of the likelihood of physical and genetic mixtures being generated at the experimental stations.
Table 4. Analysis of molecular variance (AMOVA) of tef populations stratified based on structure analysis and B: based on a predetermined population structure using cultivation status.
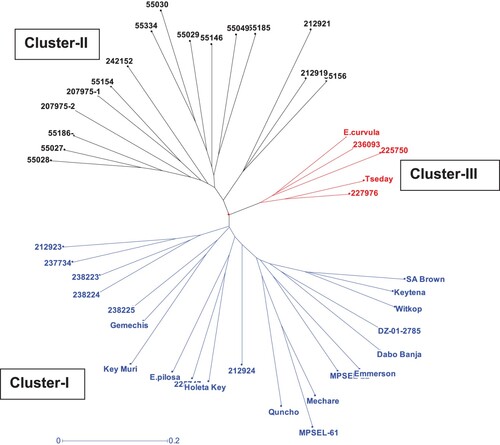
An elucidation of relatedness among the tef genotypes by a neighbour-joining algorithm using the unweighted pair group method (UPGMA) revealed three distinct clusters (). All the released varieties, except Tseday, and the three exotic pasture varieties from South Africa (Witkop, Emmerson and SA brown) and the breeding materials including E. pilosa were grouped under Cluster-I. In addition, 8 of the 27 landraces including Dabo Banja were grouped under this cluster. Cluster-II entirely constituted of the landraces and about 60% of the landraces were grouped under this cluster. The third cluster (Cluster–III) was constituted by five genotypes, one improved variety, tef wild relative E.curvula, and three landraces.
Figure 2. Un-weighted pair group method (UWPGM) dendrogram showing the genetic relationship of the 42 tef genotypes determined using 28 selected SSR markers.
Discussion
In this study, markers with more than 50% null alleles were eliminated from the analysis. The three markers, CNLTs33, CNLTS136 and M181, had more than 50% null alleles. Although the two former diagnostic markers were used in tef diversity analysis by Zeid et al. (Citation2012) and revealed high PIC and gene diversity values, the high frequency of null allels observed in this study could be associated with failure in primer annealing to the flanking regions of SSR markers due to mutation. Mutations on one or both of the primer-binding sites are likely to be the main cause of null alleles (Dakin and Avise Citation2004). However, the high null allele observed in M181, an Al-toxicity tolerance marker from sorghum, could be ascribed to the fact that either this marker is used as a diagnostic marker that tracks rare allele for Al-toxicity tolerance (Caniato et al. Citation2007) or the two crops belong to different genuses and the sorghum marker failed to amplify fragments in tef. Some of the monomorphic markers identified in this study were used in tef diversity analysis and were reported to have higher discriminating power between tef genotypes by Zeid et al. (Citation2012). The contrasting result observed in this study suggests that the tef population used in this study is substantialy different from the original population used by Zeid et al. (Citation2012). In this study, genotypes collected from acid soil areas constitute 64% of the total tef genotypes used.
The high discriminating power of the 28 SSR markers used in this study was demonstrated by their ability to adequately differentiate between tef breeding materials and released varieties that are related. For example, MPSEl-22 and MPSEL-61 were mutant M3 lines derived from an ethyl methane sulphonate (EMS)-treated variety, Tsedey (DZ-Cr-37). These two lines were discriminated from their parent and from one another. Similarly, Quncho and Gamachis, developed from a cross between Dukem (DZ-01-974) × Magna (DZ-01-196) (Belay et al. Citation2008), were also effectively separated. Tef is a highly self-pollinated plant with an out-crossing percentage of only 0.2–1.0% (Ketema Citation1993). Hence, about 71% of the loci revealed a high level of homozygosity and high fixation index (FIS) in this study. The high level of Ho observed in some diagnostic markers could be attributed to allelic multiplicity associated with the allotetraploid nature of the tef genome (Girma et al. Citation2018).
The structure analysis generated two distinct populations based on the degree of human involvement in selection and genetic recombination. Landraces where farmers’ and natural selection operate fall in one population, while the improved varieties fall in the other group. Cluster analysis using UPGMA, however, revealed the presence of an additional third cluster that consisted of E. curvula, a wild progenitor and some landraces. In the later clustering, the landraces were also clearly separated from improved varieties with few admixtures. This clustering pattern partly reflects the high genetic similarity of the tef cultivars, and, hence, the narrow genetic base of the tef improvement process (Abraha et al. Citation2016; Girma et al. Citation2018). E pilosa, one of the parents for the mapping population grouped with tef-improved varieties, suggested that E pilosa is the closest wild relatives of tef (Ingram and Doyle Citation2003). In this study, the result of the inter-population assessment of genetic diversity showed that the landraces had the widest genetic variation for most of the genetic diversity measures. This is expected since landraces are populations with high levels of genetic variability, having adapted to the natural and anthropological environments of their origin, and are, therefore, reservoirs of useful traits (Barcaccia Citation2010; Xu Citation2010; Abraha et al. Citation2016). The same rationale best explains the extremely high and contrasting value recorded for private alleles recorded in landraces collected from acid soil-affected areas.
Considerable levels of gene flow were observed between the tef subpopulations. For self-pollinated crops like tef, gene flow is likely to be human mediated (Govindaraju Citation1989). In this study, the high level of gene flow observed between the breeding, exotic and released varieties also confirmed the above-mentioned fact. For the genotypes, the indirect gene flow (Nm) estimates reported here do not reflect the contemporary variation in gene exchanges between subpopulations (Sork et al. Citation1999). Hence, the Nm values observed among the different subpopulations could be associated with various factors related to human movement over a long period of time. In addition, tef seed size is very small (hundred kernel mass = 0.18–0.38 mg) (Assefa et al. Citation2011), and, therefore, preserving complete fidelity of germplasm at the experimental stations and seed production schemes is difficult.
In this study, the proportion of variance explained by among genotypes’ variance is usually higher than the among populations’ variance in self-pollinated crops due to the high level of homozygosity within individual genotypes. A molecular diversity study conducted on tef populations collected from eight geographical areas using inter simple sequence repeat (ISSR) markers previously showed significant differences between and within populations (Assefa et al. Citation2003). A phenotypic diversity study of quantitative traits conducted on different populations of tef belonging to six regions and three altitudinal ranges also showed a highly significant variation between populations of different geographic origins, and between populations from the different altitudinal ranges for most of the quantitative traits studied (Assefa et al. Citation2001). A similar pattern was also reported from a previous study (Tadesse Citation1993).
The low number of private alleles in the population of released varieties observed in this study can be related to the impact of plant breeding that narrows the genetic base. Selection for economically important traits through plant breeding is known to reduce the frequency of rare alleles and the overall genetic diversity (Fu et al. Citation2006; Rauf et al. Citation2010). Driven by the need to enhance crop production, an expanded cultivation of released varieties has resulted in the replacement of some landraces in Ethiopia (Tsegaye and Berg Citation2007). In tef, white-seeded and high-yielding varieties that rely on optimal external inputs have become a threat to tef genetic diversity (Assefa et al. Citation2001; Belay et al. Citation2008; Zeid et al. Citation2012). The current push by the national extension services for farmers to plant-released varieties of tef and other cereals, combined with the application of lime, are direct threats to tef landraces adapted to acid soils. Over 69% of tef accessions that represented the dominant phenotypes collected from areas with acid soils in this study were brown seeded.
In the present study, the tef populations represented not only different geographical areas but also specific acid soil ecologies. Despite wide geographical separation, about 60% of the landraces collected from acidic soil areas were grouped under one cluster or subpopulation. Significantly higher numbers of private alleles were found in the landraces from acid soil ecologies, indicating the presence of distinct genetic features in these accessions. Soil acidity and associated mineral imbalances are known to select acidophilic or calcifuge species and variants within species (Houdijk et al. Citation1993; Roem and Berendse Citation2000; Pilbeam and Morley Citation2007). In crop plants, several studies have documented that most of the acid soil-tolerant crop varieties have been selected from accessions collected from regions where highly acidic soils of the world are prevalent (Hede et al. Citation2001; Stodart et al. Citation2007; Caniato et al. Citation2011; Maron et al. Citation2013; Guimaraes et al. Citation2014). In this study, 15 out of the 17 Al-toxicity tolerance markers developed for five well-studied cereal crops were successfully amplified 84 alleles in a tef genetic background. This may suggest the fact that these markers are conserved across cereals. A comparative mapping study indicated extensive synteny and collinearity among genome grass species (Devos and Gale Citation2000; Sorrells et al. Citation2003; Zhu and Buell Citation2007). But a conserved gene does not necessarily mean conserved function (Rahman and Paterson Citation2010). In the case of cereals and grass species, Al-toxicity tolerance genes and gene functions are conserved. According to a comprehensive review of Ermias et al. (Citation2013), the exclusion of the toxic Al species through an extrusion of organic acids like malate and citrate is the most common mechanism. Except in maize and rice where Al-toxicity tolerance is controlled by quantitative genes and additional mechanisms of tolerance are involved, only a few major genes control the trait in wheat, barley, rye, oat and sorghum. In the present study, the cross-amplification of markers constituted from five cereals suggested that the Al-toxicity tolerance in tef may involve several genes. Future genetic resource conservation and the development of Al-toxicity-tolerant varieties need to make best use of these genetic resources.
In conclusion, the high discriminating power of the 28 SSR markers used in this study was demonstrated by their ability to adequately differentiate among tef genotypes related in pedigree. The majority of the Al-toxicity tolerance markers used in this study cross-amplified fragments in tef, with PIC values ranging from 0.43 to 0.85. Out of the total of 17 Al-tolerance markers, 14 (82%) revealed high fixation indices >85%, suggesting that these markers are conserved across the cereal genomes. Though a conserved gene does not necessarily mean a conserved function for all traits, Al-toxicity tolerance genes and gene functions in cereals and grass species are conserved. The current push by the national extension services for the production of ‘improved varieties’ of tef along with lime is costly and a threat to acidophilic crop species and landraces. Thus, the development and deployment of acid soil-tolerant crop varieties is imperative, and such breeding programmes must make best use of these genetic resources. This will help to achieve two important goals. Firstly, it will improve food security and the livelihoods of small-scale farmers who do not have the resources to use lime for the amelioration of soil acidity. Secondly, it will assist in the preservation of rare alleles that may confer acid tolerance under conditions imposed by farmers. Thus, urgent efforts to collect a representative spectrum of accessions from areas with acid soils are needed to rescue the threatened private alleles present in tef landraces that have evolved to tolerate acid soils. Further studies on finding unique alleles for Al toxicity, identifying markers for the MAS of Al tolerance and exploiting syntenic relationships to identify candidate genes and understand their function will be needed.
Supplementary_Table_1.docx
Download ()Acknowledgements
The African Centre for Crop Improvement, University KwaZulu-Natal (UKZN), South Africa, is acknowledged for affording the authors the opportunity to do this research and ICOTEC laboratory, Pietermaritzburg, South Africa, for conducting the SSR genotyping. Ermias Abate designed, initiated and managed the project, and contributed to manuscript preparation, and Assefa Amelework contributed to data analysis, manuscript preparation and submission. Hussein Shimelis, Fentahun Mengistu and Mark Laing contributed to manuscript preparation and edition.
Disclosure statement
No potential conflict of interest was reported by the author(s).
Additional information
Notes on contributors
Ermias Abate
Dr Ermias Abate is a plant breeder and horticulturalist by training. He got his BSc from Alemaya Agricultural University, in Ethiopia and his MSc in horticulture and crop protection from the University of Jordan, Amman. He got his PhD from University of KwaZulu-Natal, Pietermaritzburg, South Africa in plant breeding. His thesis research was pre breeding of tef for Al-toxicity tolerance. Ermias is a pioneer to investigate reaction of tef to Al-toxicity tolerance as a part of his PhD work and is working to address the widespread Al-toxicity in Ethiopia through development Al-toxicity tolerant crop varieties. Ermias has contributed over 25 publications in international journals and local publications.
Hussein Shimelis
Professor Hussein Shimelis is working at the University of KwaZulu-Natal (UKZN), South Africa. He is interested in genetic improvement of crops for yield gains and biotic and abiotic stress tolerance. He mentors a dedicated team of the next generation postgraduate students in Plant Breeding and Crop Science. He has published over 200 articles. He has supervised 37 PhD and 23 MSc students. He serves as Chair of Crop Science and Deputy Director of the African Centre for Crop Improvement at UKZN.
Assefa Amelework
Dr Assefa Amelework is a plant breeder by training. She got her BSc in plant sciences from Haromya University (the then Alemaya University of Agriculture), in Ethiopia, her MSc in plant breeding and genetic resources from Wageningen University and Research, the Netherlands and her PhD in plant breeding from the University of KwaZulu-Natal, South Africa. She has got more than 20 years of research experience in plant breeding and genetic resources. She has authored/co-authored more than 35 peer reviewed research articles. Currently, she is working as senior researcher at the Agricultural Research Council-Vegetable, industrial and Medicinal Plants, South Africa.
Fentahun Mengistu
Dr Fentahun Mengistu served as agricultural researcher and research leader in the Ethiopian Agricultural Research system for over 30 years. Currently, he is working for the Sasakawa Africa Association at the capacity of Country Director of Sasakawa Global 2000 Ethiopia where he is directing and coordinating improved agriculture technologies and best practices access, and capacity building of farmers, agricultural extension agents and other actors along the agricultural value chain/Agri-food system. His research focus is on crop protection, crops agronomy and breeding, crop agro-biodiversity, home gardening, microbiology, and nutrition. He has authored/co-authored 23 Journal articles, 25 conference proceedings, 12 publications in the form of books, manuals, guidelines; and more than 32 concept paper and training presentations at various high level fora.
Mark Laing
Professor Mark Laing is senior professor and chair of plant pathology and the director of African Centre for Crop Improvement (ACCI). His research is in plant protection, using plant breeding, biological control and silicon fertilizer to manage diseases, pests and parasitic weeds. This research has extended to animal health, where he has project on the use of bacteriophages to control mastitis, and plant extracts and biocontrol agents to manage liver flukes and gastrointestinal nematodes in ruminants. He has 91 ISI accredited publications, 41 popular publications; 168 conference proceedings, 6 books co-edited, and 20 book chapters co-authored. He has supervised or co-supervised to completion 8 post-docs, 49 PhD, 56 MSc and 88 BSc honours students to graduation.
Related Research Data
References
- Abraha MT, Shimelis H, Laing M, Assefa K, Amelework B. 2016. Assessment of the genetic relationship of tef (Eragrostis tef) genotypes using SSR markers. South Afr J Bot. 105:106–110. doi:10.1016/jsajb201512009.
- Adugna A, Sweeney PM, Snow AA. 2011. Optimization of a high throughput, cost effective, and all-stage DNA extraction protocol for sorghum (Sorghum bicolor). J Agr Sci Technol. 5:243–250.
- Assefa K, Cannarozzi G, Girma D, Kamies R, Chanyalew S, Plaza-Wüthrich S, Blösch R, Rindisbacher A, Rafudeen S, Tadele Z. 2015. Genetic diversity in tef [Eragrostis tef (Zucc.) Trotter]. Front Plant Sci. 6:177. doi:10.3389/fpls.2015.00177.
- Assefa K, Menker A, Tefera H. 2003. Inter simple sequence repeat (ISSR) analysis of genetic diversity in tef [Eragrostis tef (Zucc) Trotter]. Hereditas. 139:174–183. doi:10.1111/j1601-5223200301800x.
- Assefa K, Tefera H, Menker A, Kefyalew T, Hundera F. 2001. Quantitative trait diversity in tef [Eragrostis tef (Zucc) Trotter] germplasm from Central and Northern Ethiopia. Gen Res Crop Evol. 48:53–61.
- Assefa K, Yu J-K, Zeid M, Belay G, Tefera H, Sorrells ME. 2011. Breeding tef [Eragrostis tef (Zucc) Trotter]: conventional and molecular approaches. Plant Breed. 130:1–9. doi:10.1111/j1439-0523201001782x.
- Barcaccia G. 2010. Molecular markers for characterizing and conserving crop plant germplasm. In: Mohan S, Jain S, Brar DS, editor. Molecular techniques in crop improvement. 2nd ed. London: Springer; p. 231–253.
- Belay G, Tefera H, Getachew A, Assefa K, Metaferia G. 2008. Highly client-oriented breeding with farmer participation in the Ethiopian cereal tef [Eragrostis tef (Zucc) Trotter]. Afr J Agr Res. 3:022–028.
- Benito C, Silva-Navas J, Fontecha G, Hernández-Riquer M, Eguren M, Salvador N, Gallego F. 2010. From the rye Alt3 and Alt4 to aluminum tolerance loci to orthologous genes in other cereals. Plant Sol. 327:107–120. doi:10.1007/s11104-009-0035-9.
- Caniato FF, Guimaraes CT, Hamblin M, Billot C, Rami JF, Hufnagel B, et al. 2011. The relationship between population structure and aluminum tolerance in cultivated sorghum. Plos One 6, e20830. doi:10.1371/journalpone0020830.
- Caniato FF, Guimarães CT, Schaffert RE, Alves VMC, Kochian LV, Borém A, Klein PE, Magalhaes JV. 2007. Genetic diversity for aluminum tolerance in sorghum. Theor Appl Genet. 114:863–876. doi:10.1007/s00122-006-0485-x.
- Costanza SH, Dewet JMJ, Harlan JR. 1979. Literature and numerical taxonomy of tef (Eragrostis tef). Econ Bot 33:413–424.
- Dakin EE, Avise JC. 2004. Microsatellite null alleles in parentage analysis. Heredity. 93:504–509.
- Devos KM, Gale MD. 2000. Genome relationships: the grass model in current research. Plant Cell Physiol. 12:637–646. doi:10.1105/tpc125637.
- Earl DA, vonHoldt BM. 2012. Structure Harvester: a website and program for visualizing STRUCTURE output and implementing the Evanno method. Cons Genet Res. 4:359–361. doi:10.1007/s12686-011-9548-7.
- Ermias A, Shimelis H, Laing M, Fentahun M. 2013. Quantitative responses of tef [Eragrostis tef (Zucc) Trotter] and weeping love grass [Eragrostis curvula (Schrad) Nees] varieties to acid soil. Aust J Crop Sci. 7:1854–1860.
- Fu Y-B, Peterson GW, Yu J-K, Gao L, Jia J, Richards KW. 2006. Impact of plant breeding on genetic diversity of the Canadian hard red spring wheat germplasm as revealed by EST-derived SSR markers. Theor Appl Genet. 112:1239–1247. doi:10.1007/s00122-006-0225-2.
- Girma D, Cannarozzi G, Weichert A, Tadele Z. 2018. Genotyping by sequencing reasserts the close relationship between tef and its putative wild Eragrostis progenitors. Diversity (Basel). 10:17. doi:10.3390/d10020017.
- Govindaraju DR. 1989. Variation in gene flow levels among predominantly self-pollinated plants. J Evol Biol. 2:173–181. doi:10.1046/j1420-910119892030173x.
- Guimaraes CT, Simoes CC, Pastina MM, Maron LG, Magalhae JV, Vasconcellos RCC, et al. 2014. Genetic dissection of Al tolerance QTLs in the maize genome by high density SNP scan. Genomics. 15:153–167. doi:10.1186/1471-2164-15-153.
- Hede AR, Skovmand B, López-Cesati J. 2001. Acid soils and aluminum toxicity. In: Reynolds MP, Ortiz-Monasterio JI, McNab A, editor. Application of physiology in wheat breeding. Mexico: CIMMYT; p. 172–182.
- Houdijk ALFM, Verbeek PJM, Van Dijk HFG, Roelofs JGM. 1993. Distribution and decline of endangered herbaceous heathland species in relation to the chemical composition of the soil. Plant Soil. 148:137–143. doi:10.1007/BF02185393.
- IBC. 2007. Ethiopia: Country report on the state of plant genetic resources for food and agriculture (PGRFA to FAO) Institute of Biodiversity Conservation Institute (IBC), Addis Ababa, Ethiopia Website: https://www.ebi.gov.et/publications/.
- Ingram AL, Doyle JJ. 2003. The origin and evolution of Eragrostis tef (Poaceae) and related polyploids: evidence from nuclear waxy and plastid rps161. Am J Bot. 90:116–122. doi:10.3732/ajb0900168.
- Jakobsson M, Rosenberg NA. 2007. CLUMPP: a cluster matching and permutation program for dealing with label switching and multimodality in analysis of population structure. Bioinformatics. 23:1801–1806. doi:10.1093/bioinformatics/btm233.
- Kalinowski ST. 2005. HP-RARE10: a computer programme for performing rarefaction on measures of allelic richness. Mol Ecol Notes. 5:187–189. doi:10.1111/j1471-8286200400845x.
- Ketema S. 1993. Tef Eragrostis tef (Zucc) Trotter promoting the Conservation and Use of underutilized and neglected crops Institute of plant Genetics and crop plant research. Rome, Italy: Gatersleben / International Plant Genetic Resources Institute-IPGRI.
- Magalhaes JV, Garvin DF, Wang YH, Sorrells ME, Klein PE, Schaffert RE, Li L, Kochian LV. 2004. Comparative mapping of a major aluminum tolerance gene in sorghum and other species in the Poaceae. Genetics. 167:1905–1914. doi:10.1534/genetics103023580.
- Mamo T, Killham KS. 1987. Effect of soil liming and vesicular-arbuscular-mycorrhizal inoculation on the growth and micronutrient content of the tef plant. Plant Soil. 102:257–259. doi:10.1007/BF02370712.
- Mamo T, Richter C, Hoppenstedt A. 1996. Phosphorus response studies on some varieties of durum wheat (Triticum durum Desf) and tef (Eragrostis tef (Zucc) Trotter) grown in sand culture. J Agron Crop Sci. 176:189–197. doi:10.1111/j1439-037X1996tb00463x.
- Maron LG, Guimarães CT, Kirst M, Albert PS, Birchler JA, Bradbury PJ, et al. 2013. Aluminum tolerance in maize is associated with higher MATE1 gene copy number. Proc Natl Acad Sci. 110:5241–5246. doi:10.1073/pnas1220766110.
- Maron LG, Pineros MA, Guimaraes CT, Magalhaes JV, Pleiman JK, Mao C, Shaff J, Belicuas SNJ, Kochian LV. 2010. Two functionally distinct members of the MATE (multi-drug and toxic compound extrusion) family of transporters potentially underlie two major aluminum tolerance QTLs in maize. Plant J. 61:728–740. doi:10.1111/j1365-313X200904103x.
- Mbogori MN, Kimani M, Kuria A, Lagat M, Danson JW. 2006. Optimization of FTA technology for large scale plant DNA isolation for use in marker assisted selection. Afr J Biotech. 5:693–696.
- McCouch SR, Teytelman L, Xu Y, Lobos KB, Clare K, Walton M, Fu B, Maghirang R, Li Z, Xing Y, Zhang Q, Kono I, Yano M, et al. 2002. Development and mapping of 2240 new SSR markers for rice (Oryza sativa L.). DNA Res. 9, 199-207. doi:10.1093/dnares/9.6.199.
- Miftahudin A, Chikmawati T, Ross K, Scoles GJ, Gustafson JP. 2005. Targeting the aluminum tolerance gene Alt3 region in rye, using rice/rye micro-colinearity. TAG Theor Appl Genet. 110:906–913. doi:10.1007/s00122-004-1909-0.
- Nei M, Li W. 1979. Mathematical method for studying genetic variation in terms of restriction endonucleases. Proc Natl Acad Sci. 765:256–5273. doi:10.1073/pnas76105269.
- NRC. 1996. Lost crops of Africa, volume-I. Washington (DC): Grains National Academy Press.
- Peakall R, Smouse PE. 2012. Genalex 65: genetic analysis in excel population genetic software for teaching and research—an update. Bioinformatics. 28:2537–2539. doi:10.1093/bioinformatics/bts460.
- Perrier X, Jacquemoud-Collet JP. 2006. DARwin software. Available from: https://darwin.cirad.fr/
- Pilbeam DJ, Morley PS. 2007. Calcium. In: Barker AV, Pilbeam DJ, editor. Handbook of plant nutrition. Boca Raton: Taylor and Francis; p. 121–144.
- Pritchard JK, Stephens M, Donnelly P. 2000. Inference of population structure using multilocus genotype data. Genetics. 155:945–959.
- Rahman M, Paterson AH. 2010. Comparative genomics in crop plants. In: Jains SM, Brar DS. (eds.) Molecular Techniques in Crop Improvement London: Springer, pp. 23-60.
- Raman H, Kerong Z, Mehmet C, Rudi A, David FG, Lyza GM, et al. 2005. Molecular characterization and mapping of ALMT1, the aluminium-tolerance gene of bread wheat (Triticum aestivum L). Genome. 48:781–791. doi:10.1139/g05-054.
- Rauf S, Silva JAT, Khan AA, Naveed A. 2010. Consequences of plant breeding on genetic diversity. Intern J Plant Breed. 4:1–21.
- Roem WJ, Berendse F. 2000. Soil acidity and nutrient supply ratio as possible factors determining changes in plant species diversity in grassland and heathland communities. BiolConser. 92:151–161. doi:10.1016/S0006-3207(99)00049-X.
- Ryan PR, Raman H, Gupta S, Horst WJ, Delhaize E. 2009. A second mechanism for aluminum resistance in wheat relies on the constitutive efflux of citrate from roots. Plant Physiol. 149:340–351. doi:10.1104/pp108129155.
- Sork VL, Nason J, Cambell DR, Fernandez JF. 1999. Landscape approaches to historical and contemporary gene flow in plants. Trends Ecol Evol. 14:19–224. doi:10.1016/S0169-5347(98)01585-7.
- Sorrells ME, Rota ML, Bermudez-Kandianis CE, Greene RA, Kantety R, Munkvold JD, et al. 2003. Comparative DNA sequence analysis of wheat and rice genomes. Genome Res. 13:1818–1827. doi:10.1101/gr1113003.
- Stodart BJ, Raman H, Coombes N, Mackay M. 2007. Evaluating landraces of bread wheat (Triticum aestivum L) for tolerance to aluminium under low pH conditions. Genet Resour Crop Evol. 54:759–766. doi:10.1007/s10722-006-9150-0.
- Tadesse D. 1993. Study on genetic variation of landraces of tef [Eragrostis tef (Zucc) Trotter] in Ethiopia. Genet Resour Crop Evol. 40:101–104. doi:10.1007/BF00052640.
- Tovkach A, Ryan PR, Richardson AE, Lewis DC, Rathjen TM, Ramesh S, Tyerman SD, Delhaize E. 2013. Transposon-Mediated alteration of TaMATE1B expression in wheat confers constitutive citrate efflux from root apices. Plant Physiol. 161:880–892. doi:10.1104/pp112207142.
- Tsegaye B, Berg T. 2007. Genetic erosion of Ethiopian tetraploid wheat landraces in Eastern Shewa, Central Ethiopia. Genet Resour Crop Evol 54:715–726. doi:10.1007/s10722-006-0016-2.
- Varshney RK, Hoisington DA, Tyagi AK. 2006. Advances in cereal genomics and applications in crop breeding. Trends Biotechnol. 24:490–499.
- Vavilov I. 1951. The origin, variation, immunity and breeding of cultivated plants. New York, USA: Ronald Press Co.
- Wang J, Raman H, Zhou M, Ryan PR, Delhaize E, Hebb DM, Coombes N, Mendham N. 2007. High-resolution mapping of the Alp locus and identification of a candidate gene HvMATE controlling aluminium tolerance in barley (Hordeum vulgare L). TAG Theor Appl Genet. 115:265–276. doi:10.1007/s00122-007-0562-9.
- Wright S. 1978. Evolution and the genetics of populations. Variability within and among natural populations (Vol. 4). Chicago (IL): University of Chicago Press.
- Xu Y. 2010. Molecular plant breeding. Wallingford, UK: CABI Publishing.
- Xue Y, Jiang L, Su N, Wang JK, Deng P, Ma JF, Zhai HQ, Wan JM. 2007. The genetic basic and fine-mapping of a stable quantitative-trait loci for aluminium tolerance in rice. Planta. 227:255–262. doi:10.1007/s00425-007-0613-0.
- Zeid M, Assefa K, Haddis A, Chanyalew S, Sorrells ME. 2012. Genetic diversity in tef (Eragrostis tef) germplasm using SSR markers. Field Crops Res. 127:64–70. doi:10.1016/jfcr201110013.
- Zeid M, Belay G, Mulkey S, Poland J, Sorrells ME. 2011. QTL mapping for yield and lodging resistance in an enhanced SSR-based map for tef. Theor Appl Genet. 122:77–93. doi:10.1007/s00122-010-1424-4.
- Zeid M, Yu JK, Goldowitz I, Denton ME, Costich DE, Jayasuriya CT, Saha M, Elshire R, Benscher D, Breseghello F, Munkvold J, Varshney RK, Belay G, Sorrells ME. 2010. Cross-amplification of EST-derived markers among 16 grass species. Field Crops Res 118, 28–35. 2010. doi:10.1016/j.fcr.2010.03.014.
- Zhu W, Buell CR. 2007. Improvement of whole-genome annotation of cereals through comparative analyses. Genome Res. 17:299–310. doi:10.1101/gr5881807.