
ABSTRACT
In vivo measurements of the optical properties of plant leaves, by spectrophotometric methods, could potentially provide very useful information for the assessment of the plant’s health. This paper describes a novel experimental set-up that enables continuous measurements of the optical reflection and transmission coefficients of broad-leaved plants. The optical spectral characteristics of leaves, in the broad wavelength range, are often a discussed topic in the scientific literature. Nevertheless, to the best of our knowledge, the real-time spectral analyses of the leaf haven’t been reported so far. Monitoring the evolution of the plant activity in real-time has resulted in the graph of the spectral Circadian rhythm as a function of time. The set-up was tested on Phaseolus vulgaris and the results of the measurements are presented and discussed.
Introduction
The general state of a plant is strongly correlated with the intensity of the photosynthetic processes in its leaves (Fourty et al. Citation1996). On the other hand, the quantity of the absorbed light represents a good measure for the intensity of the photosynthesis (Chaerle and Van der Straeten Citation2000). It is well known that the green plants absorb mostly in the blue and red regions of the visible light spectrum (Chaerle et al. Citation2007; Ferl et al. Citation2002). The absorption spectra of chlorophyll-a exhibit maxima at 430 and 664 nm. For chlorophyll-b the corresponding maxima are at 460 and 647 nm, respectively (Knapp and Carter Citation1998; Carter and Spiering Citation2002). Keeping in mind the correlation with the leaf spectral response at 660 nm (Knapp and Carter Citation1988; Yamada and Fujimura Citation1988; Liew et al. Citation2008), we have exclusively focused our research on the single-wavelength spectroscopy (660 nm).
One of the experimental challenges is the fact that during its growth a plant's leaf changes its spatial position. This effect can influence the readout results for reflection and transmission. To minimise these effects, multiple repeated measurements were performed simultaneously on a group of leaves. The systematic error, due to the change of the leaf’s orientation (with respect to the system’s optical axis), is thus randomised. A measurement apparatus, which can real-time track (in vivo) the optical transmission coefficient leaves of a plant under investigation, should provide very useful information about plants’ physiological condition (Taiz and Zeiger Citation2003).
In this paper we describe a measurement system that can track the optical transmission of leaves during the complete life circle of a plant. Moreover, measurement points can be taken and logged at the minute time-scale intervals. A great care has been taken to avoid any mechanical pressure to the leaves, so that the plants’ growth resembles natural conditions as close as possible (Tilman Citation1999). The provision for measuring of the reflection (Carter Citation1993; Gitelson et al. Citation2002; Grant Citation1987; Grant et al. Citation1993; Piekarczyk Citation2001) (at 45-degree incidence and reflection angle) is not the primary aim of this apparatus. It was included to provide some additional information at the very low additional expense. An example of the state-of-the-art measurements of the leaves’ reflection properties was described in Combes et al. Citation2007. However, our main objective is tracking of the leaf optical transmission.
To benchmark our apparatus and measurement methods, we performed a series of experiments on Phaseolus vulgaris. It is important to note that the P. vulgaris was chosen somewhat arbitrary to demonstrate the proof of concept method. The method should be applicable to any plant species with thin broad leaves.
Materials and methods
The experiment was set up in an indoor environment for the plant P. vulgaris. The experimental apparatus provides 20 independent ‘channels’ where each channel corresponds to a single leaf. The channels were distributed into four independent groups with each group containing five single channels. Each group was treated with different light conditions.
An illustration of a single measurement channel is given in . For each channel, the source of light is a red LED with the spectral emission maximum at 656 nm. To disambiguate these light sources from the high-luminosity sources used for the plant growing, these LEDs will be called ‘Signal LEDs’. Each Signal LED was mounted in a temperature-controlled box and coupled to an optical fibre (Bornman and Vogelmann Citation1991; Vogelmann Citation1993; Vogelmann et al. Citation1988). The other end of this fibre was attached to the appropriate leaf holder made of a transparent plastic (methyl methacrylate), as shown in . Signal LED power was provided with stabilised supplies that were controlled by the data-acquisition computer.
Figure 1. Single measurement channel.
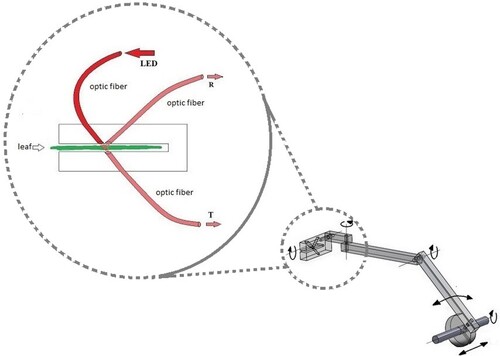
Two additional optical fibres, one collecting transmitted and one collecting reflected light, are also incorporated in the arrangement. The light collection fibres were also attached to a leaf holder.
The optical fibres transmit the collected light to the photodiodes which are kept in a thermostated shielded box. The box protects the photodiodes from the stray light, electrical interference and from the temperature variations. In addition, in front of each photodiode a sharp band-pass interference filter (centred at 665 nm) was inserted, thus further reducing the ambient light leakage from the optical fibres. The leaf holder was designed to enable five degrees of freedom for the mechanical movement, thus providing the means to track the leaf’s position and orientation.
The firing sequence of the signal LEDs was controlled by a PC via a dedicated digital I/O card. The signals from the photodiodes were routed through the analogue multiplexer (HP 34970A) to the precision digital multimetre (DMM) (HP 34970A). The DMM was connected to the PC via an RS-232 interface. Block diagram of the described set-up is given in .
Figure 2. Block diagram.
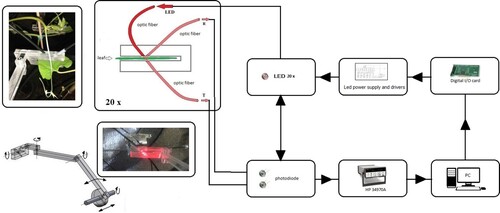
For a given group of channels, measurements were performed by the sequential firing of each channel. The duration of a single sequence used for the measurements was ∼90 s. The sequences were repeated every 15 min for the duration of the experiment (7 days). To control the experiment and collect data, we have developed an in-house code written in the so-called G language.
System calibration
To infer the values for the optical transmission and reflection coefficients, it is necessary to account for the individual sensitivity of each channel. The differences between the channels are due to the differences between the individual LED’s emission efficiency, attenuation of the individual optical fibres, as well as due to the minor mechanical positioning errors of individual channels.
For the transmission, a set of calibrated neutral density filters (NDFs) was used. For each individual channel, we measured transmitted signal for each filter in the set. Thus, we obtained relative sensitivities of the channels. The measured sensitivities were used as correction factors, thus placing readings of each channel on the same (relative) scale.
Similarly, for the reflection, an ‘ideal’ diffusive target was used. The actual target was prepared by painting a suitable plate with barium sulphate, which has almost ideal diffusive characteristics. Regarding the transmission, a set of correction factors was derived and the relative reflection coefficients were placed on the same scale.
It is worth noting that the described procedures enable accurate assessment of the relative values for the transmission and reflection and they only account for the differences between individual channels, placing the results on the same scale.
Plant material
For the current experiment, the plants of P. vulgaris L. were used. P. vulgaris belongs to C3 group of plants which have no photosynthetic adaptations. This group of plants tends to thrive in areas where sunlight intensity and temperatures are moderate and carbon dioxide concentrations are around 400 ppm or higher. Seeds of P. vulgaris were germinated in commercial humus. Seven days after germination, the plantlets were developed with the first pair of leaves, and these plantlets were used as starting plant materials. For each experimental run, 20 plantlets of the same age and similar size were used. Duration of the experiments was 13 days. Experiments were repeated in triplicate.
There were four different treated groups of plants. Each group was exposed to different lighting conditions:
Group I: Plants were grown in dark conditions (total darkness 24 h for 7 days)
Group II: Plants were grown under day-light regime (the plants were grown indoors in a room with relatively large window areas facing south during March 2020, latitude 44.8246°N 20.4581°E: sunrise about 6 am, sunset about 6 pm)
Group III: Plants were grown under LED light regime (plant growing LED was turned on for 24 h for 7 days).
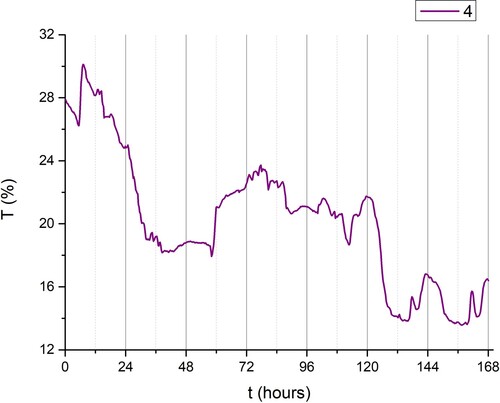
Group IV: Plants were grown under combined LED light and day-light (combined day-light described in group II and LED light regime described in group III).
Chlorophylls and carotenoid quantification
Photosynthetic pigments were extracted from 100 mg frozen leaves in 96% (v:v) ethanol. The pigment content of the filtered solution was measured using the classical spectrophotometric method with a UV–visible spectrophotometer (Agilent 8453) at three wavelengths: 470, 648, and 664 nm (Socaciu Citation2007). The amount of pigments was calculated according to the equations of Lichtenthaler (Lichtenthaler Citation1987).
Results and discussion
and show per cent variations of the coefficients of transmission/reflection as a function of time. The time interval covered by graphics was 7 days for all 4 groups.
Figure 3. Variation of transmittance T (%) as a function of time in days (started from midnight), group I (dark).
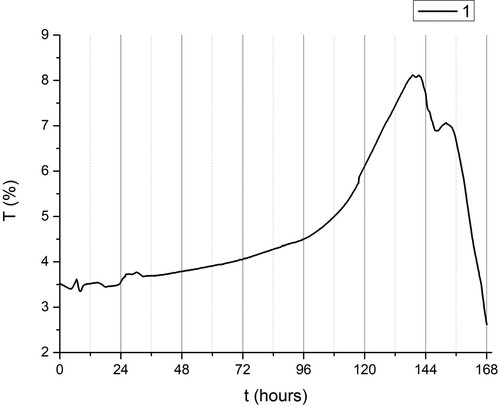
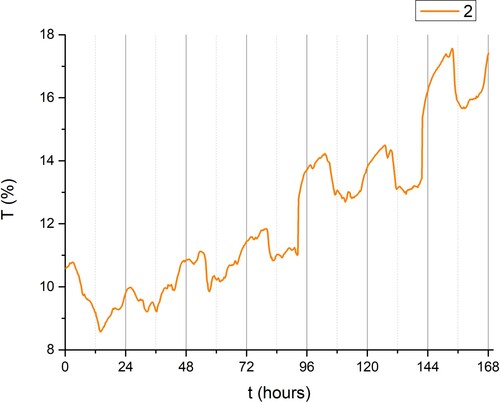
Figure 4. Variation of transmittance T (%) as a function of time in days (started from midnight), group II (day-light).
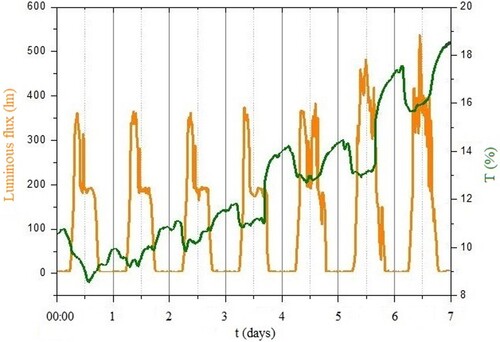
During the experimental runs, luminous flux of the plants’ illumination was also recorded.
The highest absorption coefficient was detected in plants grown in the dark conditions (Group I). The same group of plants also had the lowest value of light transmission coefficient (). It is interesting to note the sudden increase in transmission in this group was on day 6. This may indicate that the plant lost the possibility of recovery and the cell death.
Group II (day-light illumination, ) exhibits clearly defined day-night Circadian () rhythms and the transmission coefficient is lowest at noon (). This is the first experiment that presents detailed time dependence of the optical properties of plants under investigation. This could be explained by the mid-day depression in net photosynthesis (Roessel and Monson Citation1985). also suggests that during the periods of reduced illumination (e.g. in the afternoon), the value of transmission grows, reaching its highest value during the night. The overall (on one-week time scale) increase of the transmission coefficient () indicates that the leaf is getting older, suggesting that less chlorophyll is being synthesised.
Figure 5. Variation of luminous flux (left) and coefficient of transmission T (%) (right) as a function of time in days, group II (day-light).
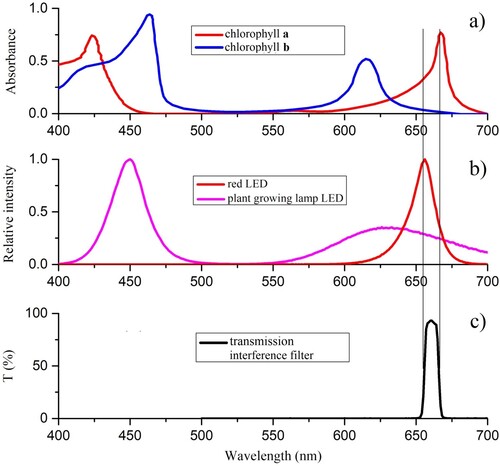
The absorption coefficient value of plants exposed to LED light only (Group III, ) was lower than that of the plants that were grown under day-light regime (group II). The possible reason for this phenomenon might be the spectral distribution of LED illumination system, as shown in .
Figure 6. Variation of transmittance T (%) as a function of time in days (started from midnight), group III (LED light).
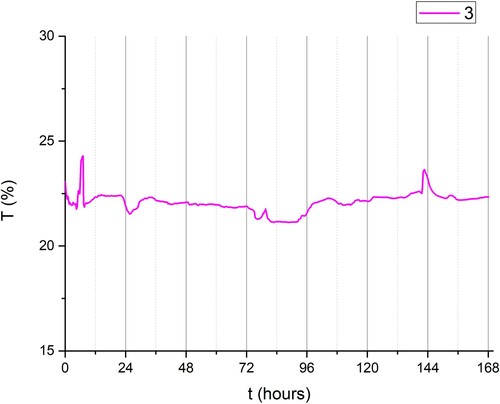
Figure 7. (a) Chlorophyll a and b absorption spectra, (b) relative emission spectra of LEDs. The curves are normalised at their respective peak intensities and (c) transmission spectra of interference filters.
Interestingly, the absorption coefficient was lowest in group IV (combined LED + day-light). The possible explanation could be the fact that those plants were over-exposed (Ruban Citation2009), i.e. the photosynthetic system was saturated with light ().
Figure 8. Variation of transmittance T (%) as a function of time in days (started from midnight), group VI (LED light) and day-light.
Absorption coefficient linearly decreased starting from group II to group IV of plants (). Similarly, the transmission coefficient was inversely proportional to time ().
Figure 9. Average sum of absorbance (right) and transmittance (left) of each group (P. vulgaris) exposed to different light regimes.
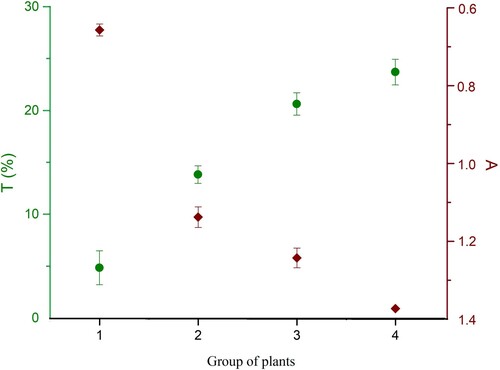
Total chlorophyll content was highest in plants grown under LED and day-light regime, while these plants had highest transmittance and lowest absorbance level. The high level of transmittance in this plant group (IV) could be explained by the leaf morphology, thin leaves. The lowest total chlorophyll was measured in plants grown under dark conditions (). The same pattern appears for total carotenoid content (). Total chlorophyll content in the plants grown under day-light regime (group II) and under LED light regime (group III) was three and five times higher, respectively, than that of the group I plants (dark conditions).
Figure 10. Total chlorophyll content of each group (P. vulgaris) exposed to different light regimes.
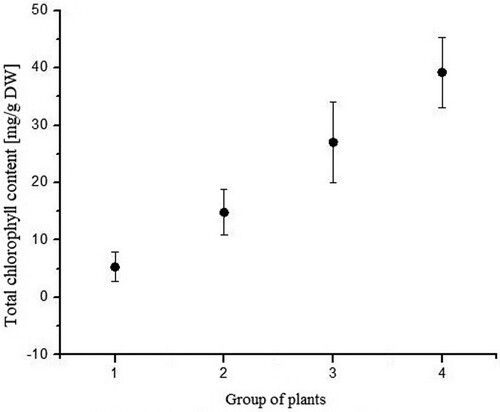
Figure 11. Total carotenoid content of each group (P. vulgaris) exposed to different light regimes.
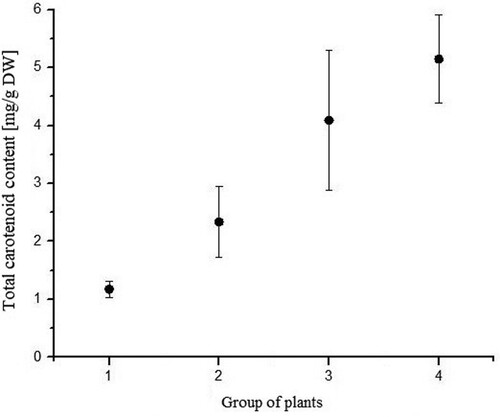
Carotenoid content was highest in plants grown under combined LED and day-light regime (). This is consistent with the fact that these plants also had lowest absorption coefficient. Carotenoid content in these plants is six times higher compared to that of group II plants (day-light regime). High carotenoid content could implicate that carotenoids took the role of protective photosynthetic apparatus (Yasushi Citation1991; Young Citation1991; Demmig-Adams et al. Citation1996; Young and Frank Citation1996) and that they actively participate in thermal-energy dissipation (). In the same group of plants (grown under combined LED and day-light regime), chlorophyll a/b ratio (Porras Citation2002) was lowest implying that those plants were exposed to stress conditions (high light intensity in this case) ().
Figure 12. Chlorophyll a/b ratio of each group (P. vulgaris) exposed to different light regimes.
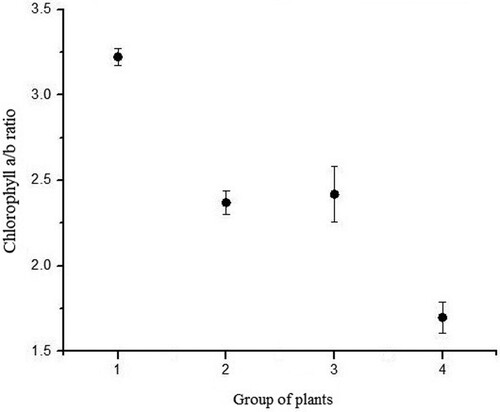
Chlorophyll a/b ratio in the plants in group II and III was the same (). However, the total chlorophyll content was almost two times higher in group III in comparison to plants from group II ().
Discussion
We have made original, experimental set-up that meets highest metrological standards. A novel instrument that enables quantitative assessment and monitoring of the optical absorption in the plants’ leaves (in real time), was described and its performance tested.
To our knowledge this is the first published time dependence of the optical transmission of the plant material. One can observe Circadian rhythms of the plant as well as long-term change (weeks) of the optical transmission during the leaves’ growth.
The instrument was tested by measuring optical properties of the P. vulgaris in a set of carefully selected growing conditions. A number of biological phenomena were observed and discussed. Monitoring the evolution of the plant activity in real-time has resulted in the graph of the spectral Circadian rhythm as a function of time. The proposed experimental technique appears to be a promising tool for the assessment of the plants’ overall condition. The presented paper is a mere proof of concept and we intend to apply the described technique on a wide range of plant species as well as to account for the wider range of biological phenomena.
Disclosure statement
No potential conflict of interest was reported by the author(s).
Additional information
Funding
Notes on contributors
Becko V. Kasalica
Becko V. Kasalica is a full professor of Faculty of Physics, University of Belgrade. His research areas are applied physics and metrology, material science, spectroscopy and optical measurements.
Katarina M. Miletic
Katarina M. Miletic is a doctoral candidate, junior research assistant of Faculty of Physics, University of Belgrade. Her research fields are biophysics, applied physics and metrology.
Aneta D. Sabovljevic
Aneta D. Sabovljevic is an associate professor of Department of plant physiology, Faculty of Biology, University of Belgrade. Her research areas are physiology and molecular biology of bryophytes, physiology of plant stress, biotechnology and genetic engineering of plants.
Milorad M. Vujicic
Milorad M. Vujicic is an assistant professor of plant molecular biology and physiology, Faculty of Biology, University of Belgrade. Milorad does research in physiology ecology and botany.
Dejan A. Jeremic
Dejan A. Jeremic is a research associate of Innovation center of Belgrade, Department of General and Inorganic chemistry. His areas of scientific interest are applied chemistry, bioinorganic chemistry, inorganic material chemistry and chemical photobiology.
Ivan D. Belca
Ivan D. Belča is a full professor and dean of the Faculty of Physics. His research fields are solid state physics, applied physics-metrology. E-mail: [email protected].
Marija M. Petkovic-Benazzouz
Marija M. Petkovic-Benazzouz is a research associate of Faculty of Physics, University of Belgrade. Her areas of scientific interest are applied physics, material science and molecular modelling.
References
- Bornman JF, Vogelmann TC. 1991. Effect of UV-B radiation on leaf optical properties measured with fibre optics. J Exp Bot. 42(4):547–554. https://doi.org/10.1093/jxb/42.4.547.
- Carter GA. 1993. Responses of leaf spectral reflectance to plant stress. Am J Bot. 80(3):239–243. https://doi.org/10.1002/j.1537-2197.1993.tb13796.x.
- Carter GA, Spiering BA. 2002. Optical properties of intact leaves for estimating chlorophyll concentration. J Environ Qual. 31(5):1424–1432. https://doi.org/10.2134/jeq2002.1424.
- Chaerle L, Leinonen I, Jones HG, Van der Straeten D. 2007. Monitoring and screening plant populations with combined thermal and chlorophyll fluorescence imaging. J Exp Bot. 58:773–784. https://doi.org/10.1093/jxb/erl257.
- Chaerle L, Van der Straeten D. 2000. Imaging techniques and the early detection of plant stress. Trends Plant Sci. 5:495–501.
- Combes D, Bousquet L, Jacquemoud S, Sinoquet H, Varlet-Grancher C, Moya I. 2007. A new spectrogoniometer to measure leaf spectral and directional optical properties. Remote Sens Environ. 109:107–117. https://doi.org/10.1016/j.rse.2006.12.007.
- Demmig-Adams B, Gilmore AM, Adams WW. 1996. In vivo functions of carotenoids in higher plants. FASEB J. 10:403–413. doi: 10.1096/fasebj.10.4.8647339.
- Ferl R, Wheeler R, Levine HG, Paul AL. 2002. Plants in space. Curr Opin Plant Biol. 5:258–263. https://doi.org/10.1016/S1369-5266(02)00254-6.
- Fourty T, Baret F, Jacquemoud S, Schmuck G, Verdebout J. 1996. Leaf optical properties with explicit description of its biochemical composition: direct and inverse problems. Remote Sens Environ. 56(2):104–117. https://doi.org/10.1016/0034-4257(95)00234-0.
- Gitelson AA, Zur Y, Chivkunova OB, Merzlyak MN. 2002. Assessing carotenoid content in plant leaves with reflectance spectroscopy. Photochem Photobiol. 75(3):272–281. https://doi.org/10.1562/0031-8655(2002)0750272ACCIPL2.0.CO2.
- Grant L. 1987. Diffuse and specular characteristics of leaf reflectance. Remote Sens Environ. 22:309–322. https://doi.org/10.1016/0034-4257(87)90064-2.
- Grant L, Daughtry CST, Vanderbilt VC. 1993. Polarized and specular reflectance variation with leaf surface features. Physiol Plantarum. 88:1–9. https://doi.org/10.1111/j.1399-3054.1993.tb01753.x.
- Knapp AK, Carter GA. 1998. Variability in leaf optical properties among 26 species from a broad range of habitats. Am J Bot. 85(7):940–946. https://doi.org/10.2307/2446360.
- Lichtenthaler HK. 1987. Chlorophylls and carotenoids: pigments of photosynthetic biomembranes. Meth Enzymol. 148:350–382. Plant Cell Membranes. Academic Press. https://doi.org/10.1016/0076-6879(87)48036-1.
- Liew O, Chong P, Li B, Asundi A. 2008. Signature optical cues: emerging technologies for Monitoring plant health. Sensors. 8(5):3205–3239. https://doi.org/10.3390/s8053205.
- Piekarczyk J. 2001. Temporal variation of the winter rape crop spectral characteristics. Int Agrophys. 15(2):101–107.
- Porra RJ. 2002. The chequered history of the development and use of simultaneous equations for the accurate determination of chlorophylls a and b. Photosynth Res. 73(1):149–156. https://doi.org/10.1023/A:1020470224740.
- Roessel PG, Monson RK. 1985. Midday depression in net photosynthesis and stomatal conductance in Yucca Glauca: relative contributions of leaf temperature and leaf-to-air water vapor concentration difference. Oecologia. 67(3):380–387.
- Ruban AV. 2009. Mini review plants in light. Commun Integr Biol. 2(1):50–55.
- Socaciu C. 2007. Food colorants: chemical and functional properties. CRC Press. https://doi.org/10.1201/9781420009286.
- Taiz L, Zeiger E. 2003. Plant physiology, 3rd ed. Ann Bot. 91(6):750–751. https://doi.org/10.1093/aob/mcg079.
- Tilman D. 1999. Global environmental impacts of agricultural expansion: the need for sustainable and efficient practices. Proc Natl Acad Sci USA. 96(11):5995–6000. https://doi.org/10.1073/pnas.96.11.5995.
- Vogelmann TC. 1993. Plant tissue optics. Annu Rev Plant Phys. 44:231–251. https://doi.org/10.1146/annurev.pp.44.060193.001311.
- Vogelmann TC, Knapp AK, McClean TM, Smith WK. 1988. Measurement of light within thin plant tissues with fibre optic microprobes. Physiol Plantarum. 72:623–630. https://doi.org/10.1111/j.1399-3054.1988.tb09173.x.
- Yamada N, Fujimura S. 1988. A mathematical model of reflectance and transmittance of plant leaves as a function of chlorophyll pigment content. Proceedings of the International geoscience and Remote Sensing symposium; Edinburgh, Scotland. p. 833–834. doi: 10.1109/IGARSS.1988.570450.
- Yasushi K. 1991. Structures and functions of carotenoids in photosynthetic systems. J Photochem Photobiol Ser Biol. 9:265–280. https://doi.org/10.1016/1011-1344(91)80165-E.
- Young AJ. 1991. The photoprotective role of carotenoids in higher plants. Physiol Plant. 83(4 ):702–708. https://doi.org/10.1111/j.1399-3054.1991.tb02490.x.
- Young AJ, Frank HA. 1996. Energy transfer reactions involving carotenoids: quenching of chlorophyll fluorescence. J Photochem Photobiol B: Biol. 36:3–15. https://doi.org/10.1016/S1011-1344(96)07397-6.