
ABSTRACT
Genetic diversity is key for breeding population development, hybrid breeding, heterotic grouping and genetic analysis, among others. The objective of this study was to examine genetic interrelationships among elite sorghum genotypes bred for resistance to Striga hermonthica Del. Benth and S. asiatica (L.) Kuntze and compatible with a biological control agent Fusarium oxysporum f. sp. strigae (FOS) against Striga using 22 polymorphic simple sequence repeat (SSR) or microsatellite markers. The number of alleles per locus detected by the markers varied from 2 to 7 with a mean value of 4.23. The polymorphic information content (PIC) of the SSR markers ranged from 0.15 to 0.84 with a mean of 0.57 showing moderate discriminatory power of the primers. The neighbour-joining clustering algorithm classified the genotypes into three main groups, revealing narrow to moderate variations existing among the test genotypes. Overall, the genetic diversity revealed by the study will be useful for designed crosses and pyramiding of broad-based resistance genes to control Striga for sustainable sorghum production.
Introduction
In sub-Saharan Africa (SSA), sorghum (Sorghum bicolor [L.] Moench, 2n = 2x = 20) is one of the key food security crops supporting over 500 million people (Hariprasanna and Rakshit, Citation2016). However, sorghum productivity in the region is very low with a mean grain yield of 0.8 t ha−1 compared with world average of 7 t ha−1. This disparity is attributed to several biotic, abiotic, and socio-economic constraints. The parasitic weed species belonging to genera Striga are among the major constraints to cereal crops production in SSA. Striga causes substantial yield losses amounting to over 7 billion dollars annually (Ejeta and Gressel, Citation2007). Striga species are root parasites that devour nutrients and water from their hosts leading to substantial yield losses and often causing crop failure in sorghum depending on cultivar susceptibility (Ejeta, Citation2007). Total yield losses are common especially when Striga infestation occurs in conjunction with drought.
Striga species complete most of their developmental phases (e.g. germination, haustorial development, attachment, and vascular penetration) underground. The parasites have a high fecundity rate producing more than 50,000 viable seeds per plant in a short reproductive cycle. In S.S.A., smallholder farms have smaller agricultural lands with poor soil fertility which are conducive to the proliferation of the parasite. The foregone conditions hinder the effectiveness of most control options. Improving soil fertility through the use of organic and inorganic fertilisers are recommended for controlling Striga emergence and damage severity (Hearne, Citation2009; Souri and Hatamian, Citation2019). However, most farmers with Striga affected agricultural lands live in abject poverty and cannot afford to purchase inorganic fertilisers and often do not have sizeable herds of livestock to obtain sufficient kraal manure. Hence, the use of host resistance is arguably the most economical, environmentally friendly, and readily deployable control option in Striga affected agro-ecologies. Striga resistance mechanisms are classified into two phases namely pre- and post-attachment (Timko and Scholes, Citation2013). Pre- and post-attachment resistance mechanisms are associated with low production of Striga germination stimulant, low production of haustorial initiation factors (LHF), incompatible response (IR) and hypersensitive response (HR) (Ejeta and Gressel, Citation2007). Combining both resistance mechanisms into a single genotype is an overriding consideration for Striga resistance breeding.
In recent years, limited sorghum cultivars bred for resistance to Striga have become available to farmers through research and development by public and private sorghum research programmes (Rubiales, Citation2003). As part of this initiative, the African Center for Crop Improvement (ACCI) designed host resistance and a biological control option for an integrated Striga management strategy. This is based on the synergistic effect of host resistance and a biological control agent Fusarium oxysporum f.sp. strigae (FOS) (Rebeka et al., Citation2013; Mrema et al., Citation2017a). Unlike the conventional Striga resistance breeding based on selection against a single Striga species, the ACCI’s resistance breeding approach was based on sorghum breeding against both S. hermonthica and S. asiatica.
Recently, sorghum lines expressing field resistance to the two dominant parasitic species and compatibility to FOS were bred in Tanzania and South Africa (Mrema et al., Citation2017b; Mrema et al., Citation2020). Effective utilisation of these novel genetic resources as parental stocks in existing Striga resistance breeding programmes require an understanding of their genetic relationships to identify complementary breeding lines for breeding population development or gene pyramiding. Genetic classification allows for the full exploitation of breeding lines derived from varied sources. The establishment of a breeding population starts with classifying germplasm based on their genetic interrelationships using molecular markers. Simple sequence repeat (SSR) markers have been extensively used for the evaluation of genetic diversity in several crops including sorghum (Yusuf et al., Citation2018; Danquah et al., Citation2019), rice (Gasim et al., Citation2019; Suvi et al., Citation2020), wheat (Tekeu et al., Citation2017; Abbasov et al., Citation2018) and maize (Shayanowako et al., Citation2018; Adu et al., Citation2019). The wide use of SSR markers in genetic diversity studies is attributed to their abundance, co-dominance and multi-allelic nature (Powell et al., Citation1996). The SSRs are highly polymorphic and have been found to be comparable to single nucleotide polymorphisms in genetic diversity analysis (Yelome et al., Citation2018). Hence, the objective of this study was to determine the genetic interrelationships existing among elite sorghum genotypes with resistance to S. hermonthica and S. asiatica and compatibility to a biocontrol agent (FOS) against Striga using diagnostic SSR markers.
Materials and methods
Plant materials
The study used 12 elite sorghum genotypes acquired from the African Centre for Crop Improvement (ACCI)/South Africa, Pannar South Africa and Agricultural Research Council/South Africa (). The ACCI genotypes are at the F7 generation and were selected based on their notable resistance against the two dominant Striga species and for showing compatibility with FOS. The procedure for developing these genotypes was described in detail by (Mrema et al., Citation2017b; Mrema et al., Citation2020).
Table 1 . List and sources of sorghum genotypes used in the study.
DNA extraction and genotyping
Leaf tissues were sampled from four-week-old seedlings and genomic DNA extracted using
the CTAB protocol (Porebski et al., Citation1997). Approximately 200 mg of ground leaf tissue combined with 500 μL of CTAB buffer, was incubated for one hour at 65°C, and centrifuged at 3500 rpm for 10 min. The supernatant was then transferred into new micro-tubes, and 400-μl chloroform:iso-amyl alcohol (24:1) was added into the tubes and mixed gently. After a second centrifugation (at 3500 rpm for 30 min), the DNA was precipitated from the aqueous layer by the addition of salt and ethanol. The upper aqueous phase containing DNA was transferred to a clean microfuge tube. The resulting pellet was dried and re-suspended in TE buffer. DNA quality and concentration were measured using Nanodrop® ND-1000 spectrophotometer (Nanodrop Products, DE, USA), and the DNA solution was then adjusted to a concentration of 10 ng/μl as templates for PCR. Genotyping was done following a standard PCR procedure (CIMMYT, Citation2005) using microsatellites selected being diagnostic markers and based on their distribution across the sorghum chromosomes. The markers were widely used in sorghum diversity analysis (Lakshmidevi et al., Citation2012; Ramu et al., Citation2013; Ali et al., Citation2016). The list of makers used, and their forward and reverse primer sequences are presented in . DNA samples were then electrophoresed on an ABI-3730 automatic DNA sequencer. The amplified DNA fragments were recorded on an excel spreadsheet as the fragment sizes in base pairs.
Table 2 . The 22 SSR markers with forward and reverse primer combinations were used in the study.
Data analysis
Genetic diversity analyses were performed using GenAlex version 6.5 (Peakall and Smouse, Citation2012). The following genetic diversity parameters were estimated; the total number of alleles per locus (Na), number of effective alleles per locus (Ne), observed heterozygosity (Ho), expected heterozygosity (He) and fixation index (FIS) (Nei, Citation1978). The polymorphic information content (PIC) was estimated according to Smith et al. (Citation1997) as; where, pi is the frequency of the ith allele. The genetic distance matrix was used to create a dendrogram based on the neighbour-joining method using the software Darwin 6.0.5 (Perrier and Jacquemoud-Collet, Citation2006) to visualise the relationships among accessions and the pattern of clusters within and among populations. Also, a principal coordinate analysis (PCoA) was performed to complement clustering revealed by the dendrogram. In order to estimate the genetic distances among sorghum genotypes, the dissimilarity matrix was computed through Euclidean method using GenAlex version 6.5 (Peakall and Smouse, Citation2012).
Results
Banding pattern and polymorphism of SSR markers
The results of genetic diversity parameters for the 22 SSR markers are presented in . The number of alleles varied from 2 to 7 with a mean of 4.23. The number of effective alleles (Ne) varied from 1 for primer XmsbCIR347 to 6 for Xtxp080 with a mean of 2 per locus. The observed heterozygosity (Ho) ranged from 0.00 (Xtxp262, XmsbCIR347 and XmSbCIR329) to 0.67 (Xiabtp515) with a mean of 0.16. The expected heterozygosity (He) ranged from 0.15 (XmsbCIR347) to 0.84 (Xtxp080), with a mean of 0.57. The inbreeding coefficient (I) ranged from 0.29 (XmsbCIR347) to 1.89 (Xtxp080) with a mean of 1.10. The fixation index varied from −0.02 (Xtxp317) to 1.00 (Xtxp262, XmsbCIR347 and XmSbCIR329), F value that below zero characteriSes an excess of heterozygotes. The polymorphic information content (PIC) ranged from 0.15 to 0.84 with a mean value of 0.57. In this study, 72% of the markers had a PIC value greater than 0.60 being effective diagnostic marker.
Table 3 . Genetic diversity parameters of the 22 SSR markers used in the current study.
Cluster analysis
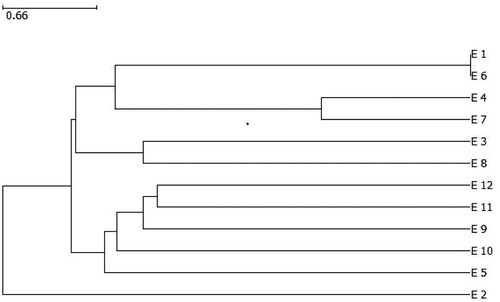
The unweighted pair group method with arithmetic mean (UPGMA) grouped the genotypes into three major clusters (i), (ii) and (iii) (). Cluster I encompassed six genotypes, all of which were Striga resistant sorghum lines from the African Centre for Crop Improvement. Cluster II had two sub-clusters: sub-cluster 1 that contained E1 (105 × 654), E6 (3484 × 424), E4 (675 × 630) and E7 (3984 × 630) and sub-cluster 2 consisted of two genotypes E3 (105 × 672) and E8 (AS426 × 672). Cluster II comprised of 5 genotypes that are registered cultivars. Cluster III consisted of one genotype E2 (672), which was a breeding line from the ACCI.
Figure 1. Dendrogram showing the genetic relationship of 12 sorghum genotypes using 22 SSR markers.
Principal coordinate analysis
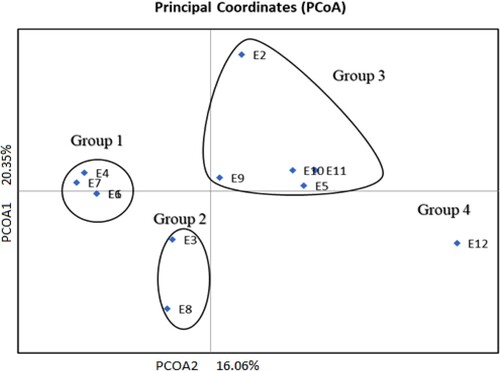
The population structure of the test genotypes estimated by Eigen values is presented in . In the figure, the point coordinates of a given genotype constitute the values of the first and second principal components. Three groups containing elite sorghum lines and the checks can be distinguished in . Group 1 consisted of E4 (675 × 630), E7 (3984 × 630), E6 (3484 × 424) and E1 (105 × 654). Group 2 was comprised of genotypes E8 (AS426 × 672) and E3 (105 × 672). The genotypes within these two groups have common parentage. Group 3 consisted of mainly check cultivars and parental line E2 (672). Most of the genotypes within this group are unrelated. However, a high degree of genetic similarity is observed among E5 (AS436), E10 (AS1) and E11 (PAN 8816). Then group 4 consisted of the check E12 (SS49).
Figure 2. Principal coordinate analysis of the 12 sorghum genotypes using 22 SSR markers.
Genetic dissimilarity and distance analysis among sorghum genotypes
Genetic distance estimates on the test sorghum genotypes are presented in . Genetic distance varied from 0.00 to 7.10 with a mean of 5.50. The genetic distance of 0.0 between E1 and E6 indicates a similarity between the two genotypes, while 7.1 between E2 and E6 show wide genetic divergence.
Table 4 . Genetic distance based on the fragment matrix among 12 sorghum genotypes used in the study.
Discussion
Microsatellites or simple sequence repeats are valuable genomic resources that have been widely used in genetic diversity analysis of various traits in sorghum (Disasa et al., Citation2018; Danquah et al., Citation2019). Simple sequence repeats are composed of DNA sequence motif of 2–6 bases (Flamingh et al., Citation2014), which offer a high level of reproducibility, accuracy, discrimination and polymorphism. Microsatellites are abundant, uniformly distributed, codominant, and rapidly produced by PCR providing quality outputs. In the present study, 22 diagnostic SSR markers were employed for 12 sorghum genotypes with variable resistance to Striga and compatibility to FOS. The number of alleles per locus varied from 2 and 7, with a mean of 4.22 (). These results were similar to those reported by Danquah et al. (Citation2019) among a collection of Ghanaian and Malian sorghum accessions. In addition, Ng'uni et al. (Citation2011) reported an average allelic count of 4.40 among Zambian sorghum accessions using 10 SSR markers. However, Cuevas and Prom (Citation2013) and Galyuon et al. (Citation2016) reported a high mean of allele per locus of 14 and 6.2, respectively. The varied results among the different studies could be attributed to differences in the test sorghum genotypes and the type and number of the SSR markers used. Sorghum is predominantly a self-pollinating crop and it is likely to have a low level of heterozygosity among sampled genotypes. In the current study, the mean heterozygosity of the 12 sorghum genotypes was 0.16, suggesting that 90% of the loci were fixed and had an acceptable level of homozygosity. Similar results were reported by Mangena et al. (Citation2018), among 18 sweet sorghum genotypes. The mean inbreeding coefficient of 1.1 confirms the level of homozygosity found in the current study (). The present study found a mean gene diversity (He) of 0.57 which was similar to that reported by Amelework et al. (Citation2015), and higher than that reported by Motlhaodi et al. (Citation2014) and Thudi and Fakrudin (Citation2011). Low heterozygosity values of 0.04 were also reported by Muui et al. (Citation2016) among Kenyan sorghum landraces. The moderately high gene diversity was an indication of the existence of genetic diversity among the presently bred Striga resistant genotypes, which will be useful for Striga resistance breeding. The polymorphism information content (PIC) determines the informativeness of the SSR primers used. PIC values varied from 0.15 to 0.84 with a mean value of 0.57 (). This suggests that the markers used in the study were diagnostic and informative. SSR markers Xtxp080 and Xtxp298 were the most informative markers with PIC values of 0.84 and 0.81, respectively. Markers with higher PIC values are valuable in quantifying diversity among alleles and are important in testing genetic diversity (Andersen and Lübberstedt, Citation2003). These results corroborate previous findings on genetic diversity studies (Smith et al., Citation2000; Amelework et al., Citation2015).
Cluster analysis () and principal coordinate analysis () demarcated the genetic interrelationship among the tested sorghum genotypes. The dendrogram showed that all the genotypes were grouped into three clusters (). From the cluster analysis, it can be observed that sorghum genotypes with common parentage clustered together except line 672. The clustering of advanced lines with Striga resistance together could be a result of common parentage when breeding the elite lines. The principal coordinate analysis clustered the genotypes into four groups (). The principal coordinate analysis group the advanced lines for Striga resistance in group 1 and group 2 except E2 (672) while the check cultivars in group 3 except E12 which was the only in group 4. To a larger extent, the genetic grouping can be attributed to shared parents. The Striga resistant lines were highly differentiated compared with the standard check cultivars. Thus, the elite sorghum lines are genetically unique and can be recommended for further hybrid breeding or population development programmes. Striga resistance is conditioned by polygenes (Mrema et al., Citation2017b) predominantly consisting of recessive genes with additive genetic effect (Ejeta, Citation2007). Hence, it is important that candidate parents need to be homozygous for Striga resistance genes to ensure the heritability and stability of resistance in the progeny generation.
In this study, the genotypes E1 (105 × 654) and E6 (3484 × 424) and E4 (675 × 630) and E7 (3984 × 630) displayed the lowest genetic distance, while E1 (105 × 654) and E2 (672), and E2 (672) and E6 (3484 × 424) (7.1) exhibited the highest genetic distance and were grouped into different clusters ( and ). The range of genetic distance in this study is lower than the values 3.61 and 8.06 among 17 sorghum accessions examined from different regions in Sudan (El-Amin and Hamza, Citation2012). In addition, a genetic distance estimate varying from 0 to 8.4 was reported by Mofokeng et al. (Citation2014) from a diverse population of sorghum landraces widely cultivated in South Africa.
Conclusion
Knowledge of the genetic interrelationship amongst Striga resistance sorghum genotypes is important for current and future breeding programmes. The tested SSR loci detected 2–7 alleles per locus with a mean of 4.22. Most of the markers used in the present study had a PIC value greater 0.60 suggesting their utility in future genetic diversity studies. The SSR also grouped the 12 sorghum genotypes into three genetic clusters. There was a clear genetic demarcation between elite lines and the check cultivars suggesting the new sorghum genotypes possessing unique gene combinations. Genetically distant genotypes were identified such as E1 (105 × 654), E2 (672) and E5 (AS436). These genotypes could be recommended for further stability evaluation and release or used as parental lines in Striga resistance breeding programmes in sorghum.
Acknowledgements
The Technology Innovation Agency (TIA) is gratefully acknowledged for providing financial support for this study.
Disclosure statement
No potential conflict of interest was reported by the author(s).
Additional information
Notes on contributors
Athenkosi Makebe
Athenkosi Makebe is a Ph.D. fellow in Plant Breeding at the University of KwaZulu-Natal in South Africa. He is the main author of the current study.
Hussein Shimelis
Prof. Hussein Shimelis is a Professor of Plant Breeding at the University of KwaZulu-Natal in South Africa. He is a co-author for the current study.
Admire I. T. Shayanowako
Dr. Admire Isaac Tichafa Shayanowako is a Post-Doctoral Research Fellow in Plant Breeding at the African Centre for Crop Improvement (ACCI), University of KwaZulu-Natal in South Africa. He is a co-author for the current study.
References
- Abbasov M, Akparov Z, Gross T, Babayeva S, Izzatullayeva V, Hajiyev E, Rustamov K, Gross P, Tekin M, Akar T. 2018. Genetic relationship of diploid wheat (Triticum spp.) species assessed by SSR markers. Genet Resour Crop Evol. 65:1441–1453. doi:10.1007/s10722-018-0629-2.
- Adu G, Awuku F, Amegbor I, Haruna A, Manigben K, Aboyadana P. 2019. Genetic characterization and population structure of maize populations using SSR markers. Ann Agric Sci. 64:47–54. doi:10.1016/j.aoas.2019.05.006.
- Ali R, Hash CT, Damris O, Elhussein A, Mohamed AH. 2016. Introgression of Striga resistance into popular Sudanese sorghum varieties using marker assisted selection. World J Microbiol Biotechnol. 1:48–55.
- Amelework B, Shimelis H, Tongoona P, Laing M, Mengistu F. 2015. Genetic variation in lowland sorghum (Sorghum bicolor (L.) Moench) landraces assessed by simple sequence repeats. Plant Genet Resour. 13:131–141. doi:10.1017/S1479262114000744.
- Andersen JR, Lübberstedt T. 2003. Functional markers in plants. Trends Plant Sci. 8:554–560. doi:10.1016/j.tplants.2003.09.010.
- CIMMYT. 2005. Laboratory protocols: CIMMYT Applied Molecular Genetics Laboratory. Mexico, D.F.: CIMMYT.
- Cuevas HE, Prom LK. 2013. Assessment of molecular diversity and population structure of the Ethiopian sorghum [Sorghum bicolor (L.) Moench] germplasm collection maintained by the USDA–ARS national Plant germplasm system using SSR markers. Genet Resour Crop Evol. 60:1817–1830. doi:10.1007/s10722-013-9956-5.
- Danquah A, Galyuon IK, Otwe EP, Asante DK. 2019. Genetic diversity in some Ghanaian and Malian sorghum [Sorghum bicolor (L) Moench] accessions using SSR markers. Afr J Biotechnol. 18:591–602. doi:10.5897/AJB2019.16767.
- de Flamingh A, Sole CL, van Aarde RJ. 2014. Microsatellite repeat motif and amplicon length affect amplification success of degraded faecal DNA. Conserv Genet Resour. 6:503–505. doi:10.1007/s12686-014-0160-5.
- Disasa T, Feyissa T, Admassu B, Fetene M, Mendu V. 2018. Mapping of QTLs associated with brix and biomass-related traits in sorghum using SSR markers. Sugar Tech. 20:275–285. doi:10.1007/s12355-018-0590-6.
- Ejeta G, Gressel J. 2007. Integrating new technologies for Striga control: towards ending the witch-hunt. Singapore: World Scientific.
- Ejeta G. 2007. Breeding for Striga resistance in sorghum: exploitation of an intricate host–parasite biology. Crop Sci. 47:S-216–S-227. doi:10.2135/cropsci2007.04.0011IPBS.
- El-Amin H, Hamza NB. 2012. Phylogenetic diversity of Sorghum bicolor (L.) Moench accessions from different regions in sudan. Am J Biochem Mol Biol. 3:127–134..
- Galyuon IK, Madhusudhana R, Borrell AK, Hash TC, Howarth CJ. 2016. Genetic diversity of stay-Green sorghums and their derivatives revealed by microsatellites. Afr J Biotechnol. 15:1363–1374. doi:10.5897/AJB2015.15074.
- Gasim S, Abuanja I, Abdalla A-W. 2019. Genetic diversity of rice (Oryza sativa L.) accessions collected from Sudan and IRRI using SSR markers. Afr J Agric Res. 14:143–150. doi:10.5897/AJAR2018.13554.
- Hariprasanna K, Rakshit S. 2016. Economic importance of sorghum. In: Rakshit, S, Wang, YH., editor. The sorghum genome. Cham: Springer; p. 1–25.
- Hearne SJ. 2009. Control – the Striga conundrum. Pest Manage Sci. 65:603–614. doi:10.1002/ps.1735.
- Lakshmidevi G, Janila P, Anuradha G, Shivashankar A. 2012. Validation of foreground and background SSR markers for introgression of QTL governing leaf glossiness into a sorghum variety-NTJ 2. Indian J Genet Plant Breed. 72:376–379.
- Mangena P, Shimelis HA, Laing MD, Beyene AA. 2018. Genetic interrelationship of sweet stem sorghum genotypes assessed with simple sequence repeat markers. S Afr J Plant Soil. 35:351–358. doi:10.1080/02571862.2018.1446224.
- Mofokeng A, Shimelis H, Tongoona P, Laing M. 2014. A genetic diversity analysis of South African sorghum genotypes using SSR markers. S Afr J Plant Soil. 31:145–152. doi:10.1080/02571862.2014.923051.
- Motlhaodi T, Geleta M, Bryngelsson T, Fatih M, Chite S, Ortiz R. 2014. Genetic diversity in ‘ex-situ’ conserved sorghum accessions of Botswana as estimated by microsatellite markers. Aust J Crop Sci. 8:35.
- Mrema E, Shimelis H, Laing M, Bucheyeki T. 2017a. Screening of sorghum genotypes for resistance to Striga hermonthica and S. asiatica and compatibility with Fusarium oxysporum f. sp. strigae. Acta Agric Scand B Soil Plant Sci. 67:395–404.
- Mrema E, Shimelis H, Laing M. 2017b. Genetic effect of Striga resistance in sorghum genotypes. Euphytica. 213:280. doi:10.1007/s10681-017-2073-3.
- Mrema E, Shimelis H, Laing M. 2020. Combining ability of yield and yield components among Fusarium oxysporum f. sp. strigae-compatible and Striga-resistant sorghum genotypes. Acta Agric Scand B Soil Plant Sci. 70:95–108.
- Muui CW, Muasya RM, Kirubi DT, Runo SM, Karugu A. 2016. Genetic variability of sorghum landraces from lower eastern Kenya based on simple sequence repeats (SSRs) markers. Afr J Biotechnol. 15:264–271. doi:10.5897/AJB2015.14680.
- Nei M. 1978. Estimation of average heterozygosity and genetic distance from a small number of individuals. Genetics. 89:583–590.
- Ng'uni D, Geleta M, Bryngelsson T. 2011. Genetic diversity in sorghum (Sorghum bicolor (L.) Moench) accessions of Zambia as revealed by simple sequence repeats (SSR). Hereditas. 148:52–62. doi:10.1111/j.1601-5223.2011.02208.x.
- Peakall P, Smouse R. 2012. Genalex 6.5: genetic analysis in excel. Population genetic software for teaching and research – an update. Bioinformatics. 28:2537–2539. doi:10.1093/bioinformatics/bts460.
- Perrier X, Jacquemoud-Collet J. 2006. DARwin software: Dissimilarity analysis and representation for windows. [accessed 2013 March 1]. http://darwin.cirad.fr/darwin.
- Porebski S, Bailey LG, Baum BR. 1997. Modification of a CTAB DNA extraction protocol for plants containing high polysaccharide and polyphenol components. Plant Mol Biol Rep. 15:8–15.
- Powell W, Morgante M, Andre C, Hanafey M, Vogel J, Tingey S, Rafalski AJMB. 1996. The comparison of RFLP, RAPD, AFLP and SSR (microsatellite) markers for germplasm analysis. Mol Breed. 2:225–238.
- Ramu P, Billot C, Rami J-F, Senthilvel S, Upadhyaya H, Reddy LA, Hash CT. 2013. Assessment of genetic diversity in the sorghum reference set using EST-SSR markers. Theor Appl Genet. 126:2051–2064. doi:10.1007/s00122-013-2117-6.
- Rebeka G, Shimelis H, Laing MD, Tongoona P, Mandefro N. 2013. Evaluation of sorghum genotypes compatibility with Fusarium oxysporum under Striga infestation. Crop Sci. 53:385–393. doi:10.2135/cropsci2012.02.0101.
- Rubiales D. 2003. Parasitic plants, wild relatives and the nature of resistance. New Phytol. 160:459–461. doi:10.1046/j.1469-8137.2003.00929.x.
- Shayanowako A, Shimelis H, Laing M, Mwadzingeni L. 2018. Genetic diversity of maize genotypes with variable resistance to Striga asiatica based on SSR markers. Cereal Res Commun. 46:668–678. doi:10.1556/0806.46.2018.044.
- Smith J, Chin E, Shu H, Smith O, Wall S, Senior M, Mitchell S, Kresovich S, Ziegle T. 1997. An evaluation of the utility of SSR loci as molecular markers in maize (Zea mays L.): comparisons with data from RFLPs and pedigree. Theor Appl Genet. 95:163–173. doi:10.1007/s001220050544.
- Smith J, Kresovich S, Hopkins M, Mitchell S, Dean R, Woodman W, Lee M, Porter K. 2000. Genetic diversity among elite sorghum inbred lines assessed with simple sequence repeats. Crop Sci. 40:226–232. doi:10.2135/cropsci2000.401226x.
- Souri MK, Hatamian M. 2019. Aminochelates in plant nutrition: a review. J Plant Nutr. 42:67–78. doi:10.1080/01904167.2018.1549671.
- Suvi WT, Shimelis H, Laing M, Mathew I, Shayanowako AIT. 2020. Assessment of the genetic diversity and population structure of rice genotypes using SSR markers. Acta Agric Scand B Soil Plant Sci. 70:76–86.
- Tekeu H, Ngonkeu EM, Djocgoue FP, Ellis A, Lendzemo V, Springfield L, Moulin L, Klonowska A, Diouf D, Botes WC. 2017. Genetic diversity of Cameroonian bread wheat (Triticum aestivum L.) cultivars revealed by microsatellite markers. Afr J Biotechnol. 16:1832–1839. doi:10.5897/AJB2017.16090.
- Thudi M, Fakrudin B. 2011. Identification of unique alleles and assessment of genetic diversity of rabi sorghum accessions using simple sequence repeat markers. J Plant Biochem Biotechnol. 20:74–83. doi:10.1007/s13562-010-0028-z.
- Timko MP, Scholes JD. 2013. Host reaction to attack by root parasitic plants in parasitic orobanchaceae. Berlin, Heidelberg: Springer.
- Yelome OI, Audenaert K, Landschoot S, Dansi A, Vanhove W, Silue D, Van Damme P, Haesaert G. 2018. Analysis of population structure and genetic diversity reveals gene flow and geographic patterns in cultivated rice (O. sativa and O. glaberrima) in West Africa. Euphytica. 214:215. doi:10.1007/s10681-018-2285-1.
- Yusuf Z, Petros Y, Ararsa K. 2018. Genetic diversity of sorghum (sorghum bicolor L. Moench) from East and West hararghe zones of oromia regional state, Ethiopia, based on SSR markers. World J. Agric. Res. 5:132–140.