
 ?Mathematical formulae have been encoded as MathML and are displayed in this HTML version using MathJax in order to improve their display. Uncheck the box to turn MathJax off. This feature requires Javascript. Click on a formula to zoom.
ABSTRACT
Prediction models for crude protein concentration (CP) in winter wheat (Triticum aestivum L.) based on multispectral reflectance data from field trials in 2019 and 2020 in southern Sweden were developed and evaluated for independent trial sites. Reflectance data were collected using an unpiloted aerial vehicle (UAV)-borne camera with nine spectral bands having similar specification to nine bands of Sentinel-2 satellite data. Models were tested for application on near-real time Sentinel-2 imagery, on the prospect that CP prediction models can be made available in satellite-based decision support systems (DSS) for precision agriculture. Two different prediction methods were tested: linear regression and multivariate adaptive regression splines (MARS). Linear regression based on the best-performing vegetation index (the chlorophyll index) was found to be approximately as accurate as the best performing MARS model with multiple predictor variables in leave-one-trial-out cross-validation (R2 = 0.71, R2 = 0.70 and mean absolute error 0.64%, 0.60% CP respectively). Models applied on satellite data explained to a small degree between-field variations in CP (R2 = 0.36), however did not reproduce within-field variation accurately. The results of the different methods presented here show the differences between methods used and their potential for application in a DSS.
Introduction
Grain crude protein concentration (CP) is an important baking quality indicator in bread wheat (Triticum aestivum L.). The quantity and also quality, of CP (primarily the proteins glutenin and gliadin) affect gluten formation and the physical properties of bread dough (Gooding and Davies Citation1997). In many countries, wheat grain intended for milling and baking is sold for a higher price if a certain CP threshold is exceeded. In Sweden, that threshold is often 11.5% protein on a dry matter basis. CP concentration is therefore determined on all grain deliveries, using near infrared transmittance (NIT) sensing. It is also routinely determined in grain samples from winter wheat field trials, using the same technology.
Yield maps from monitors on combine harvesters are already used as a tool for farmers to evaluate crop management and for guidance in precision management in coming seasons, e.g. by splitting fields into management zones (Mulla Citation1993; Martínez-Casasnovas et al. Citation2018; Miao et al. Citation2018). Combine harvesters equipped with NIT sensors for CP mapping during harvest are also available (as described in Taylor et al. (Citation2005) and Thylén and Algerbo (Citation2001)), however, these are not yet as widely used as the yield mapping counterpart. Field zoning based on expected CP is an alternative method. With CP estimation before harvest, there is the option to split fields into harvesting zones with different expected CP in the current year. This would provide the option to exploit the spatial heterogeneity by selling some grain loads as bread wheat for a higher price and other loads as fodder wheat. Such models could also be useful for the grain industry, providing information on available quality at harvest. For example, Freeman et al. (Citation2003) have shown how pre-harvest prediction of winter wheat grain yield and/or protein using the normalised difference vegetation index (NDVI; Rouse et al. Citation1974) could assist farmers in generating yield maps and reliable product marketing. However, the spatial pattern of CP within fields, and the relationship with for example yield, is complex and can vary substantially between years (e.g. Delin Citation2004).
Grain proteins are synthesised from nitrogen (N) that is translocated from other plant organs (50–70%) and from ongoing N-uptake during grain filling (30–50%) (Gooding Citation2009). It has been demonstrated in field trials that CP can be increased when additional N is applied in Zadok’s growth stage (Zadok et al. Citation1974) DC37 or later (Finney et al. Citation1957; Gooding and Davies Citation1992; Hamnér et al. Citation2017; Rodrigues et al. Citation2018; Hu et al. Citation2021. Sieling and Kage Citation2021), even though N use efficiency may be lowered by very late applications (Gooding Citation2009). If CP could be predicted from spectral reflectance data sensed by cameras mounted on UAVs, satellites, ground vehicles or handheld instruments, CP predictions could serve as decision support for late-season N fertilisation aiming at meeting certain CP targets. Bastos et al. (Citation2021) made a review of CP predictions, including remote and proximal sensing as well as on-combine sensors. They concluded that using on-combine protein measurements generated more accurate predictions than what could be achieved using proximal or remote sensing during the growing season. Prediction modelling of CP based on proximal and remote sensing data is often less successful than e.g. prediction models of yield (e.g. Freeman et al. Citation2003; Øvergaard et al. Citation2013; Barmeier et al. Citation2017). Barmeier et al. (Citation2017) used a hyperspectral field sensor in field experiments during anthesis (DC 65) in malting barley, and used partial least squares regression (PLSR) for developing prediction models of protein content. Validation was done in independent field trials, but the models performed poorly (R2 = 0.28), indicating the challenges in estimating protein content in harvested grain. Similar to Hansen et al. (Citation2002) they did not find a clear effect of nitrogen fertiliser level on protein content. Prey and Schmidhalter (Citation2019) tested a large number of vegetation indices and their correlation to grain N concentration, and found that only few parts of the electromagnetic spectrum within the visible-near infrared (NIR) region proved to be useful. Bands corresponding to around 780 nm in the lower part of the NIR region, combined with a band in the upper part of the red edge region performed best. Zhou et al. (Citation2021) compared linear regression and some machine learning (ML; Liakos et al. Citation2018) methods for CP prediction in four fields in Japan, using data from a multispectral UAV based sensor. The results showed that it was difficult to predict protein accurately, although some ML methods seemed to perform better than the linear models. Bastos et al. (Citation2021) reported that most studies on CP predictions in grain based on remote and proximal sensors probably overestimated the model accuracy and precision since the models were often not tested across different spatio-temporal scales.
Börjesson and Söderström (Citation2003) showed that the best time for making protein predictions for winter wheat and malting barley (Hordeum vulgare L.) when using spectral data from handheld sensors is at the end of anthesis (Zadok’s DC69). Basnet et al. (Citation2003) and Prey and Schmidhalter (Citation2019) also suggested that canopy reflectance derived just after anthesis are best correlated with grain protein content, and Bastos et al. (Citation2021) found that this was most commonly reported in the studies included in their review. The reason may be that it provides information on sources of N available for protein formation through late season N remobilisation to the grain (e.g. Hansen et al. Citation2002). Söderström et al. (Citation2010) demonstrated that it is possible to map CP in malting barley based on remotely sensed crop canopy reflectance together with ancillary variables. Börjesson et al. (Citation2019) demonstrated that CP prediction in winter wheat could be performed based on a combination of early (DC37) and late (DC73) satellite reflectance data. Their prediction models had mean absolute error (MAE) of <1% CP when tested on independent fields.
The seasonal dynamics of N supply, from fertilisers and from mineralisation of organic matter in the soil in relation to the dynamics of (other) yield-influencing environmental conditions, such as water availability, disease, temperature and radiation, affect the CP content in the harvested grain (see e.g. Gooding Citation2009). Small on-farm experiments (OFE; Lacoste et al. Citation2022) called zero-plots and max-plots can be used for determining optimal N fertilisation rates (see e.g. Lory and Scharf Citation2003; Raun et al. Citation2011). Zero-plots are strategically placed plots in commercial fields (often 10–100 m2) left without any N fertiliser application, which are used to monitor N-limited crop growth as a proxy for soil N supply. Max-plots are plots with an N-fertilisation level high enough for N not to limit yield, and crop growth in max-plots can be used as a proxy for potential N-uptake or potential yield (Johnson and Raun Citation2003; Piikki and Stenberg Citation2017). Since it is now relatively common to use zero-plots and sometimes also max-plots in cereal fields, it is interesting to investigate how these plots can be useful in CP prediction modelling. It has been shown, e.g. by Pettersson and Eckersten (Citation2007), that there are differences between grain crop cultivars in terms of both canopy properties (e.g. structure or albedo) that affect vegetation indices and CP levels. Thus, it is possible that cultivar-specific models would perform better than general models. On the other hand, when general models are parameterised based on all cultivars used in a field trial, the resulting larger calibration dataset may give more robust models.
Satellite-based decision support systems (DSS) can reach many farmers and cover very large areas in comparison with handheld or tractor-based sensor systems. In agricultural research, an abundance of data on crop qualities are available from field trials. Sensors carried by unpiloted aerial vehicles (UAVs) are suitable for collecting data in single fields for different crop management purposes (Du et al. Citation2017). It could be beneficial to use UAVs to collect spectral data in field trials, generate prediction models for crop properties and then apply such models on satellite images used in DSS to upscale the research results in practical implementation.
The aim of the present study was to develop and evaluate prediction models for CP at harvest in winter wheat, based on optical remote sensing data from UAV-borne multispectral sensors acquired in development stages DC69-73, in field trials. In this study we used a selection of vegetation indices based on spectral bands in the red to NIR region which in previous studies have been useful for describing the protein content (e.g. Freeman et al. Citation2003; Pettersson et al. Citation2006; Prey and Schmidhalter Citation2019). For modelling we used both linear regression and multivariate adaptive regression splines (MARS; Friedman Citation1991). MARS is a non-parametric ML method that in previous studies has been useful when dealing with remote sensing data in relatively small datasets (e.g. Filippi et al. Citation2014; Söderström et al. Citation2015). Special attention was paid to validation in order to validate on independent data. Moreover, the models developed were applied on satellite images currently used in DSSs and performance was evaluated against field observations. The following tests were carried out:
Screening for best CP modelling approach, by leave-one-trial-out cross-validation of eight different modelling approaches comprising linear regression models or MARS models with different predictors (combinations of vegetation indices in trial plots with realistic N rates and chlorophyll index in zero-plots and max-plots)
Test of cultivar-specific models, by leave-one-trial-out cross-validation
Test of models on Sentinel-2 data, by comparing predictions with CP values from grain samples collected across five fields.
Materials and methods
Sites
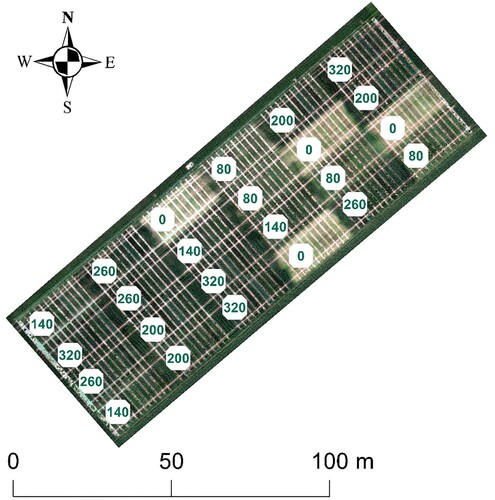
The study area was Skåne (Scania) county in southern Sweden (approx. 55–56°N, 12–14°E). Data were used from five field trials, conducted at different locations. Three of the trials were performed in 2019 (at Stora Markie, Tommarp and Alnarp) and two in 2020 (at Lund and Brantevik) (). All field trials were part of an ongoing national trial series (L7-0150, Nitrogen demand of different winter wheat cultivarsFootnote1). The winter wheat cultivars grown were different between years, and 10 different cultivars were tested in each year. Each trial had six split N treatments (the latest applied in Zadok’s development stage DC37). Total N rates were: 0, 80, 140, 200, 260 and 320 kg N ha−1. The trial was replicated four times. In total, one trial consisted of 240 plots, of approximately 2 × 10 m in size (). The focus in this study was on winter wheat cultivars intended for bread wheat, for which CP is critically important. Six bread wheat cultivars were grown in the field trials in 2019 and 2020 (cultivars: Etana, Hallfreda, Julius, Linus, Praktik and RGT Reform). The data for the satellite application were collected from five sites in the same region (A-E in ).
Figure 1. Field trial locations in Skåne (Scania) County, Sweden, and locations where satellite data were collected. Numbers (A-E) indicate locations of winter wheat field trials where trial-data were collected for testing crude protein (CP) prediction models using satellite data.
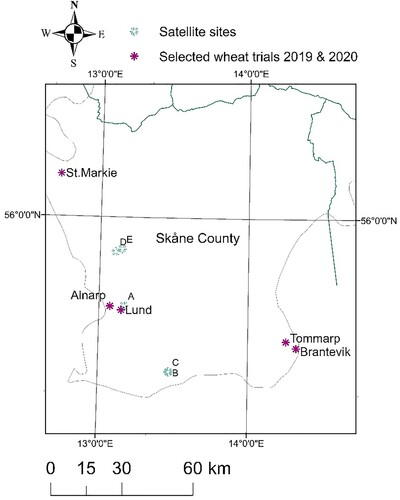
Figure 2. A field trial orthomosaic example from the unmanned aerial vehicle (UAV) sensor in Brantevik, on sensing date June 18, 2020. The different nitrogen (N) treatments are displayed in the trial blocks.
UAV measurements
Data were collected with a UAV octocopter (Explorian-8, Pitchup AB, Gothenburg, Sweden), equipped with a MAIA-S2 multispectral camera (Eoptis Srl, Trento, Italy), a global navigation satellite system (GNSS) unit and an incoming light sensor (ILS). The MAIA-S2 sensor has nine bands with centre wavelengths in the range 443–865 nm (). These bands correspond to nine of the bands in the Sentinel-2 satellite system (ESA, EU) (Nocerino et al. Citation2017).
Table 1. Band specifications of the MAIA-S2 camera used in this study. NIR = near infrared.
The UAV was flown autonomously (at 80 m height and flight speed 5 m s−1), using a pre-planned flight mission, in DC65-75, covering anthesis to medium milk development stages. Details of the flights are summarised in . The flights were mostly carried out between 12:00 and 16:30 h local time, when the solar incidence angle varied between about 40 and 55°. Each flight took about 10 minutes, during a period with uniform cloud conditions (clear sky or complete overcast), no precipitation the day before the flight, and not windier than a gentle breeze. At each trial site, 10 reflectance calibration panels (MosaicMill Oy, Vantaa, Finland) measuring 50 cm × 50 cm were placed on the ground (five along each end of the trial). These panels had known near-lambertian reflectance characteristics (2%, 9%, 23%, 44% and 75%) within the 400–900 nm range of the electromagnetic spectrum.
Table 2. Crop development stage, date, time and weather on the day of the unpiloted aerial vehicle (UAV) flights.
The UAV images were collected with at least 80% overlap both along and between flight lines. During a flight, the UAV’s position was logged using GNSS and the incoming light from the ILS was logged at each photo point. Post-processing of images was performed using Multicam Stitcher Pro 1.1 provided by the manufacturer of the MAIA-S2 sensor. This software corrects for geometrical distortion and radial distortion of the raw images and stitches the images of each of the nine bands into one multispectral image. The software also incorporates data from the ILS to radiometrically calibrate the images. The output images had pixel size of about 3 × 3 cm. Orthomosaics were created from the output images using the web application Solvi (https://solvi.ag; Solvi AB, Gothenburg, Sweden). These were downloaded and further processed in ArcGIS (ESRI Inc., Redlands, CA, USA). Using the reflectance panels, a linear function was derived to empirically recalculate the digital numbers of the orthomosaics to reflectance. The median reflectance of each band and for each trial plot was calculated (excluding a 0.2–0.3 m buffer zone along the plot edges). Data on harvested yield (kg ha−1) and protein content (CP in % of dry matter) were extracted for each plot in the Nordic Field Trials System (NFTS; https://nfts.dlbr.dk; Danish Technological Institute and SEGES, Aarhus, Denmark). CP in this dataset was determined by FOSS Infratec1241 NIT equipment (FOSS, Hillerød, Denmark). These data were combined with the UAV data for the statistical modelling and analyses.
Statistical analyses and modelling
An initial screening process revealed potential problems with the data from the flight at Alnarp. In this particular field trial there was an unusually large amount of soil nitrogen available (the zero-plot yield was about 10 tonnes ha−1) which made treatments in this trial similar and not representative for Swedish conditions, therefore this trial was excluded from analysis. In addition, two plots in the Brantevik trial and 14 plots in the Lund trial were excluded, due to missing data in the NFTS.
Plots where the applied N rate was >0 kg N ha−1 and <320 kg ha−1 were selected for model calibration and validation. The plots with 0 kg N ha−1 and 320 kg N ha−1 were denoted as zero-plots and max-plots, respectively and were not used in general modelling. A remote sensing-based vegetation index from these plots was introduced as a predictor. Reflectance values of different replicates (blocks) were averaged. The initial dataset contained 1184 records, and cleaning, treatment subsetting and block aggregation resulted in 96 records for building predictive models.
The correlations among and between predictors and CP content were explored using the Spearman correlation coefficient (r). The statistical procedures linear regression modelling (as explained in Hastie et al. Citation2009) and multivariate adaptive regression splines (MARS, Friedman Citation1991) were used in this study for building predictive models. Linear regression is a simple statistical procedure of fitting a linear model with one, or more (if multiple linear regression), predictor variables. MARS is a more flexible, non-parametric regression method which can predict using non-linear relationships with multiple predictors.
Vegetation indices
Seven vegetation indices (VIs) were calculated from the reflectance values in the different bands in the electromagnetic spectrum (). These were: (i) Optimised soil-adjusted vegetation index (OSAVI) (Huete Citation1988; Rondeaux et al. Citation1996), which was developed in an effort to minimise soil brightness influence by use of red and near-infrared (NIR) wavelengths. (ii) Red-edge inflection point (REIP), the computed wavelength where the crop canopy reflectance spectrum has its inflection point in the red-edge wavelength region, which is strongly related to chlorophyll content (Reusch Citation1997). A method to approximate this point presented by Guyot et al. (Citation1988) was used in this study. (iii) Transformed chlorophyll absorption in reflectance index (TCARI) (Kim et al. Citation1994; Haboudane et al. Citation2002), which is one of several ‘CARI’ indices and indicates the relative abundance of chlorophyll. (iv) TC/OS, a ratio introduced by Haboudane et al. (Citation2002) that is very sensitive to chlorophyll content variations and to variations in leaf area index (LAI: defined as half the total area of green elements of the canopy per unit horizontal ground area). This index is not sensitive to altitude. TC/OS has been found to show good results for protein predictions in malting barley (Pettersson et al. Citation2006). (v) Chlorophyll index (CI) (Gitelson et al. Citation2003), is another relevant simple ratio index. (vi). Normalised difference vegetation index (NDVI) (Rouse et al. Citation1974), is a very common NIR-visible-based ratio calculation introduced by Rouse et al. (Citation1974). (vii) Normalised difference red-edge index (NDRE) (Barnes et al. Citation2000) is calculated in a similar manner to NDVI and includes a red-edge band instead of a red band, making it less sensitive to saturation if biomass is high compared with NDVI.
Table 3. The seven vegetation indices used in this study, with equations and references. Reflectance is expressed in spectral bands (ρ).
The equations in show how these VIs were calculated, with reflectance (ρ) followed by the MAIA-S2 band number.
Modelling strategies
The eight modelling strategies tested () were combinations of two different model types, linear regression (a) and MARS modelling (b), and four different predictor sets (1–4). Linear regression models were based on a VI highly correlated with CP content, and MARS models were based on all seven VIs in . In some strategies, in addition to the VIs, the CI values in the zero-plots (denoted CI-zero) and/or the max-plots (denoted CI-max) were included as predictors. The index CI was pre-selected since this index was found to have the highest correlation with protein in this dataset. Irrespective of model type, the predicted values were constrained within reasonable limits. Predicted CP values below 8% were set to 8% and predicted CP values higher than 13.5% were set to 13.5%.
Table 4. The eight different modelling strategies with different model types and predictor sets tested in this study.
Model cross-validation
To assess the prediction accuracy when applying a modelling strategy to new sites, leave-one-trial-out (LTO) cross-validation was performed. Records were repeatedly split into ‘test data’ (the record(s) for which a prediction was made) and ‘training data’ (the records used to parameterise the model). With each iteration, all data from one trial were assigned to the test set and the remaining records were assigned to the training set.
To determine prediction accuracy, two validation measures (mean absolute error, coefficient of determination) were calculated from the measured and predicted N-uptake values. Mean absolute error (MAE) is the average of the absolute prediction errors. Coefficient of determination (R2) quantifies the prediction goodness-of-fit.
Model parameterisation
After LTO cross-validation, the final models were parameterised for each of the eight strategies using all data (no trials left out). In linear regression models (1a-4a in ), all predictors obtained were included in the final model, however in the parameterisation of MARS model predictors with a little predictive power were discarded. Therefore, the final model may not include all predictors. Modelling was also carried out separately for each specific cultivar in the dataset. The cultivar-specific models were validated for the best-performing strategies in the general models.
Model field application
Model application was tested for general models from strategies 1a and 1b () using satellite data for five winter wheat fields in Skåne county (locations A-E in ). These models were implemented on satellite data, Sentinel-2, L2A processing type, from June 25, 2020 (the cloud-free image expected to most closely correspond to DC 69-75). Field data were collected just before harvest in the year 2020. On each sampling location, one sample consisted of seven subsamples (for sampling stability), covering an area of approximately 3 × 3 m. There were eight samples obtained on each field. A total of 34 records remained after removal of sample points with incorrect location references, or those collected very close to field boundaries.
Software
The data were stored in a SQLserver database (Microsoft, Redmond, Washington, USA) accessed via SQL Server Management Studio (Microsoft, Redmond, Washington, USA) and analyses were carried out using R (R Core Team, Citation2021), including package ‘Earth’ (Milborrow Citation2021). ArcGIS 10.7 (Esri Inc., Redlands, California, USA) was used for spatial data analysis and display.
Results
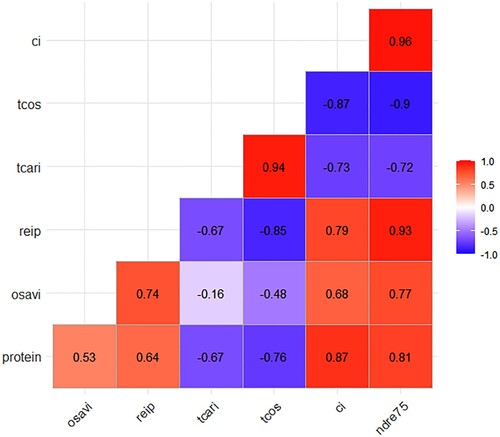
In most compiled predictor sets, there were strong correlations between variables (). For example, NDRE75 proved to be highly correlated with three other VIs, CI, TCOS and REIP. The VIs TCARI and TCOS were also very highly correlated, while TCARI and OSAVI showed very low correlation. All except two predictor pairs r was above 0.5. For the indices, the Spearman correlation ranged between −0.90 and 0.96. Wolters et al. (Citation2021) have shown a good relationship with reflectance calculated to CI and N-uptake. In this study, the CI index also had the best correlation with grain CP (r = 0.87) content and was selected as the index to use in linear models.
Figure 3. Spearman correlation coefficient (r) for the different predictors and crude protein (CP) content.
Performance of general models
A summary of the results from LTO cross-validation for the six different bread wheat varieties is given in . Using the linear regression method and the best-performing index (CI), R2 = 0.71 the MAE was 0.64% CP. Inclusion of CI values from zero-plots reduced the accuracy of the model slightly, to R2 = 0.60 with MAE 0.71% CP. The max-plot CI value (CI-max) did not influence the prediction outcome substantially, R2 = 0.71, MAE = 0.64% CP. A model with both the zero-plots and the max plot gave R2 = 0.60, MAE = 0.71% CP for the linear method.
Table 5. Validation results (leave-one-trial-out) of crude protein (CP) content in wheat for the eight modelling strategies, using two model types (linear (a), MARS (b)), and four different combinations of predictor variables (1-4).
Leave-one-trial-out cross-validation with the MARS method gave lower accuracy in the results. The number of indices selected by the MARS method varied from three to five. Using all seven indices at the start of the procedure resulted in a model with R2 = 0.50, MAE = 0.90% CP. The VIs: CI, OSAVI, TCOS and REIP were selected in this model. In the MARS method, the model was improved with the introduction of zero-plot CI values R2 = 0.63, MAE = 0.70% CP. The opposite was the case when max-plots were used for modelling, R2 = 0.36, MAE = 1.19% CP. The model performance improved again when VI values for both zero-plots and max-plots were introduced to the model R2 = 0.70, MAE = 0.60% CP. In all models, for both methods, MAE was <1.20% CP.
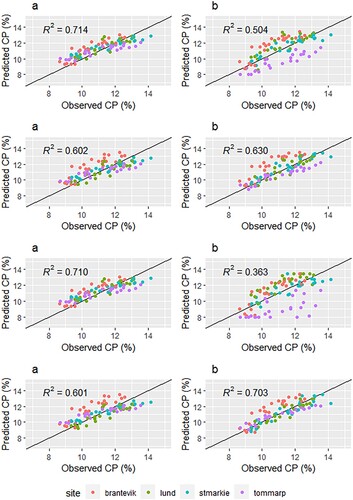
Prediction results for all eight modelling strategies summarised in are also presented in . In two cases (1a, 3a), linear models were generally a better fit than the predictions with MARS modelling and in two cases (2b, 4b) the MARS models performed slightly better. In the prediction graphs for linear predictions, there was less variation between sites than in the MARS method graphs. For the site ‘Tommarp’, predicted values were lower than observed in the first three models ().
Figure 4. Leave-one-trial-out cross-validation for the eight modelling strategies (see ). Predicted crude protein (CP) percentage vs. observed CP percentage.
Performance of cultivar-specific models
Results from LTO cross-validation of cultivar-specific models for strategies 1a and 4b (the best-performing strategies for general models for the two model types, ) are summarised in . Using the linear modelling method with CI (strategy 1a), it was possible to parameterise well-performing cultivar-specific models. Cultivar-specific linear models performed better than general models. For MARS models, more variation in the performance of different cultivar-specific models was found (). In both methods, the varieties ‘RGT Reform’ and ‘Etana’ stood out as good-performing varieties.
Table 6. Validation statistics from leave-one-trial-out cross-validation of linear or multiple linear regression models based on the best single index for strategy 1a (see ) and Multivariate Adapted Regression Splines (MARS) prediction results for strategy 4b.
Satellite application
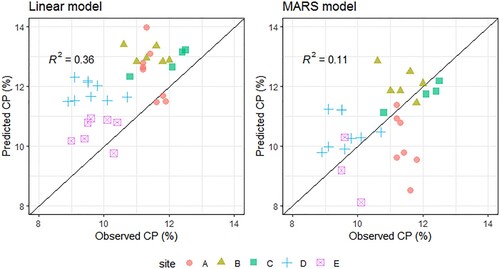
Model performance evaluation for a satellite dataset on five fields (strategy 1a-b) showed that the linear regression model based on one VI performed better (higher R2) than the multivariate model based on four VIs (). However, it is clear from that the model mainly explained between-field variation in those cases. The CP variation within the fields was small and could not be predicted well by the model. In application of the linear model there was a general prediction bias, with most predictions being higher than the observed values.
Figure 5. Predicted crude protein (CP) values versus observed CP values when the best-performing (left) linear model (strategy 1a) and (right) multivariate adaptive regression splines (MARS) model (strategy 1b) (see ) as applied on Sentinel-2 data from the five test fields (locations A-E in ).
Discussion
Field trials and decision support systems
Field trials are important for agricultural research. From a practical application perspective, it is advantageous if results can quickly reach end-users, in the form of advice and recommendations (Söderström et al. Citation2021). One part of the ongoing digitalisation of agriculture is increasing use of digital DSSs in precision agriculture. Some of these systems are using remote sensing multispectral data derived with satellites, or less commonly, UAVs. It is important to develop different types of relevant models that are suitable for implementation in DSSs. Thus, the aim in the present study was to develop a model for protein prediction at harvest in winter wheat using data from a UAV-borne sensor flown over a number of field trials during two seasons and transfer that model to a satellite data processing DSS and test it on a few fields. This approach, moving from trials to DSS application, revealed opportunities and challenges.
UAV data collection
Ideally, UAV data is collected in all field trials during the same crop development stage, at the same time of day, and under similar weather conditions (e.g. Souza de et al. Citation2021). In reality this is not always feasible, especially in a project with trial sites located far apart (). We aimed for a relatively narrow crop development window (DC69-73; as suggested in earlier studies, e.g. Bastos et al. Citation2021; Börjesson and Söderström Citation2003; Prey and Schmidhalter Citation2019;) however, in one of the trials used in the modelling measurements were made at DC75. Note also that the DC specified is the manually assessed average DC of each trial, although there were some differences within each trial, both random and between varieties and N rates. Since weather conditions were different, the aim was at least for uniform weather conditions where possible during individual flights, although three different types of weather were encountered during the flights: overcast, sunny and hazy ().
Trial design
The purpose of the trial design ( & ), was to test the response of different wheat varieties to different N rates. This means that the trials were, when possible, located in places where the crop variation was only driven by the treatment (i.e. different N rates and cultivars). In farmers’ fields, this of course rarely is the case (Colaço and Bramley Citation2018). Conventional plot experiments are likely not the ideal method to evaluate variable rate technologies implemented to accommodate the effects of spatial variability in CP. Other factors may limit crop growth to different extents in different parts of a field, such as availability of other soil nutrients or water. A difficulty with the use of reflectance data is that the causes of variation in reflectance from the crop are usually not known. Studies separating e.g. water status from N status may provide valuable context in this case (Reese et al. Citation2010; Kusnierek and Korsaeth Citation2015).
Protein prediction models
Even with the well-known relationship between CP and N rate (Terman et al. Citation1969; Hamnér et al. Citation2017; Sieling and Kage Citation2021), it is challenging to model protein content in field crops (Colaço and Bramley Citation2018), even when distinct fertilisation steps are present in the dataset (Pettersson et al. Citation2006). In this study we did not find benefit in using a more complex CP prediction model (MARS model based on multiple indices including zero-plots and max-plots) (R2 = 0.70; MAE = 0.60% CP) over using the best linear model (based on one vegetation index, CI) (R2 = 0.71; MAE = 0.64% CP). It appeared that the ML model did not optimise with this small dataset, and the independent validation. Given that it can be difficult to compare validation statistics between different studies, these models seem to perform relatively well compared to a statistical summary of reported research in this field (Bastos et al. Citation2021). In terms of best-performing index (CI), our study is in line with earlier work (e.g. Reusch Citation2005; Prey and Schmidhalter Citation2019) which indicates that an index based on two bands in the NIR-red-edge region is better correlated to N concentration and N-uptake than commonly used indices, such as NDVI and MSAVI2. There were in general small or no improvements in model performance when zero-plots and/or max-plots were included as predictors in the models (). In practical agricultural production in Sweden, the use of zero-plots and max-plots as a means of improving supplementary N fertilisation rate at DC37-45 in winter wheat appears to be increasing (Hushållningssällskapet Citation2021). However, data collection was done here at a considerably later stage, when the benefit of zero-plots and max-plots for protein prediction models may be limited. . There was much variation in the model accuracy between the different models including these predictors, and there was no proven benefit in preparing zero-plots and max-plots for this type of CP prediction.
The linear cultivar-specific protein prediction models worked better than the general model ( and ). The LTO validation statistics showed good performance, with the best variety being RGT Reform (R2 = 0.87; MAE = 0.40% CP). When modelling was performed for each variety individually, the MARS model performed less well, possibly due to the relatively small number of observations used for calibration. When the MARS method was used, the variety ‘RGT Reform’ again performed best (R2 = 0.84; MAE = 0.46% CP). With a more extensive dataset, the results would likely have been more clear. The response to N varies between cultivars (Fowler Citation2003). Some cultivars tend to be both high-yielding and at the same time have high CP content, whereas others can be high-yielding but the CP content will be lower. The yield-CP interaction differs among the cultivars tested in this study. For example, the cultivar Etana is a high-yielding high-protein cultivar, and in comparison the cultivar Hallfreda tends to have lower CP at the same yield, whereas the cultivar Praktik has a lower yield at the same CP (Hammarstedt Citation2021). This interaction is likely important when using canopy reflectance for modelling CP, and modelling yield variation is often easier than modelling CP (e.g. Barmeier et al. Citation2017).
Transfer of UAV data to satellite data
A question raised in the section on model field application, is whether it is possible to transfer models between platforms. Application of the UAV-based models on Sentinel-2 satellite data revealed that transfer of the model resulted in a low prediction accuracy and bias in the predictions. We used a UAV-borne sensor (MAIA-S2), which sensed bands with similar spectral characteristics as the intended satellite to be used in a DSS (Sentinel-2), however there are likely still discrepancies between the acquired reflectance values from the two sensing systems (shown in e.g. Bukowiecki et al. Citation2021; Peng et al., Citation2021; Rasmussen et al. Citation2021; Sarvia et al. Citation2021). Panels with known reflectance properties were used in the field trials and the digital numbers were calculated using an empirical relationship derived in each trial. Here we applied the protein prediction models on Sentinel-2 L2A data, which presumes that data from the two platforms are comparable. The prediction accuracy was not good when the models were applied, which indicates that the comparability in the field of data from MAIA-S2 and Sentinel-2 requires further investigation (). An issue with applying models in satellite based DSS is that images from suitable dates (the growth stages for which the model was parameterised) must be available. The protein prediction model in this study was developed based on data collected at crop development stages DC69-75, a relatively large DC range, however a satellite image was not always available for that period. If the model is to be applied over large areas and the crop growth stages in individual fields are not known, the model performance may be limited. Earlier research suggested that spectral models during anthesis could be affected by large phenological shifts during that period, and that the most stable relationships between N concentration and canopy reflectance could be found during milk- ripening stage (DC73; Prey and Schmidhalter Citation2019). In this case, the DC was not recorded in the fields. The Swedish Board of Agriculture has a website where weekly recordings of DC are reported (https://etjanst.sjv.se/povpub-gui/#/karta?produktionsinriktning=jordbruk, accessed March 10, 2022), and by following information from this page we noticed it is possible that in part of south-western Sweden the DC in winter wheat on June 25, 2020 was slightly higher than DC75.
Validation of the performance of a satellite-based model requires carefulness (e.g. Bastos et al. Citation2021). Collecting ground truth protein data in a growing wheat crop is difficult if the data are to be comparable to values sensed by a satellite such as Sentinel-2. The Sentinel-2 pixels are 400 m2 (20 × 20 m) for the bands used in the best-performing models. Ground truth data in the field were subsamples collected within about 3 × 3 m areas. In this case, the sampling locations were not positioned according the outline of the pixels of the Sentinel-2 data. Even if this had been done, minor shifts in the georeferencing of the satellite image, practicalities during field work, and accuracy of positioning of the grain sampling location, still make it difficult to match a sample with a satellite image pixel. The sampling procedure is usually challenging and will inevitably have induced uncertainty in the results. In future research, the procedure of collecting ground truth data with modification will better match to the satellite data. The results reported in should be interpreted with the issues described above in mind. There appears to be some bias in the predictions (see linear model application in ), with the model over-predicting the protein content compared with the ground observations. If all observations are regarded collectively, the model made a poor prediction on the satellite dataset (R2 = 0.36) and the within-field variation was not captured by the model. There was no field check done on the crop development stage for the different fields, and therefore the satellite data was selected from regional general information on reported crop growth stages in winter wheat, which will differ between fields. The simpler linear model performed better than the more flexible MARS model.
The modelling results of the different methods presented here add to the general knowledge base on CP estimation and protein models will maybe be applicable in a DSS in the future, when a different approach has been tested. Predicting and mapping the variation of protein content in grain crops remains a challenge, as also reported by Bastos et al. (Citation2021). Further work on finding functional methods using proximal and remote sensing is recommended.
Acknowledgements
The authors wish to thank the funders, and the farmers who provided access to their fields. Also special thanks to Heather Reese, Associate Professor at the University of Gothenburg, for advice during the work on this study.
Disclosure statement
No potential conflict of interest was reported by the author(s).
Data availability
Data used in this study are not openly available, for inquiry please contact the authors.
Additional information
Funding
Notes on contributors
Sandra Wolters
Sandra Wolters, PhD candidate, Swedish University of Agricultural Sciences (SLU). Previously affiliated with Wageningen Plant Research and Wageningen University, the Netherlands.
Mats Söderström
Mats Söderström, Associate Professor in Soil Science at SLU, focussing on applied research in digital soil mapping and precision agriculture often involving proximal and remote sensing of soil and crops.
Kristin Piikki
Kristin Piikki, plant physiologist with a PhD in Environmental Sciences (Gothenburg University, Gothenburg Sweden, 2006). Now researcher in precision agriculture and pedometrics. Holds a position as a Senior Lecturer at SLU and is an associate member of staff at The Alliance of Bioversity International and the International Center for Tropical Agriculture (CIAT), Nairobi, Kenya. Senior associate editor at Geoderma (Elsevier) and associate editor of Precision Agriculture (Springer).
Thomas Börjesson
Thomas Börjesson, agronomist with a PhD in Microbiology (Swedish University of Agricultural Sciences, Uppsala Sweden, 1993). Now project leader at Agroväst Livsmedel AB, Skara Sweden. Agroväst is a NGO with emphasis on applied science and to promote agricultural development, including Precision Agriculture in West Sweden.
Carl-Göran Pettersson
Carl-Göran Pettersson, agronomist with a PhD in Crop Science (Swedish University of Agricultural Sciences, Uppsala Sweden, 2007). Now Senior Project Manager Grain at Lantmännen Group R&D, Stockholm Sweden.
Notes
1 The trial series forms part of Sverigeförsöken. It was conducted by Hushållningssällskapet and funded by Stiftelsen lantbruksforskning. Agronomic data from the trials are publicly available in the Nordic Field Trials System (NFTS; https://nfts.dlbr.dk; The Danish Technological Institute and SEGES, Aarhus, Denmark). More method details on the trials are also available in this database.
References
- Barmeier G, Hofer K, Schmidhalter U. 2017. Mid-season prediction of grain yield and protein content of spring barley cultivars using high-throughput spectral sensing. Eur J Agron. 90:108–116. doi:10.1016/j.eja.2017.07.005.
- Barnes EM, Clarke TR, Richards SE, Colaizzi PD, Haberland J, Kostrzewski M, Lascano RJ. 2000. Coincident detection of crop water stress, nitrogen status and canopy density using ground based multispectral data. Proceedings of the fifth International Conference on Precision agriculture; Bloomington, MN, USA, 1619.
- Basnet BB, Apan A, Kelly R, Jensen T, Strong W, Butler D. 2003. Relating satellite imagery with grain protein content. In Proceedings of the 2003 Spatial Sciences Institute biennial conference: spatial knowledge without boundaries (SSC2003); Canberra, Australia. 22–27 September 2003, Spatial Sciences Institute, pp. 1–11.
- Bastos M, de Borja Reis F, Sharda A, Wright A, Ciampitti Y, A I. 2021. Current status and future opportunities for grain protein prediction using On-and Off-combine sensors: A synthesis-analysis of the literature. Remote Sens (Basel). 13:5027. doi:10.3390/rs13245027.
- Börjesson T, Söderström M. 2003. Prediction of protein content in cereals using canopy reflectance. In: Stafford JV, Werner A, editor. Precision agriculture. Wageningen: Wageningen Academic Publishers; p. 89–94.
- Börjesson T, Wolters S, Söderström M. 2019. Satellite-based modelling of protein content in winter wheat and malting barley. In: Stafford J, editor. Precision Agriculture, Proceedings of the 12th European conference on precision agriculture. Wageningen: Wageningen Academic Publishers; p. 581–587.
- Bukowiecki J, Rose T, Kage H. 2021. Sentinel-2 data for Precision agriculture? A UAV-based assessment. Sensors. 21:2861. doi:10.3390/s21082861.
- Colaço AF, Bramley RGV. 2018. Do crop sensors promote improved nitrogen management in grain crops? Field Crops Res. 218:126–140. doi:10.1016/j.fcr.2018.01.007.
- Delin S. 2004. Within-field variations in grain protein content, relationships to yield and soil nitrogen and consistency in maps between years. Precis Agric. 5(6):565–577.
- Du MM, Noguchi N, Itoh A, Shibuya Y. 2017. Multi-temporal monitoring of wheat growth by using images from satellite and unmanned aerial vehicle. Int J Agric Biol Eng. 10(5):1–13. doi:10.25165/j.ijabe.20171005.3180.
- Filippi AM, Güneralp I, Randall J. 2014. Hyperspectral remote sensing of aboveground biomass on a river meander bend using multivariate adaptive regression splines and stochastic gradient boosting. Remote Sens Lett. 5(5):432–441. doi:10.1080/2150704X.2014.915070.
- Finney KF, Meyer JW, Smith FW, Fryer HC. 1957. Effect of foliar spraying on pawnee wheat with urea solutions on yield, protein content, and protein quality. Agron J. 49:341–347.
- Fowler DB. 2003. Crop nitrogen demand and grain protein concentration of spring and winter wheat. Agron J. 95:260–265.
- Freeman KW, Raun WR, Johnson GV, Mullen RW, Stone ML, Solie JB. 2003. Late-season prediction of wheat grain yield and grain protein. Commun Soil Sci Plant Anal. 34(13-14):1837–1852. doi:10.1081/CSS-120023219.
- Friedman JH. 1991. Multivariate adaptive regression splines. Ann Stat. 19:1–67. doi:10.1214/aos/1176347963.
- Gitelson AA, Gritz Y, Merzlyak MN. 2003. Relationships between leaf chlorophyll content and spectral reflectance and algorithms for non-destructive chlorophyll assessment in higher plant leaves. Journal of Plant Physics. 160:271–282.
- Gooding, M.J. (2009). The wheat crop. In: Khan K, Shewry PR, editors. Wheat chemistry and technology (4th Edition). Cambridge: Woodhead Publishing and AACC International Press; p. 19–49.
- Gooding MJ, Davies WP. 1992. Foliar urea fertilization of cereals: A review. Fertil Res. 32:209–222.
- Gooding MJ, Davies WP. 1997. Wheat production and utilization. systems, quality and the environment. Cambridge: Cab International.
- Guyot G, Baret F, Major DJ. 1988. High spectral resolution: determination of spectral shifts between the red and the near infrared. Int Arch Photogramm Remote Sens Spat Inf Sci. 11:750–760.
- Haboudane D, Miller JR, Tremblay N, Zarco-Tejada PJ, Dextraze L. 2002. Integrated narrow-band vegetation indices for prediction of crop chlorophyll content for application to precision agriculture. Remote Sens Environ. 81:416–426.
- Hammarstedt M. 2021. Mer än avkastning styr valet av höstvete (More than yield governs the choice of winter wheat). Arvensis, 4-5, 20-22. (In Swedish). Retrevied from: https://issuu.com/kb_arvensis/docs/arvensis_4-5_2021_inf_r_val_av_h_stvetesort.
- Hamnér K, Weih M, Eriksson J, Kirchmann H. 2017. Influence of nitrogen supply on macro- and micronutrient accumulation during growth of winter wheat. Field Crops Res. 213:118–129. doi:10.1016/j.fcr.2017.08.002.
- Hansen PM, Jørgensen JR, Thomsen A. 2002. Predicting grain yield and protein content in winter wheat and spring barley using repeated canopy reflectance measurements and partial least squares regression. J Agric Sci. 139:307–318.
- Hastie T, Tibshirani R, Friedman JH. 2009. The elements of statistical learning: data mining, inference, and prediction, 2nd ed. New York: Springer.
- Hu C, Sadras VO, Lu G, Zhang P, Han Y, Liu L, Xie J, Yang X, Zhang S. 2021. A global meta-analysis of split nitrogen application for improved wheat yield and grain protein content. Soil Tillage Res. 213: 105111. doi:10.1016/j.still.2021.105111.
- Huete AR. 1988. A soil-adjusted vegetation index (SAVI). Remote Sens Environ. 25(3):295–309. doi:10.1016/0034-4257(88)90106-X. ISSN 0034-4257.
- Hushållningssällskapet. 2021. Fieldreport. Retrieved from: https://hushallningssallskapet.se/wp-content/uploads/2021/06/final-hushallningssallskapet-faltrapporten-nr-2-2021-low.pdf.
- Johnson GV, Raun WR. 2003. Nitrogen response index as a guide to fertilizer management. J Plant Nutr. 26(2):249–262. doi:10.1081/PLN-120017134.
- Kim MS, Daughtry CST, Chappelle EW, McMurtrey JE, Walthall CL. 1994. The use of high spectral resolution bands for estimating absorbed photosynthetically active radiation (Apar). Proceedings of the 6th symposium on physical measurements and signatures in remote sensing; Val D’Isere, France, January 17-21, 299-306.
- Kusnierek K, Korsaeth A. 2015. Simultaneous identification of spring wheat nitrogen and water status using visible and near infrared spectra and powered partial least squares regression. Comput Electron Agric. 117:200–213. doi:10.1016/j.compag.2015.08.001.
- Lacoste M, Cook S, McNee M, Gale D, Ingram J, Bellon-Maurel V, MacMillan T, Sylvester-Bradley R, Kindred D, Bramley R, et al. 2022. On-Farm experimentation to transform global agriculture. Nat Food. 3:11–18. doi:10.1038/s43016-021-00424-4.
- Liakos KG, Busato P, Moshou D, Pearson S, Bochtis D. 2018. Machine learning in agriculture: A review. Sensors. 18:2674. doi:10.3390/s18082674.
- Lory JA, Scharf PC. 2003. Yield goal versus delta yield for predicting fertilizer nitrogen need in corn. Agron J. 95(4):994–999.
- Martínez-Casasnovas J, Escolà A, Arnó J. 2018. Use of farmer knowledge in the delineation of potential management zones. In precision agriculture: A case study in maize (Zea mays L.). Agriculture. 8(6):84. doi:10.3390/agriculture8060084.
- Miao Y, Mulla D, Pierre R. 2018. An integrated approach to site-specific management zone delineation. Front Agric Sci Eng. 5:432–441. doi:10.15302/J-FASE-2018230.
- Milborrow S. 2021. Notes on the earth package. Retrieved from: http://www.milbo.org/doc/earth-notes.pdf.
- Mulla DJ. 1993. Mapping and managing spatial patterns in soil fertility and crop yield. In: Robert PC, Rust RH, Larson WE, editor. Soil specific crop management. Madison: ASA/CSSA/SSSA; p. 15–26.
- Nocerino E, Dubbini M, Menna F, Remondino F, Gattelli M, Covi D. 2017. Geometric calibration and radiometric correction of the maia multispectral camera. Int Arch Photogramm Remote Sens Spat Inf Sci. XLII-3/W3:149–156. doi:10.5194/isprs-archives-XLII-3-W3-149-2017.
- Øvergaard SI, Isaksson T, Korsaeth A. 2013. Prediction of wheat yield and protein using remote sensors on plots—part I: assessing near infrared model robustness for year and site variations. J Near Infrared Spectrosc. 21:117–131.
- Peng J, Manevski K, Kørup K, Larsen R, Neumann Andersen M. 2021. Random forest regression results in accurate assessment of potato nitrogen status based on multispectral data from different platforms and the critical concentration approach. Field Crops Res. 268:108158. doi:10.1016/j.fcr.2021.108158.
- Pettersson CG, Eckersten H. 2007. Prediction of grain protein in spring malting barley grown in Northern Europe. Eur J Agron. 27: 205–214.
- Pettersson CG, Söderström M, Eckersten H. 2006. Canopy reflectance, thermal stress, and apparent soil electrical conductivity as predictors of within-field variability in grain yield and grain protein of malting barley. Precis Agric. 7:343–359. s11119-006-9019-4.
- Piikki K, Stenberg B. 2017. A modified delta yield approach for estimation of economic optimal nitrogen rate (EONR) for wheat (Triticum aestivum L.) and barley (Hordeum vulgare L.). Agric Food Sci. 26(4):233–241.
- Prey L, Schmidhalter U. 2019. Temporal and spectral optimization of vegetation indices for estimating grain nitrogen uptake and late-seasonal nitrogen traits in wheat. Sensors. 19:4640. doi:10.3390/s19214640.
- R Core Team. 2021. R: A language and environment for statistical computing. Vienna, Austria: R Foundation for Statistical Computing. URL https://www.R-project.org/.
- Rasmussen J, Azim S, Boldsen SK, Nitschke T, Jensen SM, Nielsen J, Christensen S. 2021. The challenge of reproducing remote sensing data from satellites and unmanned aerial vehicles (UAVs) in the context of management zones and precision agriculture. Precis Agric. 22:834–851. doi:10.1007/s11119-020-09759-7.
- Raun W, Solie J, Stone M. 2011. Independence of yield potential and crop nitrogen response. Precis Agric. 12:508–518. doi:10.1007/s11119-010-9196-z.
- Reese CL, Long DS, Clay DE, Clay SA, Beck DL. 2010. Nitrogen and water stress impacts hard Red spring wheat (Triticum aestivum) canopy reflectance. J Terr Obs. 2(1):1946–1143. Purdue University Press.
- Reusch S. 1997. Entwicklung eines reflexionsoptischen Sensor zur Erfassung der Stickstoffversorgung landwirtschaftlicher Kulturpflanzen. Kiel Inst. für Landwirtschaftliche Verfahrenstechnik, Max-Eyth-Gesellschaft für Agrartechnik.
- Reusch S. 2005. Optimum waveband selection for determining the nitrogen uptake in winter wheat by active remote sensing. In: JV Stafford, A Werner, editor. Precision agriculture ‘05. Wageningen: Wageningen Academic Publishers; p. 261–266.
- Rodrigues FA, Blasch G, Defourny P, Ortiz-Monasterio J, Schulthess U, Zarco-Tejada PJ, Taylor JA, Gérard B. 2018. Multi-temporal and spectral analysis of high-resolution hyperspectral airborne imagery for precision agriculture: assessment of wheat grain yield and grain protein content. Remote Sens (Basel). 10(6):930. doi:10.3390/rs10060930.
- Rondeaux G, Steven M, Baret F. 1996. Optimization of soil-adjusted vegetation indices. Remote Sens Environ. 55(2):95–107. doi:10.1016/0034-4257(95)00186-7. ISSN 0034-4257.
- Rouse JW, Haas RH, Schell JA, Deering DW. 1974. Monitoring vegetation systems in the Great Plains with ERTS. In: Freden SC, Mercanti EP, Becker M, editor. Third earth resources Technology satellite–1 syposium. volume I: technical presentations. Washington, DC: NASA SP-351, NASA; p. 309–317.
- Sarvia F, De Petris S, Orusa T, Borgogno-Mondino E. 2021. MAIA S2 versus sentinel 2: spectral issues and their effects in the precision farming context. In: Gervasi O, Murgante B, Misra S, Garau C, Blečić I, Taniar D, Apduhan BO, Rocha AMAC, Tarantino E, Torre CM, editors. Computational science and its applications - ICCSA 2021. Cham: Springer; p. 63-77. doi:10.1007/978-3-030-87007-2_5.
- Sieling K, Kage H. 2021. Apparent fertilizer N recovery and the relationship between grain yield and grain protein concentration of different winter wheat varieties in a long-term field trial. Eur J Agron. 124: 126246. doi:10.1016/j.eja.2021.126246.
- Souza de R, Buchhart C, Heil K, Plass J, Padilla FM, Schmidhalter U. 2021. Effect of time of Day and Sky conditions on different vegetation indices calculated from active and passive sensors and images taken from UAV. Remote Sens (Basel). 13:1691. doi:10.3390/rs13091691.
- Söderström M, Börjesson T, Pettersson C, Nissen K, Hagner O. 2010. Prediction of protein content in malting barley using proximal and remote sensing. Precis Agric. 11:587–599. doi:10.1007/s11119-010-9181-6.
- Söderström M, Börjesson T, Roland B, Stadig H. 2015. Modelling within-field variations in deoxynivalenol (DON) content in oats using proximal and remote sensing. Precis Agric. 16:1–14. doi:10.1007/s11119-014-9373-6.
- Söderström M, Pikki K, Stadig H. 2021. Yield maps for everyone. scaling drone models for satellite-based decision support. In: Stafford J, editor. Precision Agriculture ‘21, Proceedings of the 13th European conference on precision agriculture. Wageningen: Wageningen Academic Publishers; p. 911–918.
- Taylor J, Whelan B, Thylén L, Gilbertsson M, Hassall J. 2005. Monitoring wheat protein content on-harvester: Australian experiences. In: Stafford JV, editor. Precision Agriculture ‘05, Proceedings of the 5th European Conference on Precision Agriculture. Wageningen: Wageningen Academic Publishers.
- Terman GL, Ramig RE, Dreier AF, Olson RA. 1969. Yield-protein relationships in wheat grain, as affected by nitrogen and water. Agron J. 61:755–759.
- Thylén L, Algerbo PA. 2001. Development of a protein sensor for combine harvesters. In: Grenier G, Blackmore S, editor. In ECPA 2001, Proceedings of the 3rd European Conference on Precision agriculture. Montpellier; p. 869–873.
- Wolters S, Söderström M, Piikki K, Reese H, Stenberg M. 2021. Upscaling proximal sensor N-uptake predictions in winter wheat (Triticum aestivum L.) with Sentinel-2 satellite data for use in a decision support system. Precis Agric. 22:1263–1283. doi:10.1007/s11119-020-09783-7.
- Zadok JC, Chang TT, Konzak CF. 1974. A decimal code for the growth stages of cereals. Weed Res. 14:415–421.
- Zhou X, Kono Y, Win A, Matsui T, Tanaka TST. 2021. Predicting within-field variability in grain yield and protein content of winter wheat using UAV-based multispectral imagery and machine learning approaches. Plant Prod Sci. 24:137–151. doi:10.1080/1343943X.2020.1819165.