Abstract
The growth potential of four semi-natural grasslands with rotational grazing was studied during four growing seasons. A crop growth model was used to quantify growth potential and to separate the influence of weather variables from factors related to the plant stand. The investigation revealed a high variability in dry matter (DM) production among years during the study period due to weather. There was also found to be a clear seasonal variation. The general shape of the DM production curve, with a rapid spring growth (the maximum relative growth rate (R s )=0.16 g g−1 day−1), a midsummer depression (R s =0.06 g g−1 day−1), and a second peak of growth in late summer (R s =0.09 g g−1 day−1), was the same for all years and for all fields. The model underestimated production when cover of herbs was low in spring and overestimated production when cover of herbs was high in spring. The seasonal and among years variation in DM production entailed a parallel large variability in the numbers of grazing animals (from 11 to 43 heifers ha−1) the area could sustain.
Introduction
Due to land use changes during the last 50 years many semi-natural grasslands have been abandoned in Norway and throughout Europe (van Dijk, Citation1991; Framstad & Lid, Citation1998). Abandonment leads to an excess of bushes and trees, and a reduction in biodiversity (Losvik, Citation1988; Hill et al., Citation1992). Restoration and more specific management might be necessary to re-establish and maintain some of the semi-natural grasslands (Johansson & Hedin, Citation1995; Hobbs & Harris, Citation2001). Grazing represents one management alternative. Proper management of grazing for both the animals and the vegetation requires knowledge about the productivity of grasslands throughout the season. Several factors cause variability in dry matter (DM) production: climate, with seasonal and year-to-year variations in temperature, precipitation, radiation and evaporation; and site variability in soil chemical and physical factors (Skjelvåg, Citation1998). Plant related variability such as phenological growth stage (Bonesmo & Skjelvåg, Citation1999) and species composition (Smith & Allcock, Citation1985) also affect production, as well as type of management such as cuttting, continual grazing or rotational grazing (Orr et al., Citation1988). Semi-natural grasslands, which are not fertilized and have a low production level, have rarely been investigated in terms of seasonal variability in production. This information is important, however, in assessing the number of grazing animals that these areas can sustain.
Growth models are used to predict the growth pattern in grasslands, and might represent a tool for decision support in grazing management plans for semi-natural grasslands. The effects of climate and soil physics can be accounted for in such models, while the remaining differences can be related to species composition and nutrient supply. The aims of this investigation were: 1) to estimate the production level in semi-natural grasslands throughout the season and to display year-to-year variation by the means of a crop growth model; 2) to relate the field specific deviations from the general growth pattern to the cover of grasses and herbs; and 3) to quantify the effects of seasonal changes in productivity on the number of grazing animals which can be sustained.
Materials and methods
Site description and measurements
The study sites were four grasslands, two in Orkdal, central Norway, and two in Gaular, western Norway (). The grasslands had been abandoned for 6–25 years before start of the investigation. Data for daily global radiation, daily mean temperature, precipitation, and potential evapotranspiration were obtained from the Meteorological Institute's weather station Orkdal-Øyum (62°12′ N 9°47′ E, 22 m a.s.l.) and the Norwegian Crop Research Institute's weather station Fureneset (61°18′ N 5°03′ E, 10 m a.s.l.). According to standard meteorological definitions the growing season in Orkdal is 170–180 days, and in Gaular 180–190 days (Moen, Citation1998). Both sites are located near the coast with high annual precipitation (). At both sites, soil water stored at tension levels 0.01 to 1.5 MPa was regarded as available to plants down to 30 cm only, because of low productivity and repeated cuttings of the sward. The estimation of the plant-available water was based on soil moisture retention curves obtained by the pressure plate technique (Richard, Citation1938; Richard, Citation1941) (). Plant-available K (K-AL) was high or very high (7.0–50.0 mg/100g) in both Gaular and Orkdal, while plant-available P (P-AL) was high or very high in Gaular (8.4–26.7 mg/100g) and low to medium-high in Orkdal (0.6–9.1 mg/100g) according to Krogstad (Citation1992).
Table I. Location, annual precipitation, mean annual temperature, soil type, and readily (RAW) and weakly (WAW) plant available water at four study sites.
Each of the four grasslands was separated into four sub-units for rotational grazing from June until September. The animals grazed each sub-unit for 7 days and each sub-unit was grazed 2–3 times each summer. Two 10 m×10 m quadrats were laid out in each rotational unit where the vegetation was as homogenous as possible. One plot for the repeated cutting of yield samples (1999–2002 at Orkdal and 2001–2002 at Gaular) was caged within each quadrat, and not grazed. These plots were 1.2 m×0.3 m and 0.5 m×0.5 m at Orkdal and Gaular, respectively, and they were cut at each introduction of animals to each sub-unit, by cutting the plot at a stubble height of 2.0 cm. At the study sites in Orkdal, additional yield samples were taken in 2001 and 2002 from caged 0.5 m×0.5 m plots laid out on areas grazed the previous years. Average DM yields for each sampling time and rotational unit were used in the model parameterization.
Five plots of 1 m×1 m were randomly place in each 10 m×10 m quadrat and analysed with respect to botanical composition, with a total of 40 plots in each site. Each plot was divided into 25 subplots of 0.2 m×0.2 m. The cover of each vascular plant species was recorded in each subplot according to a three-point scale: 1) one individual of the species in the subplot; 2) more than one individual, but the species covers less than half the subplot; 3) the species covers more than half the subplot. The species were divided into two groups, one of grasses that comprised Poaceae and Cyperaceae, and one of herbs that comprised the remaining species. To estimate the cover of herbs and grasses in each field, the values from the 40×25 subplots were added together for each group. The total vegetation cover of each field was the group of grasses and herbs added together. The total numbers of grass and herb species in each field were the number of different species found in the plots in each field. The total number of species in each field was the number of grass and herb species added together (Rosef, Citation2004). These analyses were carried out each spring in May, and each autumn in September. The vegetation was dominated of Deschampsia cespitosa tussocks, Festuca rubra and Agrostis capillaris in all four grasslands. Many herb species also had a high cover in all the grasslands e.g. Rumex acetosa, Urtica dioica, Lathyrus pratensis, Galium boreale, G. uliginosum and G. saxatilis. Nomenclature follows Lid and Lid (Citation1994).
Growth model
A crop growth model for grasslands (Torssell et al., Citation1982; Torssell & Kornher, Citation1983) estimates daily dry matter growth and current dry matter yield by:
At the onset of growth in spring, the soil was assumed to be at field capacity due to water from snowmelt and very low potential evapotranspiration. Growth was assumed to begin at first passage of seven-day diurnal mean temperature of a critical temperature T c from an initial above-ground DM yield, W init .
To further illustrate some practical implications the recorded variation in production would have for grazing management, 10-day grazing intervals at four simulated 1 ha rotational units were specified in the model. We assumed that the system was grazed by 350 kg heifers with a feed intake of 5.0 kg DM d−1 (Sundstøl & Ekern, Citation1992), and that trampling by the heifers did not affect plant production.
Parameter estimation and statistical analysis
Parameter estimation was carried out over all years and over the two sites (Orkdal and Gaular), using the two grasslands at each site as replicates. First, the initial above-ground DM (W init ), the critical temperature for growth start (T c ), the coefficients of the age function (LAI h and k), and the maximum relative growth rate (R s ) of the spring growth were estimated using the DM yield of the first four cuts at all fields and years. Secondly, the maximum relative growth rate (R s ) of five specified temperature sum intervals were estimated using the whole data set of measured DM yields, and the estimated values for W init , T c , LAI h , k and maximum relative spring growth rate. The temperature sum intervals, with a base temperature of 0oC, were set to be: 501–700°Cd, 701–900°Cd, 901–1100°Cd, 1101–1500°Cd and, >1500°Cd.
Agreement between measured and calculated dry matter yield was given by the root mean square error of estimation (RMSE):
The RMSE was related to the cover of herbs and grasses in spring by means of regression using the GLM procedure of SAS® (SAS Institute, Citation1999). To characterize the model over- and under-estimation of DM yield, a regression (PROC GLM) was also carried out to relate the measured minus simulated DM yield to the cover of herbs and grasses. Further, a simple regression between estimated and measured values was calculated using the REG procedure in SAS®.
Results
The initial above-ground DM (W init ) was 19 g m−2 and the critical temperature for the onset of spring growth was found to be 1.0°C. The optimal value for the AGE function parameters LAI h and k were estimated to be 3.3 and 5.5, respectively. The model tended to overestimate low yields and underestimate high yields, except in Orkdal in the year 2000 where most yields were underestimated (). The model accounted for 48% of the variation according to a regression analysis between measured and calculated DM yields over all observations. The deviation between measured and calculated DM yields (RMSE) decreased with increasing herb and grass cover in spring. The model underestimated production when cover of herbs was low in spring and overestimated production when cover of herbs was high in spring ().
Figure 1. Simulated DM yield plotted against measured values for each year at each site (Orkdal and Gaular). The RMSE is the root mean square error of estimation, and RMSEn is the normalised RMSE, calculated as RMSE divided by the mean observation.
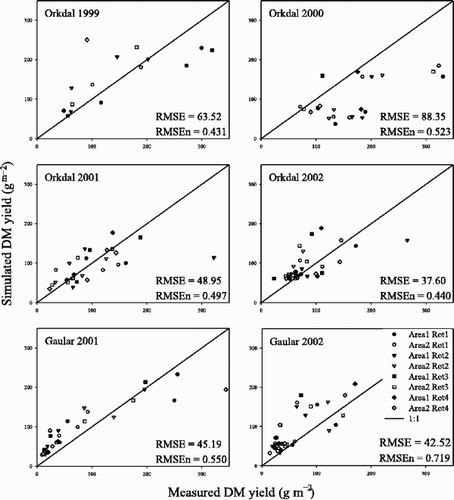
Table II. Statistics on the deviation between measured and simulated DM yield of permanent grassland as affected by cover of herbs (H) and grasses (G) in spring. RMSE is the root mean square error of estimation, and Mea-sim is the measured minus the simulated DM yield.
The maximum relative growth rate (R s ) in the spring was 0.16 g g−1 day−1. When the temperature sum reached 500°Cd, the R s decreased slightly. At temperature sum 701°Cd there was an abrupt decline to the lowest R s of the season (0.06 g g−1 day−1), while R s increased to a second peak at temperature sum 901°Cd. From temperature sum 1101°Cd the R s declined again (). The coefficient of determination, r 2, was low for all temperature sum intervals; it varied from 0.20 to 0.58, except between 901 and 1100°Cd where it was considerably lower (). There was a high variability in the DM production over years and sites in spring and early summer. At the temperature sum interval 701–900°Cd there was an indication of summer depression for all years, before the DM productions increased to a second peak ().
Figure 2. a) Estimated maximum relative growth rate, R s , of abandoned grasslands as related to six temperature sum intervals, and b) DM production for each year at each study site during the growing season as related to temperature sum.
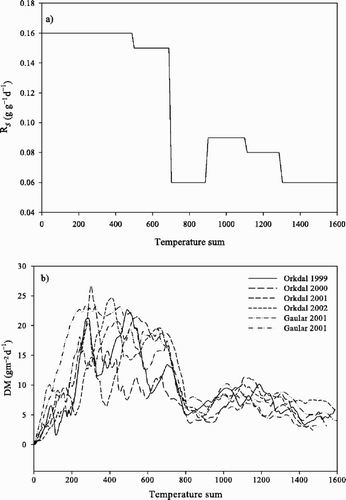
Table III. Summary statistics of model fit to data for six temperature sum (oCd) intervals during the growing season over two study sites and four years.
The year-to-year and between-site variation was due to the considerable variation in weather conditions; the growth index varied from 0.35 in spring to 0.66 in the temperature sum interval of 901–1100°Cd. The particularly high variability of DM production in spring could be explained mainly by variation in temperature (). Growth was not limited by water supply; WI was close to 1 during the whole season for all years and sites. Normal trends with rise in TI with time and highest RI in June were observed.
Table IV. Relative effect of weather on plant growth expressed as the growth index (GI). The GI is a function of the radiation index (RI), the temperature index (TI), and the drought stress index (WI). Mean and standard deviation of GI, RI, TI, and WI during the temperature sum intervals (oCd) over the two study sites Orkdal and Gaular and during four years.
The calculated number of heifers that can be fed by grazing at each 10-day interval was very variable between years, especially in early summer; the first three grazing periods varied between 16 and 19 animals in Orkdal while in Gaular the range was from 7 to 13. In late summer the year-to-year variation was smaller for both areas. The estimated onset of growth varied from 6 to 27 April in Orkdal, while in Gaular the estimated growth start was the same in both years ().
Table V. Seasonal variation in estimated numbers of heifers of 350 kg grazing a rotational system with four sub-units (SU1–SU4) of 1 ha, on the basis of simulated DM production at four years in Orkdal and two years in Gaular.
Discussion
The crop growth model explained only 48% of the variation between measured and simulated DM yields. The result is rather low compared with the studies of Torssell and Kornher (Citation1983) that explained 96% of the variation, and Steinshamn (2001) that explained 93%. However, the model was developed and mostly used for highly productive, fertilized meadows; Kornher and Torssell (Citation1983) found that the variation for DM yield predicted by the model was almost doubled when plant-available soil water and N were low. In the current investigation the deviation between predicted and measured values decreased with increasing cover of herbs and grasses. In areas of low productivity, higher cover of vegetation increases the DM production (Tilman et al., Citation1997; Rottgermann et al., Citation2000). The investigated grasslands have dissimilarities in ecological factors such as slope, and consequent differences in radiation, soil moisture and temperature. This leads to differences in botanical composition and productivity across the field; different plant species produce different amounts of DM (Grime & Hunt, Citation1975; Hunt & Cornelissen, Citation1997). Furthermore, to maximize the number of empirical observations underlying the estimated growth rates, we chose to include all the fields and years in the estimation of the R s , whereas in the other investigations (Torssell & Kornher, Citation1983; Landström, Citation1993; Baadshaug et al., Citation1996; Steinshamn, Citation2001) the R s was estimated for each treatment, site and year separately.
The maximum production potential, expressed by the R s was lower in this investigation than that found in other investigations in Scandinavia (Torssell & Kornher, Citation1983; Landström, Citation1993; Baadshaug et al., Citation1996; Steinshamn, Citation2001). Those investigations were of fertilized areas dominated by relatively few sown and highly productive grass species and clover, while in the current investigation there was no use of fertilizer and a diverse botanical composition. The grasslands in this investigation contained grasses with low productivity such as Festuca rubra, Poa pratensis, and Deschampsia cespitosa but hardly any of the highly productive species Phleum pratense, Lolium perenne or Festuca pratensis that were common in the other investigations. However, some of the herbs were species known to have high DM productivity, e.g. Urtica dioica, Galium saxatile and Epilobium angustifolium (Grime & Hunt, Citation1975; Hunt & Cornelissen, Citation1997), which explains the underestimation of DM production with higher cover of herbs. The low LAI h of 3.3 also expressed the general low productivity of the investigated grasslands. The fertilized, highly productive meadows investigated by Torssell et al. (Citation1982) in southern Sweden and by Steinshamn (Citation2001) in southern and central Norway had higher LAI h values of 5.0 and 5.1 respectively. The k value of 5.5 was higher in the investigated grassland than in the meadows investigated by Torssell et al. (Citation1982) and Steinshamn (Citation2001). A higher k implies a faster rate of plant development, and the investigated grasslands have species such as Festuca rubra, Poa pratensis and Poa trivialis that develop quickly.
The DM production showed a midsummer depression as described in other rotational cut or grazed grasslands by Anslow and Green (Citation1967), Corrall and Fenlon (Citation1978) and Orr et al. (Citation1988) for several grass species, and Menzi et al. (Citation1991) for a grass/white clover mixture. The sharp decline in regrowth with postponed cutting time is caused by the reduction of non-elongated tillers capable of stem elongation in regrowth (Bonesmo, Citation2000); new leaves developed at greater height in the canopy will have higher photosynthetic potential (Woledge, Citation1978). Neither in continuous grazing systems (Orr et al., Citation1988), nor in two-cut systems with cuts at different phenological stages (Bonesmo & Skjelvåg, Citation1999) is a second peak of production observed. An explanation of this phenomenon might be that in rotational systems, at later cuts there will be less apex removal than at the midsummer cuts, and these vegetative tillers will have a more rapid regrowth. The number and coverage of herb species in the fields of the current study were high both in spring and autumn; thus it seems likely that herbs have the same response in production during the season as grasses.
For species-poor semi-natural grasslands of the type in the investigated areas, the recommended number of grazing heifers is 20 to 22 ha−1 in 10-day rotational regimes (Nedkvitne et al., Citation1995; Ekstam & Forshed, Citation1996). In the current study, the calculated number of heifers that could be supported during the first round of grazing ranged from 11 to 43 ha−1. The reason for this wide range in numbers of animals was probably the considerable variation in the onset of growth during the investigated years in Orkdal, together with the variability in weather during the season. The large seasonal and annual variation in numbers of grazing heifers that the area could sustain illustrates the necessity of taking into account the effects of weather in grazing management.
Conclusion
The present investigation revealed a high variability in DM production among years during the study period due to weather. The fact that the model predictions reflected this variation suggests that the model approach correcting for variation in weather was adequate. There was also found to be a clear seasonal variation, and the general shape of the DM production curve with a rapid spring growth, a midsummer depression, and a second peak of growth in late summer, was the same for all the years and at all fields. The growth potential of the investigated fields was found to be higher when the herb and grass cover in spring was high. The seasonal and among years variation in DM production paralleled a large variability in the numbers of grazing animal the area could sustain.
Acknowledgments
The authors are grateful to senior research technician Anne Langerud for her contribution to this work, and to Dr. Anne Kjersti Bakken and Dr. Ann Norderhaug for critical reading of the manuscript and to Dr. Wendy Fjellstad for critical reading and correcting the English. This work was performed with financial support from the Norwegian Research Council and Norwegian Crop Research Institute.
References
References
- Anslow , RC and Green , JO . (1967) . The seasonal growth of pasture grasses . J. Agr. Sci. , 68 : 109 – 127 .
- Baadshaug , OH , Grønnerød , B and Skjelvåg , AO . (1996) . Nitrogengjødsling til eng. Kan forsøksresultatene utnyttes bedre? . Nor. Landbr. Forsk. , 10 : 87 – 100 .
- Bonesmo , H . (1999) . Modelling spring growth of timothy and meadow fescue by an expolinear growth equation . Acta Agric. Scand. , 49 : 216 – 224 .
- Bonesmo , H and Skjelvåg , AO . (1999) . Regrowth rates of timothy and meadow fescue cut at five phenological stages . Acta Agric. Scand. , 49 : 209 – 215 .
- Bonesmo , H . (2000) . Regrowth rates of Timothy and meadow fescue as related to the content of remaining water-soluble carbohydrates and non-elongated tillers . Acta Agric. Scand. , 50 : 22 – 27 .
- Corrall , AJ and Fenlon , JS . (1978) . Comparative method for describing seasonal distribution of production from grasses . J. Agr. Sci. , 91 : 61 – 67 .
- Ekstam U Forshed N (1996) Äldre fodermarker. Betydelsen av hävdregimen i det förgangna. Målstyrning. Mätning og uppföljing Naturvådrsverket förlag Stockholm Sweden 319 pp (In Swedish.)
- Fitzpatrick E Nix AH (1973) The climatic factor in Australian grassland ecology In Moore, R. M. (Ed.) Australian Grasslands (pp. 3–26) Canberra Australian National University Press
- Framstad E Lid IB (1998) Jordbrukets kulturlandskap. Forvaltning av miljøverdier Universitetsforlaget Oslo Norway 285 pp (In Norwegian)
- Grime , JP and Hunt , R . (1975) . Relative growth rate: its range and adaptive significance in a local flora . J. Ecol. , 63 : 393 – 422 .
- Hill , MO , Evans , DF and Bell , SA . (1992) . Long-term effects of excluding sheep from hill pastures in North Wales . J. Ecol. , 80 : 1 – 13 .
- Hobbs , RJ and Harris , JA . (2001) . Restoration ecology: repairing the earth's ecosystems in the new millennium . Restor. Ecol. , 9 : 239 – 246 .
- Hunt , R and Cornelissen , JHC . (1997) . Components of relative growth rate and their interrelations in 59 temperate plant species . New Phytologist , 135 : 395 – 417 .
- Johansson O Hedin P (1995) Restaurering av ängs- och hagmarker Naturvårdsverket Stockholm Sweden 146 pp (In Swedish.)
- Kornher , A and Torssell , BWR . (1983) . Simulation of weather/management interactions in temporary grasslands in Sweden . Swedish J. Agric. Res. , 13 : 145 – 155 .
- Krogstad T (1992) Metoder for jordanalyser. Institutt for jordfag NLH. 6/92 32 pp
- Landström , S . (1993) . Variation in the growth-potential in a timothy and red-clover mixture . Acta Agric. Scand. , 43 : 156 – 162 .
- Lid J Lid DT (1994) Norsk flora Det Norske Samlaget Oslo Norway 1014 pp (In Norwegian.)
- Losvik , MH . (1988) . Phytosociology and ecology of old hay meadows in Hordaland, western Norway in relation to management . Vegetation , 78 : 157 – 187 .
- Menzi , H , Blum , H and Nösberger , J . (1991) . Relationship between climatic factors and the dry matter production of swards of different composition at two altitudes . Grass Forage Sci. , 46 : 223 – 230 .
- Moen A (1998) Nasjonalatlas for Norge: Vegetasjon Statens kartverk, Hønefoss Norway 200 pp (In Norwegian.)
- Nedkvitne JJ Garmo TH Staaland H (1995) Beitedyr i kulturlandskap Landbruksforlaget Oslo Norway 183 pp (In Norwegian.)
- Orr , RJ , Parsons , AJ , Treacher , TT and Penning , PD . (1988) . Seasonal patterns of grass production under cutting or continuous stocking managements . Grass Forage Sci. , 43 : 199 – 207 .
- Powersim (1996) Powersim version 2.5 Herdon VA USA
- Richard , LA . (1941) . A pressure membrane extraction apparatus for soil solution . Soil Sci. , 51 : 377 – 386 .
- Richard , SJ . (1938) . Soil moisture content calculations from capillary tension records . Proc Soil Sci. Soc. Am. , 3 : 57 – 64 .
- Ritchie , JT . (1972) . Model for predicting evaporation from a row crop with incomplete cover . Water Res Res. , 8 : 1204 – 1213 .
- Rosef L (2004) Restoration of species-poor grasslands: effects of different grazing regimes upon biodiversity and landscape diversity Ph.D. thesis Grønn Kunnskap 8 1 43
- Rottgermann , M , Steinlein , T , Beyschlag , W and Dietz , H . (2000) . Linear relationships between above-ground biomass and plant cover in low open herbaceous vegetation . J. Veg. Sci. , 11 : 145 – 148 .
- SAS Institute (1999) SAS® version 8.02 Cary NC USA
- Skjelvåg , AO . (1981) . Experimental and statistical methods of plant experiments used in an agroclimatic investigation in Aust-Agder, Norway . Acta Agric. Scand. , 31 : 343 – 357 .
- Skjelvåg , AO . (1998) . Climatic conditions for crop production in Nordic countries . Agr. Food Sci. Finland , 7 : 149 – 160 .
- Smith , A and Allcock , PJ . (1985) . The influence of species diversity on sward yield and quality . J. Appl. Ecol. , 22 : 185 – 198 .
- Steinshamn , H . (2001) . Effects of cattle slurry on the growth potential and clover proportion of organically managed grass-clover leys . Acta. Agric. Scand. , 51 : 113 – 124 .
- Sundstøl F Ekern A (1992) Det nye energivurderingssytemet for drøvtyggere (FEm-systemet) og nye energinormer Faginfo. 13 545 552 (In Norwegian.)
- Tilman , D , Knops , J , Wedin , D , Reich , P , Ritchie , M and Siemann , E . (1997) . The influence of functional diversity and composition on ecosystem processes . Science , 277 : 1300 – 1302 .
- Torssell , BWR and Kornher , A . (1983) . Validation of a yield prediction model for temporary grasslands . Swedish J. Agric. Res. , 13 : 125 – 135 .
- Torssell , BWR , Kornher , A and Svensson , A . (1982) . Optimization of parameters in a yield prediction model for temporary grasslands . Swedish University of Agricultural Science, Department of Plant Husbandry , 112 : 33 pp
- van Dijk G (1991) The status of semi-natural grasslands in Europe In Goriup, P. D., Batten, L. A. & Norton, J. A. (Eds.) The conservation of lowland dry grassland birds in Europe Newsbury JNCC pp. 15–36
- Woledge , J . (1978) . The effect of shading during vegetative and reproductive growth on the photosynthetic capacity of leaves in a grass sward . Ann. Bot. , 42 : 1085 – 1089 .