
Abstract
To determine whether alternative electron flow (AEF) can replace the photosynthetic electron flow in cyanobacteria, we used an open O2-electrode system to monitor O2-exchange over a long period. In air-grown Synechocystis sp. PCC 6803 (S. 6803(WT)), the quantum yield of PSII, Y(II), held even after photosynthesis was suppressed by CO2 shortage. The S. 6803 mutant, deficient in flavodiiron (FLV) proteins 1 and 3, showed the same phenotype as S. 6803(WT). In contrast, Y(II) decreased in Synechococcus sp. PCC 7942 (S. 7942). These results suggest that AEF functioned as the Y(II) in S. 6803 and replaced the photosynthetic electron flux. In contrast, the activity of AEF in S. 7942 was lower. The affinity of AEF for O2 in S. 6803 did not correspond to those of FLVs in bacteria or terminal oxidases in respiration. AEF might be driven by photorespiration.
Graphical Abstract
Cyanobacterial species dependence of alternative electron flow to replace the electron Flux in Photosynthesis: a, Synechocystis (S. 6803); b, Synechococcus (S. 7942).
In photosynthesis, photon energy absorbed by photosystems I (PSI) and II (PSII) in thylakoid membranes oxidizes reaction-center chlorophylls, P700 in PSI and P680 in PSII, and drives the photosynthetic electron transport (PET) system. In PSII, H2O is oxidized to O2 and the oxidized P680 accepts electrons from H2O. Electrons originating in H2O are used to reduce the Cyt b6/f-complex through plastoquinone (PQ) in thylakoid membranes. In contrast, photooxidized P700 in PSI accepts electrons from the reduced Cyt b6/f complex through plastocyanin. Electrons produced during the photooxidation of P700 are used to produce NADPH through ferredoxin. Electron flow from H2O to NADPH is called photosynthetic linear electron flow (PLEF). In it, a proton gradient (ΔpH) is induced across the thylakoid membranes. ΔpH is the driving force in ATP production by ATP synthase, which is found in thylakoid membranes. Both the NADPH and the ATP produced by PLEF are used as chemical energy to regenerate ribulose 1,5-bisphosphate (RuBP) in the Calvin–Benson cycle.
Electron flux in PLEF responds to both photon energy and CO2.Citation1) Under low light conditions, the supply of photon energy to both photosystems in thylakoid membranes limits the electron flux in the PLEF. That is, the efficiency of utilization of light is high. On the other hand, under high light conditions, the supply of CO2 to RuBP carboxylase/oxygenase (Rubisco) limits the electron flux in the PLEF. That is, the efficiency of utilization of light is low. Furthermore, under low CO2 conditions, even a low supply of photon energy lowers the utilization efficiency of light, and this decreased efficiency of light utilization causes photoinhibition of PSII in the PLEF.Citation2)
Several studies have proposed that the cyanobacterium Synechocystis sp. PCC 6803 (S. 6803) possesses a system to alleviate PSII photoinhibition. This system is divided into four parts.
In the first part, excess photon energy not used in photosynthesis is dissipated as heat.Citation3–5) Orange carotenoid protein (OCP) is bound to phycobilisomes and absorbs photon energy from the phycobilisome. Excited OCP then returns to the ground state following heat dissipation that can be observed as nonphotochemical quenching (NPQ) of chlorophyll (Chl) fluorescence. A deficiency of the OCP protein in the S. 6803 mutant suppresses the NPQ of Chl fluorescence.Citation3–5) This mutant also suffers from photoinhibition of PSII as compared to wild-type S. 6803.Citation3–5) Furthermore, OCP-dependent dissipation of excess photon energy shows species dependency in cyanobacteria. In contrast to S. 6803, Synechococcus sp. PCC 7942 (S. 7942) does not have a gene coding for OCP and does not show any OCP-dependent NPQ of Chl fluorescence.Citation3–5)
In the second part, the light-harvesting capacity of PSI and PSII is regulated by the state transition,Citation6) a rapid change in configuration of the light-harvesting machinery from state I (or II) to state II (or I). State I is induced when PSI is photoexcited more than PSII. The phycobilisomes migrate to PSII and the light-harvesting efficiency of the PSII reaction center increases as compared to that of PSI. In contrast, in state II, the reverse occurs. That is, the state transition regulates the balance of both photosystems under fluctuating light environments, alleviating the accumulation of electrons in the PET system.Citation7)
In the third part, accumulation of electrons in the PET system resulting from the decreased efficiency of light utilization is suppressed by alternative electron flow (AEF). Under high light or low CO2 conditions, AEF functions with photosynthesis and induces oxidation of the PET system, alleviating PSII photoinhibition.Citation2) AEF includes the Mehler reaction and respiration (RES).Citation8) In the cyanobacterium S. 6803, the Mehler reaction is catalyzed by the flavodiiron protein (FLV) in PSI within the thylakoid membranes.Citation8) There are four isozymes of FLV in S. 6803, FLV1-4.Citation8) FLV1 and FLV3 catalyze the photoreduction of O2 in PSI.Citation8) Additionally, FLV2 and FLV4 are involved in the oxidation of the reducing side of PSII.Citation9,10) A deficiency in FLV2/4 in S. 6803 results in PSII photoinhibition and retarded growth under high light conditions.Citation9) The RES and PET systems function together in cyanobacterial thylakoid membranes.Citation11–16) Inhibition of oxidases (Cyt c oxidase and terminal oxidase) in RES leads to reduction of the PQ pool, stimulating photoinhibition of PSII.Citation13,14)
In the fourth part, a cyclic electron flow (CEF) around PSI functions as AEF in cyanobacteria.Citation17) CEF is catalyzed by NADH dehydrogenase (NDH), which contributes to the cellular CO2 concentration. CEF stimulates photosynthesis, which contributes to the protection of PSII from photoinhibition. In fact, a mutant of S. 6803 deficient in the CRR6, an assembly factor of NDH, is impaired with suppressed photosynthesis under high light conditions.Citation17)
Recently, photorespiration was proposed to function in S. 6803, which has a carbon recovery pathway different from that of higher plants.Citation18–20) In S. 6803 mutants deficient in photorespiratory enzymes, photosynthesis and cell growth are suppressed.Citation19) That is, photorespiration functions as the AEF in S. 6803.Citation18)
The ability to alleviate electron accumulation in the PET system of thylakoid membranes is defined as electron sink capacity. Evaluating electron sink capacity is essential to elucidate the physiological functions of AEF. Specific AEFs, including the Mehler reaction, respiration, and photorespiration, that can replace the electron flux in photosynthesis have not been identified in cyanobacteria. In this study, we developed an evaluation system to assay the electron sink capacity of the AEF in cyanobacteria by measuring photosynthetic O2 evolution and Chl fluorescence simultaneously. We used this assay method to determine the election sink capacities of S. 6803(WT) and S.6803 (ΔFLV) and to compare the electron sink capacities of S. 6803 with another cyanobacterial species, Synechococcus sp. PCC7942 (S. 7942). We gained insight into the molecular mechanisms and physiological functions of the AEF observed in the suppression of photosynthesis.
Materials and methods
Construction of a double mutant (S. 6803(ΔFLV)) deficient in FLV1/3
To extract total DNA from cyanobacteria, S. 6803(WT) cells were harvested by centrifugation at 10,000× g over 7 min and resuspended in 200 μL of TE buffer (pH 7.4) with 225 μL of phenol–chloroform and 10 μL of 10% SDS. The cells were homogenized by vortexing with glass beads. After centrifugation at 10,000× g for 15 min, the supernatant was concentrated by ethanol precipitation. The genomic regions encoding flv (flv1: sll1521, flv3: sll0550) were amplified by PCR with oligonucleotide primers (Supplemental Table 1; see Biosci. Biotechnol. Biochem. Web site) and cloned into the pTA2 vector (TOYOBO, Otsu, Japan). The recombinant plasmids were linearized and amplified by inverse PCR with oligonucleotide primers (Supplemental Table 1) and ligated with kanamycin and streptomycin resistance genes (Kanr, Smr) digested with SmaI from pUC4-KIXX and pRL453. The resulting plasmids were designated pΔsll1521::Kanr and pΔsll0550::Smr, respectively.
Transformation of S. 6803(WT) was carried out with plasmids pΔsll1521::Kanr and pΔsll0550::Smr by standard procedures.Citation21) The transformants were selected on 0.5% agar plates of BG-11 medium containing 20 μg mL−1 of kanamycin or 20 μg mL−1 of streptomycin. Furthermore, double-mutant Δsll1521/sll0550 (Δflv1/flv3) of S. 6803(ΔFLV) was generated by a second transformation of the Δsll1521 mutant with the mutated pΔsll0550::Smr. The transformant was selected on 0.5% agar plates of BG-11 medium containing 20 μg mL−1 of kanamycin and 20 μg mL−1 of streptomycin. Insertion of the antibiotic-resistance cassette at the targeted site was confirmed by PCR with oligonucleotide primers and total DNA extracted from the transformants as template (Supplemental Fig. 1).
Cultures of S. 6803(WT), S. 6803(ΔFLV), and S. 7942 and determination of Chl a
S. 6803(WT), S. 6803(ΔFLV), and S. 7942 were cultured in BG-11 mediumCitation22) on a rotary shaker (110 rpm) at 25 °C (16 h, 150 μmol photons m−2 s−1, fluorescent lamp)/23 °C (8 h, dark) in 2% CO2 (high CO2) or air. Cells at an arbitrary stage of growth (OD750 = 1.5–3.0) were harvested at 7 h in the dark by centrifugation at 10,000× g for 7 min and resuspended in fresh medium. Chl a in the cyanobacteria was determined by methods reported by de Marsac and HoumardCitation23).
Measurement of oxygen exchange
The uptake and evolution of O2 were measured simultaneously by Chl fluorescence. Oxygen exchange was monitored with an oxygen electrode with an open cuvette (Hansatech, King’s Lynn, UK). After incubation in the dark for 10 min under air-equilibrated conditions, the reaction mixture (2 mL), containing 50 mM HEPES-KOH (pH 7.6) and an arbitrary amount of cells (10 μg Chl mL−1), was illuminated with actinic light (AL) (red light (RL), >640 nm) at the indicated light intensity at 25 °C. To determine the O2 evolution rate, the reaction cuvette was closed at the steady state. During the measurements, the reaction mixture was mixed with a magnetically controlled microstirrer.
Measurement of Chl fluorescence
The fluorescence yield originating from Chl a was measured with a PAM-Chl fluorometer (PAM-101; Walz, Effeltrich, Germany). Pulse-modulated excitation was obtained from an LED lamp with peak emission at 650 nm. Modulated fluorescence was measured at λ > 710 nm (Schott RG9 long-pass filter). The steady-state fluorescence yield (Fs) was monitored at several intensities of RL and 1000-ms pulses of saturated light (5000 μmol photons m−2 s−1) were supplied at arbitrary intervals to determine maximum variable fluorescence (Fm′). The relative quantum yield of PSII, that is, Y(II) was defined as (Fm′ − Fs)/Fm′. The terminology used in this study of fluorescence is that recommended by van Kooten and SnelCitation24). NPQ of Chl fluorescence was calculated as (Fm/Fm′ − 1).Citation25) Photochemical quenching (qL) of Chl fluorescence was calculated as (1 − (Fm − Fo)/Fm)/((Fm − Fo)/Fm) * (Y(II)/(1 − Y(II)) * (NPQ + 1).Citation25)
Fluorescence emission spectra at 77K
Cyanobacterial cells (100 μL) were sampled from the reaction mixture in an O2-electrode chamber with a micropipette and injected into glass rod tubes that were plunged into liquid nitrogen within 3 s of sampling. Fluorescence emission spectra at 77 K were measured with a spectrofluorometer (Jasco FP-6600/PMU-183).Citation26) The excitation wavelength was 600 nm, at which phycobilisomes are mainly excited.
Results and discussion
Effects of decreased photosynthetic activity on the electron flux in PSII
Electron transport reaction activities in the PLEF, including photosynthesis, the Mehler reaction, respiration, and photorespiration, are reflected in the electron flux of PSII in thylakoid membranes. Hence, we measured O2 exchange and Chl fluorescence simultaneously in cyanobacterial cells. To determine whether AEF can replace the electron flux in photosynthesis, we used an open system for the reaction mixture, since CO2 depletion in the reaction mixture takes a long time during photosynthesis. That is, in a closed system, the amount of O2 evolved in photosynthesis rapidly exceeds the upper limit of detection by the O2 electrode, whereas the open system allows the concentration of O2 ([O2]) to equilibrate with atmospheric O2.
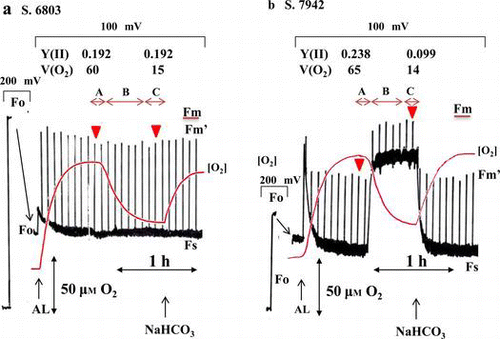
In air-grown S. 6803(WT), the O2 concentration reached steady state (phase A) during illumination with AL under atmospheric CO2/O2 conditions (Fig. (a)). During the increase in [O2] to phase A, the O2 solution rate into the reaction mixture equilibrated with both the O2 release rate outside the reaction mixture and the net photosynthetic O2 evolution rate in the reaction mixture. The rate of photosynthetic O2 evolution in phase A was determined by closing the reaction mixture in the O2 electrode under illumination. The O2 evolution rate was 60 ± 2 (n = 6) μmol O2 (mg Chl)−1 h−1 in S. 6803(WT). Over time, [O2] decreased to a new steady-state level of photosynthetic activity (phase C, Fig. (a)). Phase B was defined as a transition phase of photosynthetic activity from phase A to phase C. The time required for the transition from phase A to phase C reflected the transition time to equilibrate O2 exchange in the reaction mixture. The O2 evolution rate in phase C was 15 ± 2 (n = 6) μmol O2 (mg Chl)−1 h−1 in S. 6803(WT). The addition of 10 mM NaHCO3 to the reaction mixture at phase C increased the O2 evolution rate to that of phase A (Fig. (a)). That is, the transition from phase A to C was due to depletion of CO2 by photosynthesis in the reaction mixture. Theoretically, the total concentration of CO2 in the reaction mixture at pH 7.6 should have been about 300 μM, where both CO2 and were the main forms, under an atmospheric CO2 concentration of 40 Pa.Citation27) The cyanobacteria used both CO2 and
in the reaction mixture as substrates for photosynthesis that were supplied from the atmospheric CO2 in phase C. That is, the photosynthetic O2 evolution rate was limited by the CO2 supply from the atmosphere because the addition of NaHCO3 stimulated photosynthesis in phase C.
Fig. 1. Effects of CO2 on photosynthetic activity and Chl fluorescence in air-grown cyanobacteria.
Notes: (a) Synechocystis sp. PCC 6803 (S. 6803(WT)); (b) S. 6803(ΔFLV); (c) Synechococcus sp. PCC 7942 (S. 7942). Reaction mixtures containing the cyanobacteria (10 μg Chl mL−1) were illuminated with AL (160 μmol photons m−2 s−1) at the indicated time. The red line shows the concentration of O2 [O2], and the black line shows the yield of Chl fluorescence. At the indicated time, 10 mM NaHCO3 was added to the reaction mixture. Phases A and C show the steady state, in which [O2] was constant at maximum and minimum, respectively. Phase B was the phase transition from phase A to C. To expand the Chl fluorescence signal after illumination with AL, sensitivity was increased from 200 to 100 mV. The minimum Chl fluorescence yield (Fo) was shown in the sensitivity at 200 mV from zero to the Fo signal, and then in 100 mV sensitivity. All experiments were conducted six times, and typical data are shown. Y(II), quantum yield of PSII at phases A and C; V(O2), O2-evolution rate (μmol O2 mg Chl−1 h−1) at phases A and C. Red arrowheads, when both Y(II) and V(O2) were determined. The maximum Chl fluorescence yield (Fm) was determined by the addition of DCMU, and it is shown by a bar.
![Fig. 1. Effects of CO2 on photosynthetic activity and Chl fluorescence in air-grown cyanobacteria.Notes: (a) Synechocystis sp. PCC 6803 (S. 6803(WT)); (b) S. 6803(ΔFLV); (c) Synechococcus sp. PCC 7942 (S. 7942). Reaction mixtures containing the cyanobacteria (10 μg Chl mL−1) were illuminated with AL (160 μmol photons m−2 s−1) at the indicated time. The red line shows the concentration of O2 [O2], and the black line shows the yield of Chl fluorescence. At the indicated time, 10 mM NaHCO3 was added to the reaction mixture. Phases A and C show the steady state, in which [O2] was constant at maximum and minimum, respectively. Phase B was the phase transition from phase A to C. To expand the Chl fluorescence signal after illumination with AL, sensitivity was increased from 200 to 100 mV. The minimum Chl fluorescence yield (Fo) was shown in the sensitivity at 200 mV from zero to the Fo signal, and then in 100 mV sensitivity. All experiments were conducted six times, and typical data are shown. Y(II), quantum yield of PSII at phases A and C; V(O2), O2-evolution rate (μmol O2 mg Chl−1 h−1) at phases A and C. Red arrowheads, when both Y(II) and V(O2) were determined. The maximum Chl fluorescence yield (Fm) was determined by the addition of DCMU, and it is shown by a bar.](/cms/asset/fb4f0db8-d697-47c9-bf43-189d6b04ac82/tbbb_a_882745_f0001_oc.gif)
In contrast, the quantum yield of PSII (Y(II)) (= 0.192), reflecting the relative electron flux in PSII, did not change during the phase transition (Fig. (a)). These results indicate that although the photosynthetic rate in phase C decreased to 25% of that in phase A, Y(II) was maintained. That is, the electron flux in PSII comprised the electron fluxes of suppressed photosynthesis and the induced AEF, and the induced AEF replaced the electron flux in photosynthesis observed in phase A.
Next, we evaluated AEF activity in the mutant (S. 6803(ΔFLV)) that was deficient in both FLV1 and FLV3, which catalyze the Mehler reaction.Citation8) Just as in air-grown S. 6803(WT), although photosynthesis was suppressed during the phase transition from A to C, the relative electron flux in PSII was maintained (Fig. (b)). These results indicate that an AEF, distinct from the Mehler reaction catalyzed by FLV1/3, replaced the photosynthetic electron flux in S. 6803(WT).
Next, AEF activity was evaluated in S. 7942. Differently from S. 6803(WT) and S. 6803(ΔFLV), suppression of photosynthesis during the phase transition induced an increase in Fs and a decrease in Y(II), from 0.238 to 0.099, which indicates a decrease in the photochemical quenching (qL) of Chl fluorescence.Citation25) Decrease in qL indicates an accumulation of electrons in the PET system. Compared with phase A, the electron flux in PSII decreased in phase C, and the PET system was reduced. Furthermore, AEF activity must have been lower as compared to S. 6803(WT) and S. 6803(ΔFLV).
We evaluated the activities of AEF in S. 6803(WT) and S. 6803(ΔFLV) grown under high CO2 (HC) conditions. Photosynthetic O2-evolution and Chl fluorescence were monitored under air-equilibrated conditions. In HC-grown S. 6803(WT) and S. 6803(ΔFLV), photosynthetic activities decreased from phase A to phase C (Fig. (a) and (b)), similarly to air-grown cells. In contrast, the Y(II) of HC-grown cells responded differently from the phase transition of air-grown cells (Fig. (a) and (b)). In S. 6803(WT) and S. 6803(ΔFLV), decreases in the Y(II) and increases in the Fs were transient during the phase transition from A to C. After the phase transition, the Y(II) recovered to about 80% of the value obtained in phase A. Fs also decreased. These results suggest that AEF, which has the capacity to replace the electron flux in photosynthesis during phase A, was induced during the phase transition in both HC-grown S. 6803(WT) and S. 6803(ΔFLV).
Fig. 2. Effects of CO2 on photosynthetic activity and Chl fluorescence in cyanobacteria grown under high-CO2 conditions.
Notes: (a) S. 6803(WT); (b) S. 6803(ΔFLV); (c) S. 7942. Reaction mixtures containing cyanobacteria (10 μg Chl mL−1) were illuminated with AL (160 μmol photons m−2 s−1) at the indicated times. The red line shows [O2], and the black line indicates the yield of Chl fluorescence. At the indicated times, 10 mM NaHCO3 was added to the reaction mixture. To expand the Chl fluorescence signal after illumination with AL, sensitivity was increased from 200 to 100 mV. Fo signals are shown as in Fig. . All experiments were conducted six times, and typical data are shown. Y(II), quantum yield of PSII at phases A, B, and C; V(O2), O2-evolution rate (μmol O2 mg Chl−1 h−1) at phases A and C. Red arrowhead, when both Y(II) and V(O2) were determined. Maximum Chl fluorescence yield (Fm) was determined by the addition of DCMU, and is shown by a bar.
![Fig. 2. Effects of CO2 on photosynthetic activity and Chl fluorescence in cyanobacteria grown under high-CO2 conditions.Notes: (a) S. 6803(WT); (b) S. 6803(ΔFLV); (c) S. 7942. Reaction mixtures containing cyanobacteria (10 μg Chl mL−1) were illuminated with AL (160 μmol photons m−2 s−1) at the indicated times. The red line shows [O2], and the black line indicates the yield of Chl fluorescence. At the indicated times, 10 mM NaHCO3 was added to the reaction mixture. To expand the Chl fluorescence signal after illumination with AL, sensitivity was increased from 200 to 100 mV. Fo signals are shown as in Fig. 1. All experiments were conducted six times, and typical data are shown. Y(II), quantum yield of PSII at phases A, B, and C; V(O2), O2-evolution rate (μmol O2 mg Chl−1 h−1) at phases A and C. Red arrowhead, when both Y(II) and V(O2) were determined. Maximum Chl fluorescence yield (Fm) was determined by the addition of DCMU, and is shown by a bar.](/cms/asset/61bfef2d-a106-4de5-a37a-2ae661a6ae47/tbbb_a_882745_f0002_oc.gif)
Next, we evaluated the AEF activity of HC-grown S. 7942. Differently from HC-grown S. 6803(WT) and S. 6803(ΔFLV), Y(II) in S. 7942 decreased during the phase transition (Fig. (c)) in a manner similar to air-grown S. 7942. Additionally, during the transition, the Fs of Chl fluorescence also increased, indicating a decrease in qL. That is, as photosynthetic activity decreased, the PET system in S. 7942 was reduced, similar to air-grown cells. The AEF in HC-grown S. 7942 did not replace the electron flux during photosynthesis in phase A.
Dependence of Y(II) on the O2 concentration in phase C
We found that the electron flux of the AEF in phase C replaced the photosynthetic electron flux in phase A in both S. 6803(WT) and S. 6803(ΔFLV) (Figs. and ). Next, we studied the dependence of Y(II) in phase C on [O2] in order to elucidate the molecular mechanisms of the AEF. In air-grown S. 6803(WT) and S. 6803(ΔFLV), the relative electron flux in PSII, JII(rel) = Y(II) × PFD, decreased with decreases in [O2] from air-equilibrated conditions (about 250 μM; Fig. (a)). At an AL intensity of 160 μmol photons m−2 s−1, the apparent Michaelis constant (Km) of the JII(rel) for O2 was about 15 μM. Furthermore, an increase in light intensity enhanced the JII(rel). The Km for O2 increased to about 40 μM at 560 μmol photons m−2 s−1, under which the JII(rel) did not saturate against the AL intensity (Fig. (b)). In air-grown S. 7942, the apparent Km of the JII(rel) for O2 was about 1 μM (Fig. (a)). The dependence of the JII(rel) on O2 did not respond to an increase in the AL intensity from 160 to 560 μmol photons m−2 s−1 (Fig. (b)). These results indicate that an electron flux not related to photosynthesis in phase C required O2 for the turnover in S. 6803(WT), S. 6803(ΔFLV), and S. 7942. Furthermore, the O2-dependent electron flux in S. 7942 was much lower than that in either S. 6803 species.
Fig. 3. Effects of O2 on the relative electron flux in PSII [JII(rel) = Y(II) × PFD] in phase C in air-grown cyanobacteria S. 6803(WT), S. 6803(ΔFLV), and S. 7942.
Notes: (a) [O2] in the reaction mixture in phase C was changed from [O2] equilibrated with the atmosphere (250 μM) to lower values by bubbling the reaction mixture with N2 gas. Y(II) was measured under AL (160 μmol photons m−2 s−1), as described in “materials and methods.” Symbols: squares, S. 6803(WT); circles, S. 6803(ΔFLV); triangles, S. 7942. (b) [O2] in the reaction mixture in phase C was changed, as described in above. Y(II) of S. 6803(WT) and S. 7942 were measured under AL (160 and 560 μmol photons m−2 s−1), as described in “materials and methods.” Symbols: squares, 160 μmol photons m−2 s−1; circles, 560 μmol photons m−2 s−1. Vertical bars represent SDs (n = 3).
![Fig. 3. Effects of O2 on the relative electron flux in PSII [JII(rel) = Y(II) × PFD] in phase C in air-grown cyanobacteria S. 6803(WT), S. 6803(ΔFLV), and S. 7942.Notes: (a) [O2] in the reaction mixture in phase C was changed from [O2] equilibrated with the atmosphere (250 μM) to lower values by bubbling the reaction mixture with N2 gas. Y(II) was measured under AL (160 μmol photons m−2 s−1), as described in “materials and methods.” Symbols: squares, S. 6803(WT); circles, S. 6803(ΔFLV); triangles, S. 7942. (b) [O2] in the reaction mixture in phase C was changed, as described in above. Y(II) of S. 6803(WT) and S. 7942 were measured under AL (160 and 560 μmol photons m−2 s−1), as described in “materials and methods.” Symbols: squares, 160 μmol photons m−2 s−1; circles, 560 μmol photons m−2 s−1. Vertical bars represent SDs (n = 3).](/cms/asset/9a342b64-7ab9-420e-83e4-17a116023dea/tbbb_a_882745_f0003_b.gif)
We concluded that the FLV1/3 proteins were not the main enzymes driving the O2-dependent AEF in phase C of S. 6803(WT). In phase C of S. 6803(WT), the Km values for JII(rel.) were larger than those of FLV proteins in the bacteria.Citation28) The FLV proteins having high homology with Flv in bacteria had Km values for O2 less than 2 μM and high affinity for O2.Citation28) In addition to the FLV proteins, four terminal oxidases, PTOX, which is sensitive to propyl gallate, cytochrome oxidase (COX; CtaI), secondary terminal oxidase (CtaII), and putative cytochrome bd-type quinol oxidase (Cyd), are thought to function in the in vivo respiratory pathway and to have Km values for O2 of less than 1 μM.Citation12,16,29) Therefore, the contributions of these molecular mechanisms to driving O2-dependent AEF might be lower. Recently photorespiration was reported to function in cyanobacteria.Citation18,19) To elucidate its functioning in phase C, it is necessary to test whether mutants deficient in the photorespiratory pathway can keep Y(II) in phase C.
Dependence of the Y(II) on the O2 concentration in phase A
We found that AEF functioning in phase C depended on O2. Next, we studied to determine whether electron flow in phase A also requires O2 for its activity. The dependence of Y(II) on O2 in HC- and air-grown S. 6803(WT), S.6803(ΔFLV), and S. 7942 was analyzed in phase A. Reaction mixtures were bubbled with N2 gas. Replacement of the gas in the reaction mixture with N2 gas did not affect Y(II) in air-grown S. 6803(WT) or S.6803(ΔFLV) (Fig. (a) and (c)), but Y(II) in air-grown S. 7942 was suppressed (Fig. (e)). Furthermore, N2-bubbling of the reaction mixture did not affect Y(II) in HC-grown S. 6803(WT) or S.6803(ΔFLV) (Fig. (b) and (d)), but unlike air-grown S. 7942, Y(II) in HC-grown S. 7942 was not suppressed (Fig. (f)). These results indicate that O2-dependent electron flow did not function in photosynthesis in phase A in the S. 6803 species, but did function in air-grown S. 7942. That is, O2-dpendent AEF must have been induced in the air-grown S. 7942.
Fig. 4. Effects of O2 on the quantum yield of PSII (Y(II)) in the induction of photosynthesis in S. 6803(WT), S. 6803(ΔFLV), and S. 7942.
Notes: Reaction mixtures containing cyanobacteria (10 μg Chl mL−1) were illuminated with AL (160 μmol photons m−2 s−1) at the indicated times. The red line shows the concentration of O2 [O2], and the black line shows the yield of Chl fluorescence. At the indicated times, the reaction mixture was bubbled with N2 gas. Fo signals are shown as in Fig. . Y(II) was measured under AL (160 μmol photons m−2 s−1), as described in “materials and methods.” Red arrowhead, when Y(II) was determined. All experiments were conducted six times, and typical data are shown. (a) air-equilibrated S. 6803(WT); (b) N2-equilibrated S. 6803(WT); (c) air-equilibrated S. 6803(ΔFLV); (d) N2-equilibrated S. 6803(ΔFLV); (e) air-equilibrated S. 7942; (f) N2-equilibrated S. 7942.
![Fig. 4. Effects of O2 on the quantum yield of PSII (Y(II)) in the induction of photosynthesis in S. 6803(WT), S. 6803(ΔFLV), and S. 7942.Notes: Reaction mixtures containing cyanobacteria (10 μg Chl mL−1) were illuminated with AL (160 μmol photons m−2 s−1) at the indicated times. The red line shows the concentration of O2 [O2], and the black line shows the yield of Chl fluorescence. At the indicated times, the reaction mixture was bubbled with N2 gas. Fo signals are shown as in Fig. 1. Y(II) was measured under AL (160 μmol photons m−2 s−1), as described in “materials and methods.” Red arrowhead, when Y(II) was determined. All experiments were conducted six times, and typical data are shown. (a) air-equilibrated S. 6803(WT); (b) N2-equilibrated S. 6803(WT); (c) air-equilibrated S. 6803(ΔFLV); (d) N2-equilibrated S. 6803(ΔFLV); (e) air-equilibrated S. 7942; (f) N2-equilibrated S. 7942.](/cms/asset/f0d72a26-756c-4a17-ad7e-cbc744a2c8c5/tbbb_a_882745_f0004_oc.gif)
Maximum photosynthetic activity in phases A and C
Next, we investigated to determine whether depletion of CO2 in phase C would affect maximum photosynthetic activity. We compared the O2-evolution rates of phases A and C in the presence of saturating amounts of NaHCO3 (10 mM) by closing the reaction mixture. Adding NaHCO3 to the mixture increased [O2] in phase A for S. 6803(WT) (Fig. (a)). The initial rate of increase in [O2] was defined as maximum photosynthetic activity. In phase A, the initial rate was maintained for at least 3 min, but in phase C the rate of increase in [O2] was enhanced after the addition of NaHCO3 (Fig. (a)). In S. 6803(WT), maximum photosynthetic activity decreased in phase C even in the presence of NaHCO3. It was estimated to be 42 ± 2 μmol O2 (mg Chl)−1 h−1 (n = 3). Thus maximum photosynthetic activity in phase C was suppressed to about 80% of that in phase A. Similar to S. 6803(WT), the maximum photosynthetic activity in phase C of S. 6803(ΔFLV) was suppressed to about 80% of that in phase A (Fig. (b)).
Fig. 5. Maximum photosynthetic activity in phases A and C in air-grown cyanobacteria.
Notes: (a) S. 6803(WT); (b) S. 6803(ΔFLV); (c) S. 7942. The activation states in phases A and C were determined as described in the text. At the indicated times, 10 mM NaHCO3 was added to the reaction mixture. Black line, phase A; red line, phase C; dotted red line, initial slope of the increase in [O2] in phase C. Numbers beside the lines show the O2 evolution rate. All experiments were conducted three times, and typical data are shown.
![Fig. 5. Maximum photosynthetic activity in phases A and C in air-grown cyanobacteria.Notes: (a) S. 6803(WT); (b) S. 6803(ΔFLV); (c) S. 7942. The activation states in phases A and C were determined as described in the text. At the indicated times, 10 mM NaHCO3 was added to the reaction mixture. Black line, phase A; red line, phase C; dotted red line, initial slope of the increase in [O2] in phase C. Numbers beside the lines show the O2 evolution rate. All experiments were conducted three times, and typical data are shown.](/cms/asset/084440fb-3ed3-4058-b302-d49f52958d8d/tbbb_a_882745_f0005_oc.gif)
In contrast, the addition of 10 mM NaHCO3 induced a slow increase in [O2] in S. 7942 in phase C (Fig. (c)). The rate became constant at about 2 min after the addition of NaHCO3. Subsequently, the O2-evolution rate was equal to that in phase A. The slope of the initial increase (red dotted line) was about 15 ± 2 μmol O2 (mg Chl)−1 h−1 (n = 3), about 30% of the photosynthetic rate in phase A. That is, maximum photosynthetic activity was suppressed to about 30% of the level in phase A, a larger suppression than for S. 6803(WT) or 6803(ΔFLV).
Why the maximum photosynthetic activity in phase C of S. 7942 was lower than that of S. 6803 is unknown. In higher plants, O2-dependent AEF, the Water–Water Cycle, proposed perhaps to functions in the supply of ATP to the Calvin cycle by inducing ΔpH across thylakoid membranes in chloroplasts.Citation2) ATP is utilized to regenerate RuBP in the Calvin-cycle to support photosynthesis. In S. 6803, O2-dependent AEF might contribute to the regeneration of RuBP, in addition to the functioning of the electron sink.
Comparison of electron flux in PSII during the induction of photosynthesis
Both FLV1 and FLV3 might function in the Mehler reaction in S. 6803(WT).Citation8) In the steady state, phases A and C, there was no difference in Chl fluorescence between S. 6803(WT) and S. 6803(ΔFLV) (Figs. and ). Thus, in that state, FLV-dependent electron flow may be negligible compared with photosynthesis-dependent electron flow.
Next, we compared electron flux in PSII during the induction of photosynthesis among S. 6803(WT), S. 6803(ΔFLV), and S. 7942 (Fig. ). In S. 6803(WT), illumination of the reaction mixture with AL induced an increase in the Fs of Chl fluorescence. Then, the Fs decreased to the steady state, concomitantly with an increase in the Y(II), reflecting the induction of photosynthesis (Fig. (a)). Under N2 conditions, illumination of the reaction mixture with AL induced higher increases in the Fs than that under air-equilibrated conditions. The Fs gradually decreased to the steady state, finally reaching the same Y(II) as under air-equilibrated conditions (Fig. (b)). These results indicate that O2-dependent electron flow functioned in the induction of photosynthesis under air-equilibrated conditions.
Fig. 6. Comparison of the electron fluxes in PSII induces by photosynthesis in air-grown cyanobacteria.
Notes: Chl fluorescence yields of (a) S. 6803(WT), (c) S. 6803(ΔFLV), and (e) S. 7942 were monitored in reaction mixtures containing 10 mM NaHCO3. At the indicated times, AL was turned on. Chl fluorescence yields of (b) S. 6803(WT), (d) S. 6803(ΔFLV), and (f) S. 7942 were monitored under N2 conditions, in which a reaction mixture containing 10 mM NaHCO3 was bubbled with N2 gas. At the indicated times, AL was turned on. In (f), N2 bubbling was stopped at the indicated times for S. 7942. Fo signals are as in Fig. . Voltage indicates sensitivity in recording Chl fluorescence signals. To expand the Chl fluorescence signal after AL illumination, sensitivity was increased from 200 to 100 mV. All experiments were conducted three times, and typical data are shown. Y(II), quantum yield of PSII. Red arrowhead, when Y(II) was determined.
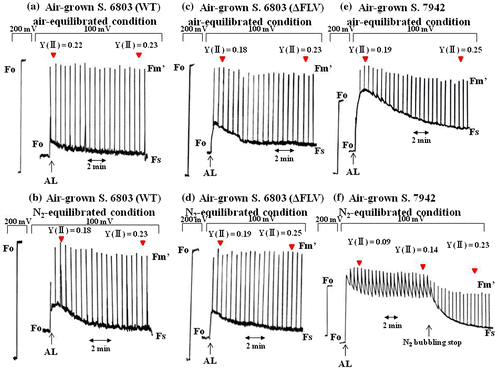
Differently from S. 6803(WT), Fs and Y(II) showed almost the same level between air-equilibrated and N2 conditions in S. 6803(ΔFLV) (Fig. (c) and (d)). These results suggest that O2-dependent electron flow did not function, indicating that FLV1 and FLV3 functioned in the induction of photosynthesis under air-equilibrated conditions. This finding is consistent with the results of Helman et al. and Allahverdiyeva et al.Citation8,18)
In S. 7942 (Fig. (e) and (f)), the N2 condition suppressed both the increase in Y(II) and the decrease in Fs. The exchange of N2-gas with air in the reaction mixture enhanced Y(II) and lowered Fs (Fig. (f)). These results indicate that O2-dependent electron flow functioned in the induction of photosynthesis and oxidized the PET system, similar to S. 6803(WT).
Relationships between phase transition and state transition
We observed changes in Fm′ during AL illumination. Especially, during the phase transitions in HC-grown S. 6803(WT) and S. 6803(ΔFLV), Fm′ increased transiently (Figs. (a) and 2(b)). Furthermore, S. 7942 showed a greater increase in the Fm′ in phase C than in phase A (Figs. (c) and (c)).
The state transition regulates the light-harvesting efficiency of photon energy by PSII and PSI.Citation30) State I is induced when PSI is photoexcited more than PSII. Fm′ in state I is higher than in state II. For state II, the reverse occurs.
Next, we measured the fluorescence emission spectra of cyanobacteria at 77 K to distinguish between the two states during the phase transition from A to C. Emission spectra were obtained with 600 nm excitation light that was absorbed mainly by the phycobilisomes and not primarily by chlorophyll. The emission spectra were normalized at 725 nm, the peak due to Chl fluorescence in PSI. The emission peak at 695 nm was due to Chl fluorescence in PSII. If a state transition occurs from state I to state II, the normalized fluorescence intensity (NFI) at 695 nm should decrease. Furthermore, if the reverse transition occurs, NFI would be expected to increase. In the dark, the PQ pool in the PET system in cyanobacteria was reduced by respiratory electron flow. Hence, PET system was in state II (Fig. (a) and (b)). In the presence of DCMU, illumination by AL of the cyanobacterial cells induced a state transition from state II to state I, because the PQ pool was oxidized. NFI at 695 nm was higher than in state II. In S. 6803 as compared to 690 nm, the peak at 695 nm increased in state I. In S. 7942, two peaks, at 685 and 695 nm, increased in state I.
Fig. 7. Fluorescence emission spectra at 77 K.
Notes: Cyanobacteria cells were excited at 600 nm, and the spectra were normalized to the intensity of the fluorescence peak at 725 nm (PSI peak). Cyanobacteria cells were sampled in the dark (black line) and under AL (blue line), and were collected to measure the 77 K fluorescence emission spectra. (a) HC-grown S. 6803(WT); (b) HC-grown S. 7942. Under photosynthetic conditions in phases A, B, and C, cells were collected to measure the 77 K fluorescence emission spectra. Red line, phase A; blue line, phase B; green line, phase C. (c) Air-grown S. 6803(WT); (d) HC-grown S. 6803(WT); (e) air-grown S. 6803(ΔFLV); (f) HC-grown S. 6803(ΔFLV); (g) air-grown S. 7942; (h) HC-grown S. 7942.
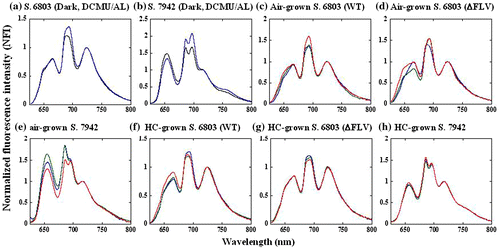
In air-grown S. 6803(WT), the NFI at 695 nm of the emission spectra obtained in phases A, B, and C were almost identical (Fig. (c)). These NFI were close to that in the dark (Fig. (a)), indicating S. 6803(WT) was in state II during the phase transition. Furthermore, HC-grown S. 6803(WT) had almost the same NFI at 695 nm in phases B and C (Fig. (f)), and the NFI at 695 nm in phase A was slightly higher than those in phases B and C. In phase C, a state transition can occur from state I to state II, but the Fm′ did not change between phases A and C (Fig. ). In the air-grown S. 6803(ΔFLV), there was no state transition during the phase transition from A to C through B (Fig. (d)), similar to the air-grown S. 6803(WT). The spectra of HC-grown S. 6803(ΔFLV) were not different in phases A and C (Fig. (g)). The NFI at 695 nm in phase B was slightly lower than those in phases A and C, but the Fm′ in phase B was slightly higher than in phase C. These data indicate that the change in Fm′ did not reflect the state transition under the steady-state condition during the phase transition. We found that the phycobilisome-dependent fluorescence (peak at 660 nm) differed between phases A, B, and C. At this time, the molecular basis for this difference remains unknown.
In S. 7942, the emission spectra were normalized at 725 nm. If a transition from state I to state II occurred, the NFI at 695 nm should have decreased. In the air-grown S. 7942, there was no evident state transition between phases A, B, and C (Fig. (e)). S. 7942 was in state II during the phase transition. This result is not consistent with the results obtained for S. 7942, because the Fm′ increased from phase A to C (Figs. and ). By contrast, in the HC-grown S. 7942, the NFI at 685 nm in phase B and C were higher than those in phases A and B, while the NFI at 695 nm was almost identical in phases B and C. These data indicate that the state transition was not related to the increase in Fm′ during the phase transitions from A to C through B.
Conclusion
We have summarized the characteristics of AEF that compensated for the decrease in photosynthesis in S. 6803 but not in S. 7942 by analyzing photosynthesis activities (Fig. ). Both cyanobacteria showed suppression of photosynthesis due to depletion of CO2 (Fig. (a)). The decrease in photosynthetic activity did not depend on the difference in [CO2] in their growth conditions, high- and air-levels of CO2. In S. 7942, the responses of the photosynthetic electron transport rate (ETR), which was evaluated as Y(II), and the reduction–oxidation level of the PQ pool, which was evaluated as qL (see “Materials and Methods”), to the suppression of photosynthesis did not depend on the difference in [CO2] in their growth conditions (Fig. (c–f)). In S. 7942, ETR decreased with decreases in photosynthesis (Fig. (c) and (e)). The PQ pool was reduced (Fig. (d) and (f)). On the other hand, S. 6803 showed AEF, which compensated for the decrease in photosynthesis (Fig. (c) and (e)). The expression of AEF activity did depend on the difference in [CO2] in their growth conditions, differently from the photosynthetic activity (Fig. (b)). Although photosynthetic activity decreased with CO2 depletion in the air-grown S. 6803, ETR and the oxidation level of the PQ pool remained at high levels (Fig. (c) and (d)). On the other hand, in the HC-grown S. 6803, after the decrease in ETR with photosynthesis, ETR recovered to the original value observed at high CO2 (Fig. (e)). The reduced state of the PQ pool was also repaired with the increase in ETR after CO2 depletion by photosynthesis (Fig. (f)). Based on these analyses of steady-state photosynthesis, we identified different responses to CO2 depletion of ETR in the cyanobacteria: the first one (S. 6803) had AEF to compensate for the decrease in photosynthesis activity, while the second one (S. 7942) did not.
Fig. 8. Responses of photosynthesis, ETR, and PQ pool to suppressed photosynthesis in S. 6803 and S. 7942.
Notes: (a) CO2 depletion by photosynthesis. Changes in [CO2] are shown after the start of illumination to cyanobacterial cells. (b) Suppression of photosynthetic activity due to CO2 depletion. Changes in photosynthetic activity are shown. Upon illumination to cyanobacterial cells, [CO2] was high enough to support high photosynthetic activity. As photosynthesis proceeded, CO2 was consumed and [CO2] started to decrease with decreases in photosynthetic activity. Line, S. 6803; dotted line, S 7942. (c) Changes in the ETR due to the suppression of photosynthesis in the air-grown cells. Line, S. 6803; dotted line, S 7942. (d) Changes in the reduction–oxidation level of PQ-pool due to the suppression of photosynthesis in the air-grown cells. Line, S. 6803; dotted line, S 7942. (e) Changes in the ETR due to the suppression of photosynthesis in HC-grown cells. Line, S. 6803; dotted line, S 7942. (f) Changes in the reduction–oxidation level of the PQ pool due to the suppression of photosynthesis in HC-grown cells. Line, S. 6803; dotted line, S 7942.
![Fig. 8. Responses of photosynthesis, ETR, and PQ pool to suppressed photosynthesis in S. 6803 and S. 7942.Notes: (a) CO2 depletion by photosynthesis. Changes in [CO2] are shown after the start of illumination to cyanobacterial cells. (b) Suppression of photosynthetic activity due to CO2 depletion. Changes in photosynthetic activity are shown. Upon illumination to cyanobacterial cells, [CO2] was high enough to support high photosynthetic activity. As photosynthesis proceeded, CO2 was consumed and [CO2] started to decrease with decreases in photosynthetic activity. Line, S. 6803; dotted line, S 7942. (c) Changes in the ETR due to the suppression of photosynthesis in the air-grown cells. Line, S. 6803; dotted line, S 7942. (d) Changes in the reduction–oxidation level of PQ-pool due to the suppression of photosynthesis in the air-grown cells. Line, S. 6803; dotted line, S 7942. (e) Changes in the ETR due to the suppression of photosynthesis in HC-grown cells. Line, S. 6803; dotted line, S 7942. (f) Changes in the reduction–oxidation level of the PQ pool due to the suppression of photosynthesis in HC-grown cells. Line, S. 6803; dotted line, S 7942.](/cms/asset/30bdfa6e-5b80-4ec9-b62b-a844e35f2747/tbbb_a_882745_f0008_oc.gif)
The molecular and induction mechanisms of AEF in S. 6803 should be elucidated in order to understand the physiological functions. Although S. 7942 does not have AEF to compensate for suppressed photosynthesis, S. 7942 survives in nature. In the evolution of cyanobacteria, the absence of AEF has not represented selection pressure for S. 7942. A comparative analysis of S. 6803 and S. 7942 as to the responses of the photosynthetic machinery to photo-oxidative stress might elucidate the physiological significance of the AEF in S. 6803.
Supplemental material
The supplemental material for this paper is available at http://dx.doi.org/10.1080/09168451.2014.882745.
Supplemental Fig.1
Download PDF (115.7 KB)Supplemental Table 1
Download PDF (61 KB)Related Research Data
References
- von Caemmerer S. Biochemical models of leaf photosynthesis. Collingwood, Australia: CSIRO Publishing; 2000.
- Asada K. The water-water cycle in chloroplasts: scavenging of active oxygens and dissipation of excess photons. Annu. Rev. Plant Physiol. Plant Mol. Biol. 1999;50:601–639.10.1146/annurev.arplant.50.1.601
- Boulay C, Abasova L, Six C, Vass I, Kirilovsky D. Occurrence and function of the orange carotenoid protein in photoprotective mechanisms in various cyanobacteria. Biochim. Biophys. Acta. Bioenerg. 2008;1777:1344–1354.10.1016/j.bbabio.2008.07.002
- Kirilovsky D, Kerfeld CA. The orange carotenoid protein in photoprotection of photosystem II in cyanobacteria. Biochim. Biophys. Acta. 2012;1817:158–166.10.1016/j.bbabio.2011.04.013
- Gwizdala M, Wilson A, Omairi-Nasser A, Kirilovsky D. Characterization of the Synechocystis PCC 6803 fluorescence recovery protein involved in photoprotection. Biochim. Biophys. Acta. 2012;15:348–354.
- Mullineaux CW, Emlyn-Jones D. State transitions: an example of acclimation to low-light stress. J. Exp. Bot. 2005;56:389–393.
- Allen JF, Forsberg J. Molecular recognition in thylakoid structure and function. Trends Plant Sci. 2001;6:317–326.10.1016/S1360-1385(01)02010-6
- Helman Y, Tchernov D, Reinhold L, Shibata M, Ogawa T, Schwarz R, Ohad I, Kaplan A. Genes encoding A-type flavoproteins are essential for photoreduction of O2 in cyanobacteria. Curr. Biol. 2003;13:230–235.10.1016/S0960-9822(03)00046-0
- Zhang P, Allahverdiyeva Y, Eisenhut M, Aro EM. Flavodiiron proteins in oxygenic photosynthetic organisms: photoprotection of photosystem II by Flv2 and Flv4 in Synechocystis sp. PCC 6803. PLoS ONE. 2009;4:e5331.10.1371/journal.pone.0005331
- Zhang P, Eisenhut M, Brandt AM, Carmel D, Silén HM, Vass I, Allaverdiyeva Y, Salminen TA, Aro EM. Operon flv4-flv2 provides cyanobacterial photosystem II with flexibility of electron transfer. Plant Physiol. 2012;24:1952–1971.
- Bailey S, Melis A, Mackey KR, Cardol P, Finazzi G, van Dijken G, Berg G, Arrigo K, Shrager J, Grossman A. Alternative photosynthetic electron flow to oxygen in marine Synechococcus. Biochim. Biophys. Acta. 2008;1777:267–276.
- Berry S, Schneider D, Vermaas WFJ, Rögner M. Electron transport routes in whole cells of Synechocystis sp. strain PCC 6803: the role of the cytochrome bd-type oxidase. Biochemistry. 2002;41:3422–3429.10.1021/bi011683d
- Josse EM, Alcaraz JP, Laboure AM, Kuntz M. In vitro characterization of a plastid terminal oxidase (PTOX). Eur. J. Biochem. 2003;270:3787–3794.10.1046/j.1432-1033.2003.03766.x
- Kuntz M. Plastid terminal oxidase and its biological significance. Planta. 2004;218:896–899.10.1007/s00425-004-1217-6
- Paumann M, Regelsberger G, Obinger C, Peschek GA. The bioenergetic role of dioxygen and the terminal oxidase(s) in cyanobacteria. Biochim. Biophys. Acta. 2005;1707:231–253.10.1016/j.bbabio.2004.12.007
- Pils D, Schmetterer G. Characterization of three bioenergetically active respiratory terminal oxidases in the cyanobacterium Synechocystis sp. strain PCC 6803. FEMS Microbiol. Lett. 2001;1787:1479–1485.
- Dai H, Zhang L, Zhang J, Mi H, Ogawa T, Ma W. Identification of a cyanobacterial CRR6 protein, Slr1097, required for efficient assembly of NDH-1 complexes in Synechocystis sp. PCC 6803. Plant J. 2013;75:858–866.
- Allahverdiyeva Y, Ermakova M, Eisenhut M, Zhang P, Richaud P, Hagemann M, Cournac L, Aro EM. Interplay between flavodiiron proteins and photorespiration in Synechocystis sp. PCC 6803. J. Biol. Chem. 2011;286:24007–24014.10.1074/jbc.M111.223289
- Eisenhut M, Ruth W, Haimovich M, Bauwe H, Kaplan A, Hagemann M. The photorespiratory glycolate metabolism is essential for cyanobacteria and might have been conveyed endosymbiontically to plants. Proc. Natl. Acad. Sci. USA. 2008;105:17199–17204.10.1073/pnas.0807043105
- Huege J, Goetze J, Schwarz D, Bauwe H, Hagemann M, Kopka J. Modulation of the major paths of carbon in photorespiratory mutants of synechocystis. PLoS ONE. 2011;6:e16278.10.1371/journal.pone.0016278
- Williams JGK. Construction of specific mutations in photosystem II photosynthetic reaction center by genetic engineering methods in Synechocystis 6803. Methods Enzymol. 1998;167:766–778.
- Allen MM. Selective isolation of blue-green algae from water and soil. J. Phycol. 1968;4:1–4.10.1111/jpy.1968.4.issue-1
- Lee H, Flores E, Herrero A, Houmard J, Tandeau de Marsac N. A role for the signal transduction protein PII in the control of nitrate/nitrite uptake in a cyanobacterium. Methods Enzymol. 1988;167:318–328.10.1016/0076-6879(88)67037-6
- van Kooten O, Snel JFH. The use of chlorophyll fluorescence nomenclature in plant stress physiology. Photosynth. Res. 1990;25:147–150.10.1007/BF00033156
- Miyake C. Alternative electron flows (water-water cycle and cyclic electron flow around PSI) in photosynthesis: molecular mechanisms and physiological functions. Plant Cell Physiol. 2010;51:1951–1963.10.1093/pcp/pcq173
- Akimoto S, Yokono M, Aikawa S, Kondo A. Modification of energy-transfer processes in the cyanobacterium, Arthrospira platensis, to adapt to light conditions, probed by time-resolved fluorescence spectroscopy. Photosynth. Res. 2013;117:235–243.
- Badger MR, Spalding MH. In: Leegood RC, Sharkey TD, von Caemmerer S, editors. Photosynthesis: physiology and metabolism. Dordrecht: Kluwer Academic Publishers; 2010. p. 369–397.
- di Matteo A, Scandurra FM, Testa F, Forte E, Sarti P, Brunori M, Giuffre A. The O2-scavenging flavodiiron protein in the human parasite Giardia intestinalis. J. Biol. Chem. 2008;283:4061–4068.10.1074/jbc.M705605200
- Bailey S, Grossman A. Photoprotection in cyanobacteria: regulation of light harvesting. Photochem. Photobiol. 2008;84:1410–1420.10.1111/php.2008.84.issue-6
- Mullineaux CW, Allen JF. State 1-State 2 transitions in the cyanobacterium Synechococcus 6301 are controlled by the redox state of electron carriers between photosystems I and II. Photosynth. Res. 1990;23:297–311.10.1007/BF00034860