Abstract
Heterochromatin protein 1 alpha (HP1α) localizes to heterochromatin in interphase and shows dynamic molecular behavior in living cells. We previously reported that during mitosis, the majority of HP1α diffused into the cytoplasm but some remained in centromere heterochromatin. Here, we further characterize the molecular behavior of HP1α throughout the cell cycle. Time-lapse imaging of DsRed-HP1α through two successive cell divisions indicated that interphase can be divided into four phases. HP1α forms heterochromatin dots in early G1, which are maintained without any apparent changes (Phase 1). However, the HP1α dots begin to diffuse into the nucleoplasm and start flickering with a rhythmical cycle (Phase 2). Then, the HP1α dots diffuse further towards the periphery of the nucleus (Phase 3), and uniformly diffuse throughout the entire nucleus (Phase 4). Rhythmical flickering of HP1α dots in the middle of interphase may be useful for following cell cycle progression in mouse living cells.
Graphical Abstract
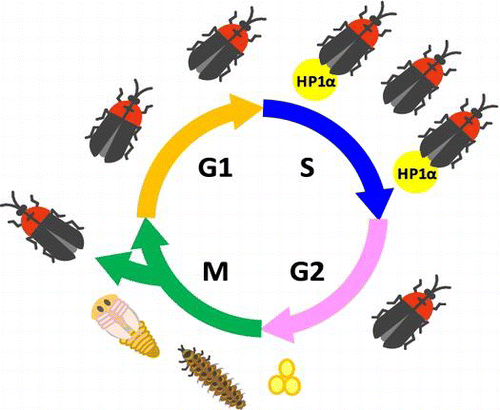
A lightning “HP1 alpha” bug flickers as a glow of a firefly around at S phase in the cell cycle.
Heterochromatin was considered as a form of chromatin that remains condensed throughout the cell cycle and contains transcriptionally inactive genes. Heterochromatin protein 1 (HP1) is a non-histone chromosomal protein that was first identified in Drosophila melanogaster as a component of the chromocenter.Citation1) The D. melanogaster mutant, Su(var)2–5, is a dominant suppressor of position effect variegation.Citation2) The fission yeast, Schizosaccharomyces pombe, also expresses a HP1 homolog called Swi6Citation3) that plays a crucial role in the establishment and maintenance of heterochromatin. In higher eukaryotes, HP1a, HP1b, and HP1c isoforms have been identified in Drosophila,Citation4) and HP1α, HP1β, and HP1γ isoforms have been identified in mammals.Citation5–7) These isoforms contain two evolutionarily conserved domains, the chromo domainCitation8) at the N-terminus and the chromoshadow domainCitation9) at the C-terminus.
Mammalian HP1α and HP1β predominantly localize to centromere heterochromatin in interphase,Citation6,10,11) while HP1γ localizes to both euchromatin and heterochromatin in interphase.Citation12) In mouse, Mus musculus, chromosomes except for the Y chromosome contain two types of satellite DNA repeats, minor satellite at the centric region and major satellite at the pericentric region.Citation13,14) Major satellites are detected as large spots, and colocalize with the 4’,6-diamidino-2-phenylindole (DAPI) dense heterochromatin clusters in interphase mouse nuclei.Citation15,16) HP1α colocalizes with major satellites domains, whereas minor satellites are juxtaposed but segregated from HP1α.Citation16) We previously found that a significant portion of HP1α dots has diffused in the nucleus in G2 phase and that the majority of HP1α further diffuses into the cytoplasm concomitant with nuclear envelope breakdown, but some HP1α remains in the centromeres of mitotic chromosomes.Citation17) However, it is not known when and how HP1α dots begin to diffuse in the nucleus of living cells. In addition, clarification of the molecular behavior of HP1α during the cell cycle may enable its use as a live cell marker for cell cycle progression.
Components of the replication machinery such as DNA methyltransferase (Dnmt) 1Citation8) and DNA ligase ICitation19) localize to nuclear replication sites during S phase. Two and a half decades ago, Celis and CelisCitation20) presented a putative sequence of proliferating cell nuclear antigen (PCNA) staining during the cell cycle and proposed the division of S phase into early and late stages according to the localization of PCNA in fixed cells. Later, Cardoso et al.Citation19) reported that GFP-fused DNA ligase I localized at replication foci in living mammalian cells. Its characteristic redistribution enables entry into S phase to be monitored in living cells. Moreover, Easwaran et al.Citation21) reported that Dnmt 1 associates with replication foci throughout S phase and preferentially with heterochromatin during G2 and M phase. These authorsCitation22) also reported that the combination of Dnmt 1 and DNA ligase I can be used as a marker of all cell cycle phases because their localizations are distinguishable between G1 and G2 phase. Similarly, GFP-PCNA can be used to perform automated cell cycle phase classification in living cells.Citation23) As the localization of HP1α changes dynamically in living cells,Citation10,11,17) HP1α might be used as an additional interphase living cell marker at least in mouse cells. To elucidate the molecular behavior of HP1α throughout the cell cycle, we performed time-lapse imaging of two successive cell divisions in the mouse C3H10T1/2 cell line stably expressing DsRed-HP1α.Citation17)
Materials and methods
Construction of stable cell lines
pECFP-histone H3 and pTK-hygCitation24) were introduced into the murine mesenchymal stem cell line C3H10T1/2 expressing DsRed-HP1α and EGFP-CENP-ACitation17) and stable transformants were selected in the presence of Hygromycin B (Roche Molecular Biochemicals, Mannheim, Germany), as described previously.Citation25) Cells were cultured in DMEM (Nissui Pharmaceutical, Tokyo, Japan) with 10% fetal bovine serum (PAA Laboratories GmbH, Pasching, Austria).
Western blot analysis
Cells were lysed in SDS-lysis buffer (62.5 mM Tris-HCl (pH 6.8), 1 mM EDTA, 2.5% SDS, 10% glycerol, and 1% Protease Inhibitor Cocktail (Nacalai Tesque, Kyoto, Japan)) and sonicated. The lysate was centrifuged for 10 min at 15,000 g, and the supernatants were used as whole cell lysate for western blot analysis. Fifteen micrograms of protein was resolved on a 12.5% acrylamide gel and transferred to PVDF membrane. HP1α protein was detected by Anti-HP1α antibody (#70–221, Cosmo Bio, Tokyo, Japan), HRP-conjugated anti-rabbit IgG antibody (NA934, GE Healthcare UK Ltd., Amercham Place, UK), and Immobilon Western HRP Substrate (Merck Millipore, Billarica, MA, USA).
Live-cell imaging analysis
Cells were inoculated into a 35 mm glass bottom dish (Iwaki, Funabashi, Chiba, Japan) and grown in an INUG2-ZILCS stage top incubator (Tokai Hit, Fujinomiya, Shizuoka, Japan). Time-lapsed images of C3H10T1/2 cells expressing ECFP-histone H3, EGFP-CENP-A, and DsRed-impΔα were captured essentially described elsewhere.Citation24,25) For a long-term multipoint time-lapse imaging, an Eclipse Ti-S fluorescent microscope (Nikon, Tokyo, Japan) was equipped with Plan Fluor 40X/NA 0.75 object lens (Nikon), a ProScanIII H117N1 XY-axis stage controller (Prior, Cambridge, UK), and a MAC5000 controller with excitation and emission filter wheels and a Z-axis motor (Ludl Electronic Products, Hawthorne, NY, USA). A 100 W halogen lamp was used as a light source to obtain the light of an appropriate wavelength at 57 μW.Citation25) We used the excitation and emission filters (572/28 and 632/60 nm, respectively) with a dichroic mirror (GFP/DsRed-A, Semrock, Rochester, NY, USA). Time-lapse images (10 optical sections with 2 μm distance) at eight points were captured by an ImagEM C9100–13 CCD camera (Hamamatsu Photonics, Hamamatsu, Shizuoka, Japan) exposing for 300 ms at 6 min intervals, operating a Volocity software (ver. 5.3.3, Improvision, Coventry, UK). Pictures and movies were processed with a LuminaVision software for Mac OSX (Mitani Corporation, Fukui, Japan). Fluorescence intensity was measured with an ImageJ 1.42q software (National Institutes of Health, Bethesda, MD, USA).
Results
Time-lapse analysis of DsRed-HP1α localization throughout the cell cycle
HP1α was stably expressed as a fusion to DsRed in mouse C3H10T1/2 cells,Citation17) and the amount of DsRed-HP1α protein expressed in this cell line was similar to that of endogenous HP1α protein in the parental C3H10T1/2 cells (Fig. ). HP1α was localized to heterochromatin in interphase; however, the majority of DsRed-HP1α diffused in the nucleoplasm in G2 phase and further diffused into the cytoplasm in M phase (Supplemental Video S1). To precisely examine its diffusion pattern during the cell cycle, we performed long-term time-lapse imaging of C3H10T1/2 cells. Fig. (A) shows representative fluorescent images of DsRed-HP1α in living cells at 30 min intervals after anaphase onset. After the first cell division (0 min), heterochromatin dots of HP1α were soon observed in small daughter cells in early G1 phase (30 min). Following the cell enlargement (60 min), the heterochromatin dots showed the typical localization of HP1α in interphase nuclei until 750 min. However, we noticed that HP1α began to diffuse into the nucleoplasm at around 750–780 min, and that the extent of its diffusion increased gradually until 1140–1170 min. HP1α had diffused further towards the nuclear periphery by 1890 min, and then became exclusively distributed in the nucleus (1920 min). The HP1α dots were hardly observed in the nucleoplasm and the cells entered into the second mitosis (1962 min).
Fig. 1. Expression of DsRed-HP1α in C3H10T1/2 cells.
Notes: HP1α protein was detected on a western blot of whole lysates from C3H10T1/2 cells (lane 1) and C3H10T1/2 cells stably expressing DsRed-HP1α (lane 2).
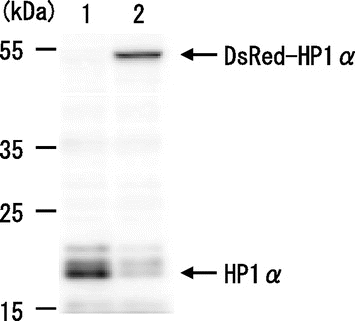
Fig. 2. Molecular behavior of DsRed-HP1α during the cell cycle of C3H10T1/2 cells.
Notes: (A) Fluorescent images of a C3H10T1/2 cell through two successive cell divisions. Each image of C3H10T1/2 cells stably expressing DsRed-HP1α was captured at 6 min intervals. The elapsed time after anaphase of the first mitosis is indicated at the bottom. The second mitosis began after 1962 min. Only one of the daughter cells (lower right) is shown after 60 min. (B) Fluorescence intensity of DsRed-HP1α following its diffusion into the nucleoplasm. The fluorescence intensity of nucleoplasm was measured at 6 min intervals and is indicated by arbitrary units. Note that the fluorescence intensity suddenly decreased at 1962 min, concomitant with nuclear envelope breakdown in the second mitosis. Segmentation of Phases 1–4 is shown at the top.
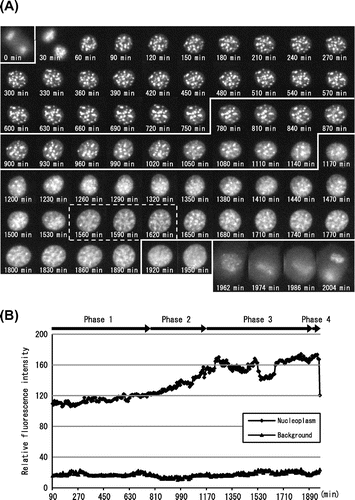
According to the localization of DsRed-HP1α, we tentatively divided interphase into four phases (Phases 1–4). After the first cell division, HP1α formed heterochromatin dots in Phase 1 (30–750 min). HP1α began to diffuse into the nucleoplasm, and the extent of its diffusion increased gradually in Phase 2 (780–1140 min). HP1α diffused further towards the nuclear periphery in Phase 3 (1170–1890 min) and then uniformly into the entire nucleus in Phase 4 (1920–1950 min). Nuclear envelope breakdown occurred at 1962 min, resulting in the second cell division.
Fig. (B) shows the fluorescence intensity of DsRed-HP1α in the nucleoplasm. Little change was observed in Phase 1, but the fluorescence intensity increased gradually in Phase 2 and reached a plateau in Phase 3. Interestingly, it decreased at 1530 min and recovered at 1650 min, correlating with the enlargement of nuclear size in this period (see dotted area in Fig. (A)). The fluorescence intensity changed little in Phase 4 but rapidly decreased to the Phase 1 level (1962 min) concomitant with the collapse of the nuclear envelope. These results suggested that the fluorescence intensity of DsRed-HP1α was correlated with its distribution pattern in the cell cycle.
Interphase segmentation of C3H10T1/2 cells in the living state
Next, we examined whether this cell cycle segmentation could also be applied to other HP1α-expressing individual cells. We followed two successive cell divisions of 10 independent cells in one experiment (see Materials and Methods). We characterized the cell cycle of 14 daughter cells, eight of which were derived from the same parents (p1-2, p4-4, p6-1, and p6-3). Fig. (A) shows typical images of these daughter cells in Phases 1–4, including the cell shown in Fig. (A) (p4-4-2). The counterpart daughter cell (p4-4-1) showed a similar distribution pattern of HP1α, as did another pair of daughter cells (p1-2-1 and p1-2-2).
Fig. 3. Interphase segmentation of C3H10T1/2 cells.
Notes: (A) Typical cell images of C3H10T1/2 cells in Phases 1–4. Interphase was divided into four phases by the pattern of DsRed-HP1α diffusion into the nucleoplasm. Heterochromatin dots of DsRed-HP1α were clearly observed 60 min after cell division (Phase 1). DsRed-HP1α began to diffuse into the nucleoplasm (Phase 2). The extent of DsRed-HP1α diffusion increased gradually and reached a plateau (see Fig. (B)). DsRed-HP1α diffused further towards the nuclear periphery (Phase 3) and uniformly diffused into the entire nucleoplasm (Phase 4). The elapsed time is indicated at the bottom. Each image from Phase 1 represents 90 min, by which time the heterochromatin dots were completely formed. Images of the start points of Phase 2 (600–870 min), Phase 3 (870–1200 min), and Phase 4 (1500–1920 min) are shown. (B) Ratio of the four phases in the cell cycle of C3H10T1/2 cells. In the diagram, the cell cycle of 14 cells starts from the first mitosis (M). Times required for one cell cycle in each cell are shown on the right. Note that Phase 2 is roughly positioned in the middle of the cell cycle.
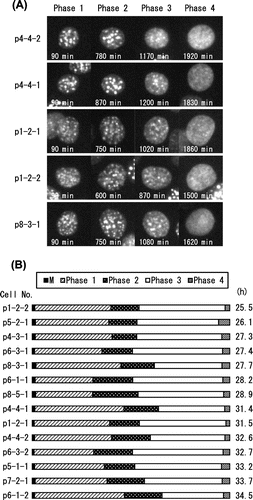
After the first cell division, all daughter cells exhibited heterochromatin dots in Phase 1. The dots of p1-2-derived daughters were smaller than those derived from other cells, but with no significant difference between two daughter cells. HP1α began to diffuse into the nucleoplasm in Phase 2. HP1α further diffused in Phase 3, such that each dot could not be easily distinguished. The fluorescence intensity of the nucleoplasm increased in Phase 3. HP1α diffused uniformly into the nucleoplasm in Phase 4, and was followed by the second cell division.
The average times of Phase 1, Phase 2, Phase 3, and Phase 4 were 11.4 ± 2.2 h, 5.3 ± 1.2 h, 12.4 ± 1.6 h, and 1.0 ± 0.3 h, respectively (n = 14). The length of the cell cycle varied from cell to cell, and from 25.5 h for the shortest (p1-2-2) to 34.5 h for the longest (p6-1-2). Although there was a significant difference between three pairs of daughter cells (25.5–31.5 h for p1-2, 28.2–34.5 h for p6-1, and 27.4–32.7 h for p6-3), the average was 30.1 ± 3.1 h (n = 14). These results are summarized in Fig. (B), where the relative lengths of Phases 1–4 are illustrated as a percentage of the cell cycle. Interestingly, Phase 2 was estimated to be located in the middle of the cell cycle. Phase 4 started just before the second mitosis, probably in G2 phase, consistent with a previous report.Citation17)
Periodic flickering of HP1α dots in Phase 2
The diffusion of HP1α dots into the nucleoplasm started in Phase 2. When the molecular behavior of the HP1α dots was observed in the movies (Supplemental Video S2), we noticed that the fluorescence intensity of HP1α dots changed periodically. Representative images of the flickering dots are shown in Fig. (A). The insets show higher magnification images of the non-flickering and flickering dots in panels a and b, respectively. When we focused on the dot marked with a square in panel b, it disappeared at 888 min, reappeared at 918 min, disappeared at 948 min, and so on. We measured the fluorescence intensity of this dot every 6 min from 90 min through to 1086 min (Fig. (B)). The fluorescence intensity suddenly decreased at 798 min and recovered at 858 min. It decreased at 888 min and increased at 918 min, and so on, as shown in Fig. (A). This rhythmical cycle with intervals of about 30 min was observed five times until 1086 min.
Fig. 4. Asynchronous periodic flickering of DsRed-HP1α dots in Phase 2.
Notes: (A) Representative images of DsRed-HP1α dots in interphase nuclei in Phases 1 and 2. The relative positions of DsRed-HP1α dots did not change significantly between 630 and 738 min (a, Phase 1), but did between 858 and 996 min (b, Phase 2). The insets show higher magnification images of the HP1α dots marked with a square. Note that the HP1α dot in Phase 2 appears and disappears periodically with an interval of about 30 min. (B) Fluorescence intensity of a DsRed-HP1α dot. The fluorescence intensity of the HP1α dot indicated with a square in Fig. A was measured at 6 min intervals. Each boxed area (a and b) corresponds to the cell panels in Fig. A. Note that the fluorescence intensity of HP1α suddenly changed at 780 min, concomitant with the beginning of Phase 2. The fluorescence intensity of this dot could not be measured after 1086 min. (C) DsRed-HP1α dots applied for measurement of fluorescence intensity. Five DsRed-HP1α dots that flickered periodically are indicated with circles on the image captured at 858 min. The background intensity was also measured (upper right circle). (D) Change in fluorescence intensity of HP1α dots. The fluorescence intensities of the DsRed-HP1α dots shown in Fig. C were measured at 6 min intervals. The first decreases in fluorescence intensity were observed at 756 (Dot 4), 768 (Dot 5), 822 (Dot 3), 864 (Dot 2), and 888 min (Dot 1), concomitant with the initiation of Phase 2 (780 min). Dots 1–5 showed a similar periodicity of flickering, although the fluorescence intensity of Dot 5 could not be followed after 948 min.
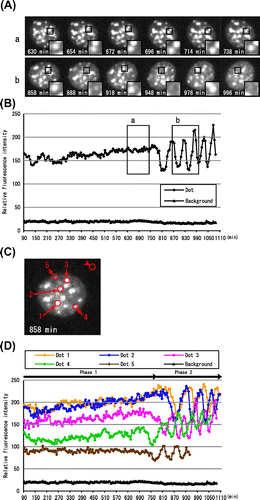
We found that the flickering of the HP1α dots started at the beginning of Phase 2, concomitant with the initiation of HP1α diffusion at 756 min. The first and second upper peaks appeared at 60 min intervals, and the third and forth peaks appeared at 48 min intervals. The bottom peaks appeared at 72, 60, and 48 min intervals. The periodicity seemed to be steady at 48 min intervals after the third bottom peak, although we could not follow this periodicity further. When the time periods required for the increase and decrease of each peak were compared, fluorescence recovery took longer than fluorescence lowering. In addition, the lowering period was rather constant and was estimated to be 30 min.
Asynchronous flickering of DsRed-HP1α dots in interphase nuclei
Next, we examined whether other HP1α dots also showed a similar periodicity of flickering in the same nucleus. Fig. (C) shows the live-cell imaging of p4-4-2 at 858 min in Phase 2. We measured the fluorescence intensity of the five dots indicated with arrows. As shown in Fig. (D), all dots showed periodic flickering, although the initiation of flickering was different from dot to dot. The fluorescence intensity of Dot 1 decreased at 888 min, while that of Dot 4 decreased earlier than the others (756 min). Three to four peaks, at least, were observed for all dots. The flickering of Dots 1–5 continued to 1140 min (the end of Phase 2), but the fluorescence intensity could not be followed further, because of the further diffusion of DsRed-HP1α into the nucleoplasm (see the Phase 3 cells in Fig. (A)). The flickering of the dots did not seem to be synchronous. The average time between the peaks of five dots was 35.1 ± 5.3 min. The periodic flickering was observed at 43% of the dots in this cell, and it was also observed at 39–48% of the dots in other cells (n = 4).
Visualization of cell cycle progression of C3H10T1/2 cells in living state
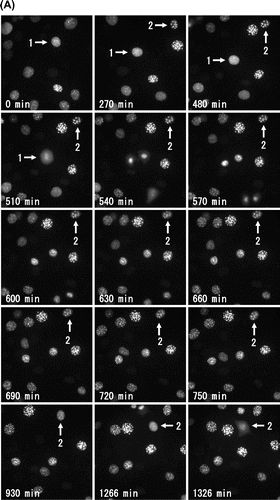
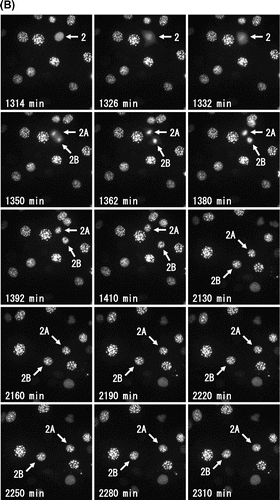
When we observed this fluorescent C3H10T1/2 cells by long-term live-cell imaging, we could easily find the interphase cells in Phase 2 with periodic flickering of heterochromatin dots (Fig. (A), see Supplemental Video S3). Heterochromatin dots of DsRed-HP1α in a cell (No. 1) continued periodic flickering until 330 min, and diffused completely in nucleus at 480 min (Phase 4). The collapse of the nuclear envelope was observed at 510 min, followed by the mitosis and cell division. Similarly, another cell (No. 2) showed periodic flickering from 480 min to 750 min (Phase 2), and entered into Phase 4 at 1266 min. The collapse of the nuclear envelope was observed at 1326 min and the cell was divided into two daughter cells at 1362 min (Fig. (B)). After cell divisions, the daughter cells (No. 2A and No. 2B) enlarged in size in early G1 phase (1392–1410 min) and started periodic flickering at 2220 min and 2130 min, respectively, indicating that they entered into Phase 2. So, flickering of heterochromatin dots was a visual indication of Phase 2 and the complete diffusion of heterochromatin dots was another of Phase 4 in living C3H10T1/2 cells expressing DsRed-HP1α.
Fig. 5. Fate of interphase cells with flickering of heterochromatin dots.
Notes: Representative images of DsRed-HP1α in C3H10T1/2 cells by long-term live-cell imaging. (A) In cells observed flickering of heterochromatin dots, HP1α diffused throughout the entire nucleus, and progressed to M phase. The lower left corner of each image indicates the elapsed time. (B) After cell division, heterochromatin dots of HP1α were soon observed in small daughter cells in early G1 phase. Following cell enlargement, the heterochromatin dots showed the typical localization of HP1α in interphase nuclei. Then, HP1α began to diffuse into the nucleoplasm and the dots started flickering with a rhythmical cycle. The lower left corner of each image indicates the elapsed time.
The heterochromatin dots diffused completely in nucleus and then entered into M phase 10.4 ± 2.0 h (n = 5) later, after the flickering period, and the flickering of heterochromatin dots starts 10.4 ± 1.4 h (n = 3) later in the next cell cycle (Supplemental Video S3). As shown in Fig. , the average times based on the diffusion of HP1α of Phase 1, and Phase 3 plus Phase 4 were 11.4 ± 2.2 h and 13.5 ± 1.7 h, respectively (n = 14). We found that both average times based on the periodic flickering of heterochromatin dots were similar to those based on the diffusion of HP1α.
Discussion
In this study, we characterized the molecular behavior of heterochromatin dots throughout the cell cycle in mouse C3H10T1/2 cells. The diffusion of HP1α began at the midpoint of interphase and further progressed into the entire nucleus. The interphase was tentatively divided into four phases, Phases 1–4, by carefully characterizing the localization of HP1α by the long-term live-cell imaging.
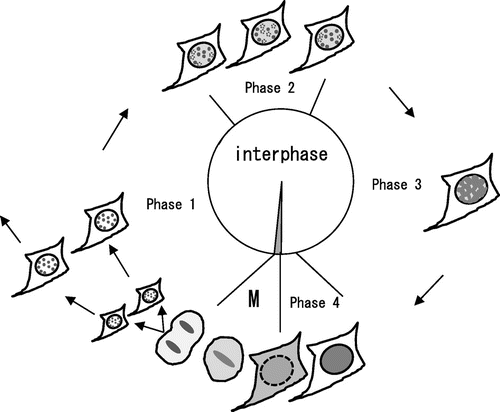
Fig. shows a schematic illustration of the localization of HP1α during the cell cycle. In Phase 1, HP1α formed heterochromatin dots soon after the first cell division, typical of its localization during interphase.Citation10,11,17) The localization of DsRed-HP1α seemed to be the same as that of EGFP-HP1α (unpublished results), although the tetrameric DsRed fusion tag may hinder the precise localization of the protein of interest.Citation26) In Phase 2, HP1α began to diffuse into the nucleoplasm and its diffusion increased gradually. In Phase 3, HP1α diffused further towards the nuclear periphery. In Phase 4, HP1α was uniformly distributed in the nucleus, and then the cells entered into M phase. In M phase, the majority of HP1α diffused into the cytoplasm but some remained in centromere heterochromatin, consistent with previous observations.Citation17)
Fig. 6. Schematic illustration of the molecular behavior of HP1α during the cell cycle.
Notes: In Phase 1, HP1α formed heterochromatin dots in the nucleus after the first cell division. In Phase 2, HP1α began to diffuse in the nucleoplasm, and HP1α dots started flickering periodically. HP1α dots that disappeared because of periodic flickering are shown by the dotted circles. Note that periodic flickering of HP1α dots is asynchronous. In Phase 3, HP1α diffused further towards the nuclear periphery, and the HP1α dots became difficult to distinguish. In Phase 4, HP1α was distributed completely in the nucleus. In M phase (M), the majority of HP1α diffused into the cytoplasm but some remained in centromere heterochromatin as described previously.Citation17)
The average length of the cell cycle was 30 h and apparently longer than non-fluorescent C3H10T1/2 cells. Similarly, other fluorescent protein fusions are known to extend the cell cycle length, especially in long-term time-lapse observations.Citation25) This cell cycle elongation is probably caused by, at least in part, the damage from the excitation light for fluorescent observation. In addition, DsRed-HP1α protein may disturb the function of endogenous HP1α. Fig. shows that the amount of DsRed-HP1α in the recombinant cell was, in average, comparable to that of HP1α in the parental C3H10T1/2 cells, but it also shows that the endogenous HP1α expression was reduced in DsRed-HP1α expressing cell line, suggesting that significant fraction of HP1α protein was replaced by DsRed-HP1α in this cell line. This observation suggests that DsRed-HP1α can play the essential roles of native HP1α, but the tetramerizing nature of DsRed protein may be toxic to the cell proliferation.
The fluorescence intensity of HP1α dots changed periodically in Phase 2 (Fig. (B) and (D)). The periodicity of the fluorescence of HP1α dots was not caused by the up-and-down movement of HP1α dots because we could not detect the fluorescence among 10 Z axis slices with a distance of 2 μm (data not shown). We could not completely rule out the possibility, that the DsRed moiety affected the protein dynamics of DsRed-HP1α fusion, since significant part of native HP1α was replaced by DsRed-HP1α in the recombinant cell line, as discussed above. Similar replacement was reported by Foltz et al.Citation27) for YFP-fused centromere protein A (CENP-A). Such replacement seems inevitable for proteins, those concentrations are strictly regulated in cells. This problem should be alleviated since we chose cells of less amount of DsRed-HP1α than average for the live-cell observation.
The flickering of HP1α dots with medium fluorescence intensity began with the start of HP1α diffusion, that is Phase 2 (Fig. (B) and (D)). Although, we measured the fluorescence intensity of nucleoplasm containing the entire HP1α dot population (Fig. (B)), the fluorescence intensity increased independently of the periodic change in the fluorescence intensity of HP1α dots (Fig. (B)). Thus, it may be better that we alternatively define Phase 2 as the period that the flickering of DsRed-HP1α starts and continues in live cell imaging. In fact, when we observed this C3H10T1/2 cell line in the living state, we could easily notice this phenomenon and know which cells were in Phase 2. In addition, we could tell that Phase 4 cells will soon enter into M phase (Supplemental Video S1) and the flickering cells will proceed into Phase 4 in 11–15 h (Supplemental Video S3). So far, we do not know the molecular mechanism of periodic flickering of HP1α dots. Certain interaction between HP1α and major satellite DNA might be related in this phenomenon. It is likely that the flickering can be observed only in mouse cells, since heterochromatin dots are not so clearly recognized in other mammalian cells.
We previously reported that clathrin light chain a (CLCa) and Fes/CIP4 homology domain only 1 (FCHO1, also known as KIAA0290) showed periodic fluctuations at the trans-Golgi network in living cells.Citation28,29) These periodic movements were suggested to be involved in clathrin-coated vesicle formation. Similarly, the periodic flickering of HP1α dots may be somehow correlated with the modification or conformation of HP1αCitation10), and/or interaction with other proteins, since HP1α is known to be associated with many proteins such as Suv39H1,Citation30) SNF2βCitation31), and histone H1.4.Citation32) Interestingly, Schmiedeberg et al.Citation33) reported high- and low-mobility populations of HP1 in heterochromatin of mammalian cells. Krouwels et al.Citation34) also found the dynamic properties of SUV39H1 in mouse NIH3T3 living cells and suggested that a substantial population of SUV39H1 is immobile at heterochromatin and thus, may play a structural role in heterochromatin structure. In addition, Dnmt 1 was interacted with Suv39h1-HP1 heterochromatin complex.Citation35,36) The molecular interaction of HP1α with Suv39H1 and Dnmt 1 might be the molecular bases of periodic flickering of HP1α dots in interphase, consistent with the data of Stewart et al.Citation37)
Further studies are needed to determine when HP1α diffusion starts in the cell cycle. Our results indicated that the localization of HP1α dynamically changes in the middle of interphase. Therefore, it is likely that it may overlap with S phase. Interestingly, Dnmt 1Citation18), DNA ligase ICitation19), and PCNACitation20) localize to nuclear replication sites during S phase. Easwaran et al.Citation21) reported that Dnmt 1 associates with replication foci throughout S phase and preferentially with heterochromatin during G2 and M phase, but the association is independent of heterochromatin-specific histone H3 Lys 9 trimethylation, and of SUV39H, and HP1.Citation21) Chagin et al.Citation38) performed time-lapse imaging of human cells stably expressing GFP-PCNA throughout the cell cycle. The simultaneous observation of HP1α with PCNA, Dnmt 1, or DNA ligase I may be useful for determining the exact HP1α fluctuation period during the cell cycle in the future. Further studies are required to determine the exact timing and to elucidate the molecular mechanism underlying the flickering of HP1α dots.
Supplemental material
The Supplemental material for this paper is available at http://dx.doi.org/10.1080/09168451.2014.893184
Supplemental Video S3
Download MP4 Video (1.3 MB)Supplemental Video S2
Download QuickTime Video (2.4 MB)Supplemental Video S1
Download QuickTime Video (2.7 MB)Notes
Abbreviations: HP1α, heterochromatin protein 1 alpha; DsRed, Discosoma sp. red fluorescent protein; PEV, position effect variegation; CD, chromo domain; CSD, chromoshadow domain; DAPI, 4’,6-diamidino-2-phenylindole; Dnmt, DNA methyltransferase; PCNA, proliferating cell nuclear antigen; GFP, green fluorescent protein; ECFP, enhanced cyan fluorescent protein; EGFP, enhanced green fluorescent protein; YFP, yellow fluorescent protein; CENP-A, centromere protein A; CLCa, clathrin light chain a; FCHO1, Fes/CIP4 homology domain only 1.
References
- James TC, Elgin SC. Identification of a nonhistone chromosomal protein associated with heterochromatin in Drosophila melanogaster and its gene. Mol. Cell. Biol. 1986;6:3862–3872.
- Eissenberg JC, James TC, Foster-Hartnett DM, Hartnett T, Ngan V, Elgin SC. Mutation in a heterochromatin-specific chromosomal protein is associated with suppression of position-effect variegation in Drosophila melanogaster. Proc. Natl. Acad. Sci. 1990;87:9923–9927.10.1073/pnas.87.24.9923
- Lorentz A, Ostermann K, Fleck O, Schmidt H. Switching gene swi6, involved in repression of silent mating-type loci in fission yeast, encodes a homologue of chromatin-associated proteins from Drosophila and mammals. Gene. 1994;143:139–143.10.1016/0378-1119(94)90619-X
- Smothers JF, Henikoff S. The hinge and chromo shadow domain impart distinct targeting of HP1-like proteins. Mol. Cell. Biol. 2001;21:2555–2569.10.1128/MCB.21.7.2555-2569.2001
- Saunders WS, Chue C, Goebl M, Craig C, Clark RF, Powers JA, Eissenberg JC, Eglin SC, Rothfield NF, Earnshaw WC. Molecular cloning of a human homologue of Drosophila heterochromatin protein HP1 using anti-centromere autoantibodies with anti-chromo specificity. J. Cell Sci. 1993;104:573–582.
- Furuta K, Chan EKL, Kiyosawa K, Reimer G, Luderschmidt C, Tan EM. Heterochromatin protein HP1Hsβ (p25β) and its localization with centromeres in mitosis. Chromosoma. 1997;106:11–19.10.1007/s004120050219
- Ye Q, Worman HJ. Interaction between an integral protein of the nuclear envelope inner membrane and human chromodomain proteins homologous to Drosophila HP1. J. Biol. Chem. 1996;271:14653–14656.
- Paro R, Hogness DS. The Polycomb protein shares a homologous domain with a heterochromatin-associated protein of Drosophila. Proc. Natl. Acad. Sci. 1991;88:263–267.10.1073/pnas.88.1.263
- Aasland R, Stewart AF. The chromo shadow domain, a second chromo domain in heterochromatin-binding protein 1, HP1. Nucleic Acids Res. 1995;23:3168–3173.10.1093/nar/23.16.3168
- Yamada T, Fukuda R, Himeno M, Sugimoto K. Functional domain structure of human heterochromatin protein HP1Hsα: involvement of internal DNA-binding and C-terminal self-association domains in the formation of discrete dots in interphase nuclei. J. Biochem. 1999;125:832–837.10.1093/oxfordjournals.jbchem.a022356
- Minc E, Allory Y, Worman HJ, Courvalin JC, Buendia B. Localization and phosphorylation of HP1 proteins during the cell cycle in mammalian cells. Chromosoma. 1999;108:220–234.10.1007/s004120050372
- Minc E, Courvalin JC, Buendia B. HP1gamma associates with euchromatin and heterochromatin in mammalian nuclei and chromosomes. Cytogenet. Cell Genet. 2000;90:279–284.10.1159/000056789
- Wong AK, Rattner JB. Sequence organization and cytological localization of the minor satellite of mouse. Nucleic Acids Res. 1988;16:11645–11661.10.1093/nar/16.24.11645
- Joseph A, Mitchell AR, Miller OJ. The organization of the mouse satellite DNA at centromeres. Exp. Cell Res. 1989;183:494–500.10.1016/0014-4827(89)90408-4
- Matsuda Y, Chapman VM. In situ analysis of centromeric satellite DNA segregating in Mus species crosses. Mamm. Genome. 1991;1:71–77.10.1007/BF02443781
- Guenatri M, Bailly D, Maison C, Almouzni G. Mouse centric and pericentric satellite repeats form distinct functional heterochromatin. J. Cell Biol. 2004;166:493–505.10.1083/jcb.200403109
- Sugimoto K, Tasaka H, Dotsu M. Molecular behavior in living mitotic cells of human centromere heterochromatin protein HP1α ectopically expressed as a fusion to red fluorescent protein. Cell Struct. Funct. 2001;26:705–718.10.1247/csf.26.705
- Leonhardt H, Page AW, Weier HU, Bestor TH. A targeting sequence directs DNA methyltransferase to sites of DNA replication in mammalian nuclei. Cell. 1992;71:865–873.10.1016/0092-8674(92)90561-P
- Cardoso MC, Joseph C, Rahn HP, Reusch R, Nardal-Ginard B, Leonhardt H. Mapping and use of a sequence that targets DNA ligase I to sites of DNA replication in vivo. J. Cell Biol. 1997;139:579–587.10.1083/jcb.139.3.579
- Celis JE, Celis A. Cell cycle-dependent variations in the distribution of the nuclear protein cyclin proliferating cell nuclear antigen in cultured cells: subdivision of S phase. Proc. Natl. Acad. Sci. 1985;82:3262–3266.10.1073/pnas.82.10.3262
- Easwaran HP, Schermelleh L, Leonhardt H, Cardoso MC. Replication-independent chromatin loading of Dnmt1 during G2 and M phases. EMBO Rep. 2004;5:1181–1186.10.1038/sj.embor.7400295
- Easwaran HP, Leonhardt H, Cardoso MC. Cell cycle markers for live cell analyses. Cell Cycle. 2005;4:453–455.10.4161/cc
- Ersoy I, Bunyak F, Chagin V, Cardoso MC, Palaniappan K. Segmentation and classification of cell cycle phases in fluorescence imaging. Lect. Notes Comput. Sci. 2009;5762:617–624.10.1007/978-3-642-04271-3
- Sugimoto K, Urano T, Zushi H, Inoue K, Tasaka H, Tachibana M, Dotsu M. Molecular dynamics of Aurora-A kinase in living mitotic cells simultaneously visualized with histone H3 and nuclear membrane protein importin α. Cell Struct. Funct. 2002;27:457–467.10.1247/csf.27.457
- Sugimoto K and Tone S. Imaging of mitotic cell division and apoptotic intra-nuclear processes in multicolor. Live cell imaging, methods and protocols. In: Papkovsky DB, editor. Humana Press, New York, NY; 2010. p. 135–146.
- Nakagawa C, Nishimura S, Senda-Murata K, Sugimoto K. A rapid and simple method of evaluating the dimeric tendency of fluorescent proteins in living cells using a truncated protein of importin α as fusion tag. Biosci. Biotechnol. Biochem. 2012;76:388–390.10.1271/bbb.110677
- Foltz DR, Jansen LET, Black BE, Bailey AO, Yates JR III, Cleveland DW. The human CENP-A centromeric nucleosome-associated complex. Nat. Cell Biol. 2006;8:458–469.10.1038/ncb1397
- Sakaushi S, Senda-Murata K, Fukada T, Oka S, Sugimoto K. Rhythmic cycle of clathrin-coated pit formation at the trans-golgi network in human MDA-MB-435 cells. Biosci. Biotechnol. Biochem. 2007;71:571–574.10.1271/bbb.60434
- Sakaushi S, Inoue K, Zushi H, Senda-Murata K, Fukada T, Oka S, Sugimoto K. Dynamic behavior of FCHO1 revealed by live-cell imaging microscopy: its possible involvement in clathrin-coated vesicle formation. Biosci. Biotechnol. Biochem. 2007;71:1764–1768.10.1271/bbb.60720
- Aagaard L, Laible G, Selenko P, Schmid M, Dorn R, Schotta G, Kuhfittig S, Wolf A, Lebersorger A, Singh PB, Reuter G, Jenuwein T. Functional mammalian homologues of the Drosophila PEV-modifier Su(var)3-9 encode centromere-associated proteins which complex with the heterochromatin component M31. EMBO J. 1999;18:1923–1938.
- Nielsen AL, Sanchez C, Ichnose H, Cerviño M, Lerouge T, Chambon P, Losson R. Selective interaction between the chromatin-remodeling factor BRG1 and the heterochromatin-associated protein HP1α. EMBO J. 2002;21:5797–5806.10.1093/emboj/cdf560
- Daujat S, Zeissler U, Waldmann T, Happel N, Schneider R. HP1 binds specifically to Lys26-methylated histone H1.4, whereas simultaneous Ser27 phosphorylation blocks HP1 binding. J. Biol. Chem. 2005;280:38090–38095.10.1074/jbc.C500229200
- Schmiedeberg L, Weisshart K, Diekmann S, Meyer zu Hoerste G, Hemmerich P. High- and low-mobility populations of HP1 in heterochromatin of mammalian cells. Mol. Biol. Cell. 2004;15:2819–2833.10.1091/mbc.E03-11-0827
- Krouwels IM, Wiesmeijer K, Abraham TE, Molenaar C, Verwoerd NP, Tanke HJ, Dirks RW. A glue for heterochromatin maintenance: stable SUV39H1 binding to heterochromatin is reinforced by the SET domain. J. Cell Biol. 2005;170:537–549.10.1083/jcb.200502154
- Fujita N, Watanabe S, Ichimura T, Tsuruzoe S, Shinkai Y, Tachibana M, Chiba T, Nakao M. Methyl-CpG binding domain 1 (MBD1) interacts with the Suv39h1-HP1 heterochromatic complex for DNA methylation-based transcriptional repression. J. Biol. Chem. 2003;278:24132–24138.10.1074/jbc.M302283200
- Fuks F, Hurd PJ, Deplus R, Kouzarides T. The DNA methyltransferases associate with HP1 and the SUV39H1 histone methyltransferase. Nucleic Acids Res. 2003;31:2305–2312.10.1093/nar/gkg332
- Stewart MD, Li J, Wong J. Relationship between histone H3 lysine 9 methylation, transcription repression, and heterochromatin protein 1 recruitment. Mol. Cell. Biol. 2005;25:2525–2538.10.1128/MCB.25.7.2525-2538.2005
- Chagin VO, Stear JH, Cardoso MC. Organization of DNA replication. Cold Spring Harb. Perspect. Biol. 2010;2:a000737.

