
Abstract
We examined the effects of fructo-oligosaccharides (FOS) on IgA and mucin secretion in the rat cecum after different ingestion periods. Rats were fed a control diet or a diet containing FOS for 1, 2, 4, and 8 wk. FOS ingestion greatly increased IgA and mucin concentrations at 1 and 2 wk, but the effects were disappeared or attenuated at 4 and 8 wk. After 1 wk, FOS induced higher lactobacilli and lactate concentrations and lower cecal pH in the cecum, but the alterations were moderated with the prolonged ingestion accompanying with increasing short-chain fatty acid concentrations. At 1 and 2 wk, FOS increased IgA plasma cells and polymeric immunoglobulin receptor expression in the cecal mucosa and strongly depressed fecal mucinase activities related to the lower cecal pH. These findings may explain the FOS-induced early elevation of IgA and mucin. Clearly, FOS effects on IgA and mucin secretion considerably differ depending on the ingestion period.
Graphical Abstract
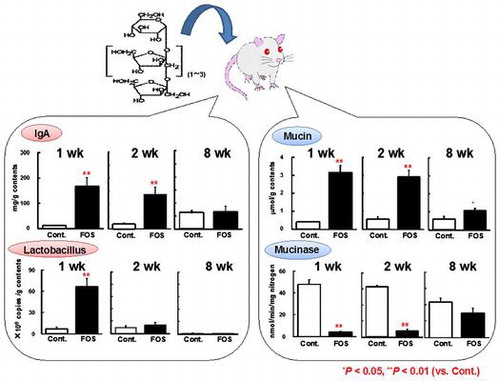
A short-term ingestion of FOS greatly increased the cecal concentrations of IgA and mucin in rats, but these effects were disappeared or attenuated with the prolonged ingestion.
Recent studies in animals and humans showed that ingestion of prebiotics such as fructo-oligosaccharides (FOS) and galacto-oligosaccharides exerts beneficial effects on gut health either directly or indirectly through the production of short-chain fatty acids (SCFA) and the stimulated proliferation of lactic acid-producing bacteria (LAB) such as lactobacilli and bifidobacteria.Citation1,2) Among the beneficial effects on gut health, increased secretion of IgA and mucin into the intestine is likely to be of most importance for the maintenance of mucosal barrier function. Indeed, secreted IgA promotes immune exclusion by entrapping dietary antigens and micro-organisms in the mucus,Citation3) while mucin is a key component of the mucus and functions as a physical barrier that prevents potential pathogens and antigens from gaining access to the underlying epithelium and also serves as a reservoir for IgA.Citation4)
Our previous studies on rats fed inulin-type fructans with different degrees of polymerization (DP) at dietary level of 6% for 2 wk showed that lower DP fructans, FOS in particular, enhanced cecal IgA secretion and increased the IgA plasma cells in the cecal mucosa and suggested that the increased lactobacilli may contribute to the stimulation of cecal IgA secretion.Citation5) Also, the higher DP fructans predominantly enhanced cecal mucin productions that were likely to respond to cecal SCFA production, whereas IgA increases when fermentation occurred rapidly and lactate was a major fermentation product.Citation6) Several authors have also suggested possible relevance of LAB and SCFA to the enhanced intestinal secretion of IgACitation7–9) and mucinCitation10,11) in human and animal experiments.
In this connection, Le Blay et al. showed that the fermentation products and the population of LAB in rats fed 9% FOS diet differed considerably depending on the ingestion period.Citation12) The FOS-induced increase in the intestinal numbers of LAB at 2 wk was abolished at 8 and 27 wk, but the cecal concentrations of SCFA, butyrate in particular, increased in the time-dependent manner and this butyrogenic property of FOS was maintained at 27 wk. These findings implicate that long-term “functional” effects of FOS could differ from short-term effects if the changes in LAB numbers and SCFA concentrations are prerequisite for the enhanced production and secretion of IgA and mucin.Citation2)
Hosono et al. studied the effect of dietary FOS on fecal IgA excretion in adult mice during 4 wk, and indicated that 7.5% FOS in diet significantly elevated the fecal IgA excretion at 2 wk, but the effect appeared to be transient.Citation13) Similarly, a transient increase in fecal IgA concentrations was observed in mice that received FOS administration for 3 wk after weaning.Citation14) However, no further information is available for FOS effect on intestinal IgA secretion with respect to the ingestion period. Moreover, the study for the relevance of a prolonged ingestion of FOS and mucin secretion is scarce. Clearly, a long-term experiment is required for further understanding of the potential benefits of FOS on the gut health, because most of the diseases related to the alterations of mucosal barrier function tend to chronically progress.Citation15,16)
The aim of the present study is to examine the effects of FOS on IgA and mucin secretion related to the fermentation products and LAB counts in the rat cecum after different periods of ingestion (1, 2, 4, and 8 wk; experiment 1), and to analyze the results from the aspects of IgA plasma cell ratio and gene expressions of polymeric immunoglobulin receptor (pIgR) and Muc 2 in the cecal mucosa at 1, 2, and 8 wk (experiment 2). Besides the stimulatory factors for production and secretion of IgA and mucin, their intestinal stabilities would be another important factor to determine IgA and mucin concentrations in the intestine, because some bacterial species have been shown to possess IgA proteasesCitation17,18) and mucin-related glycoprotein and oligosaccharide degrading enzymes.Citation19,20) Accordingly, we also examine the effects of FOS on the cecal IgA stability and the fecal mucinase activity at 1, 2, and 8 wk (experiment 2).
Materials and methods
Materials
FOS, composed of 44% 1-kestose, 46% nystose, and 10% 1-f-β-fructofuranosyl nystose (range; 2–4), was purchased from Meiji Seika (Meioligo® P, Tokyo, Japan).
Care of animals
The study (No. 24–19) was approved by the Animal Use Committee of Shizuoka University, and rats were maintained in accordance with the guidelines for the care and use of laboratory animals of Shizuoka University. Male Wistar (6 wk old) was purchased from Shizuoka Laboratory Animal Center (Shizuoka, Japan). The rats were housed individually in screen-bottomed stainless-steel cages in a temperature- (23 ± 2 °C) and light- (lights on from 07:00 to 19:00) controlled room. The rats were acclimatized for 5 d and fed a control dietCitation21) formulated from 250 g/kg of casein, 652.5 g/kg of cornstarch, and 50 g/kg of corn oil. The remainder of the diet consisted of vitamins including choline bitartrate (12.5 g/kg) and minerals (35 g/kg). The compositions of vitamins and minerals were based on AIN-76.Citation22) The rats were subsequently allocated to groups based on body weight in order to normalize body weights across the groups. They were allowed free access to one of the experimental diets (control and FOS diets) and water. The FOS diet was formulated by adding FOS to the control diet at the expense of an equal amount of cornstarch. Accordingly, dietary starch level differed in diets and was 592.5 g/kg for the FOS diet. Body weight and food intake were recorded every morning before replenishing the diet.
Experiment 1
After acclimatization, 48 rats, weighing 130–150 g, were allocated to eight groups of six rats each and allowed free access to the control diet or FOS diet for 1, 2, 4, or 8 wk. At the end of each experimental period, rats were killed by decapitation, and the cecum was removed and weighed. Cecal contents were homogenized and divided into two portions: one was used for analyses of pH, organic acids, IgA, and microbiota, and the other was freeze-dried for measurement of mucin. The whole cecal tissue was used for separation of lamina propria mononuclear cells (LPMC) and successive analysis of IgA plasma cells.
Experiment 2
After acclimatization, 72 rats weighing 130–153 g were allocated to six groups of 12 rats and allowed free access to the control diet or FOS diet for 1, 2, or 8 wk. Fresh feces (n = 12 per each group) were collected for the last 3 d of each experimental period and used for the measurement of mucinase activity. At the end of each experimental period, all of the rats were killed by decapitation, and the cecum was removed and weighed. Cecal pH was measured. Then, a half of the rats (n = 6) in each group were subjected to the analyses of concentrations of IgA and mucin in the cecal contents. Also, the cecal mucosa was scraped with a glass slide and used for isolation of total RNA and successive analyses of gene expression. For the remaining rats (six rats per each group), the whole cecal tissue was excised and used for the analysis of IgA plasma cells. The cecal contents were homogenized with five volume of degassed-distilled water, and then filtered through two layers of gauze. About 500 μL each of the obtained filtrate was used for the measurement of IgA degradation rate; one was immediately subjected to the determination of IgA (0-time incubation), and the others were further incubated under nitrogen gas at 37 °C for up to 6 h. After incubation, IgA concentrations were determined and compared with values of 0 time-incubation.
Immunoglobulin A analysis
Cecal contents (approx. 100 mg wet weight) were homogenized using a Polytron (Central Scientific Commerce, Tokyo, Japan) for 1 min in ice-cold PBS (100 mg cecal contents/mL) containing a protease inhibitor (Complete, Roche Diagnostics, Tokyo, Japan; one tablet/50 mL phosphate-buffered saline) and Tween-20 (5 g/L). The homogenate was centrifuged at 10,000 × g for 20 min at 4 °C, and the supernatant was stored at –80 °C until analysis. After an appropriate dilution, cecal IgA was determined by enzyme-linked immunosorbent assay as described previously.Citation23)
Mucin analysis
The mucin fraction was isolated by the method as described previously.Citation24) After an appropriate dilution of the mucin fraction, O-linked oligosaccharide chains were measured as described previously.Citation25) Standard solutions of N-acetylgalactosamine (Sigma-Aldrich, St. Louis, MO, USA) were used to calculate the amount of oligosaccharide chains liberated from mucins during the procedure.
Flow cytometric analysis of IgA plasma cells
LPMC from the cecal tissue was isolated by the method as described previously.Citation5) The LPMC was stained with FITC-conjugated anti-rat IgA (MARA-1, AbD Serotec, Oxford, UK) and PE-conjugated anti-rat CD45R (HIS24, BD Biosciences, San Diego, CA, USA) for 1 h at 4 °C. Stained cells were analyzed by Flow cytometer (EPICS-XL, Beckman Coulter, Inc., CA, USA), and IgA plasma cells were defined as IgA+/CD45Rlow cells.Citation26)
Cecal pH and organic acids
A portion of homogenate was diluted with the same weight of distilled water, and then cecal pH was measured with a compact pH meter (Model C-1, Horiba, Tokyo, Japan). Cecal organic acids were measured by the internal standard method using a HPLC.Citation21)
Quantification of bifidobacteria and lactobacilli in cecal contents by real-time polymerase chain reaction (PCR)
DNA was extracted from cecal contents using a fecal DNA isolation kit (MO BIO Laboratories, Carlsbad, CA) according to the manufacturer’s instructions. Amplification and detection of cecal DNA were performed with Light Cycler ST-300 (Roche). Bifidobacterium genus-specific,Citation27) and Lactobacillus genus-specificCitation28) primer pairs were used. Real-time PCR was performed in the condition as described previously.Citation5) Bifidobacterium animalis (JCM 1190T) and Lactobacillus murinus (JCM 1717T) were cultured in De Man, Rogosa, and Sharpe broth (Becton Dickinson, Rockville, MD), and the genomic DNA was extracted by Isoplant-II (Wako) according to the manufacturer’s instructions. Fragments of 16S rDNA were amplified with the Bifidobacterium or Lactobacillus genus-specific primer pairs. The amplicons were purified by the GFXe PCR DNA and Gel Band Purification Kit (GE Healthcare Bioscience, Tokyo, Japan) and cloned in pGEMEasy T vectors (Promega, Madison, WI). Transformation was performed with competent Escherichia coli XL-1 Blue cells plated onto Luria Bertani agar plates supplemented with ampicillin (25 mg/mL), X-Gal (30 mg/mL), and isopropyl β-D-1-thiogalactopyranoside (20 mg/mL), and were incubated overnight at 37 °C. White transformants were picked and grown in Luria Bertani broth. Plasmid DNA was extracted with a QIAprep Spin Miniprep Kit (Qiagen, Germantown, MD) and used as standard for real-time PCR.
RNA isolation and quantitative RT-PCR
Total RNA isolation and quantitative RT-PCR were performed as previously described.Citation29) The primer pairs and protocols for PCR of Muc2,Citation30) pIgR,Citation31) and 18S rRNACitation32) have been previously reported. 18S rRNA was used as an endogenous reference gene. To confirm amplification specificity, the PCR products from each primer pair were subjected to a melting curve analysis. Gene expression was quantified using the comparative CT method,Citation33) and the data were expressed relative to the control group.
Profile analysis of cecal microbiota by PCR-denaturing gradient gel electrophoresis (DGGE)
DNA samples were used as a template to amplify the fragments of the 16S rRNA gene with the universal primers U968-GC and L1401,Citation34) and DGGE analysis of the amplicon was carried out as previously described.Citation35) Quantity One Software (version 4.6.0; Bio-Rad, Hercules, CA) was used for band identification and normalization of band patterns from DGGE gels. A dendrogram showing the similarity of band patterns was constructed using the unweighted pair-group method with arithmetic mean clustering method in the Quantity One Software as previously described.Citation36)
Mucinase activity
Fresh fecal pellets (approx. 100 mg wet weight) were mixed with an ice-cold 0.01 M sodium phosphate buffer (pH 7.5) at a ratio of 1:100 (w/v), and used for mucinase assay by the method of Shiau and ChangCitation37) using porcine stomach mucin as a substrate. Mucinase activities were expressed as reducing sugar liberated from mucins during the procedure. Reducing sugar was measured by the Nelson–Somogyi methodCitation38) using glucose as a standard. Nitrogen contents of fecal homogenate were determined by micro-Kjeldahl method.Citation39) Mucinase activity was expressed as nmol glucose liberated/min/mg nitrogen.
Statistical analyses
The statistical calculations were carried out using JMP8 software (SAS Institute, Cary, NC). Split plot design ANOVA was used to assess the effects of diet, time of exposure, and interactions between diet and time. Individual means at each time point were compared by Student-t test (homogenous) or Welch’s-t test (not homogenous) to assess the effects of diet. Statistical significance was accepted at the p < 0.05. Regression analyses were performed using the Stat Cel 2 program (Tokyo Shoseki). When correlation coefficients were calculated, n was at the level of the diet, not at the level of the individual rat.
Results
In experiment 1, food intake and body weight gain increased steadily until the end of 8 wk. Except for 1 wk, there were no differences in food intake between the two dietary groups (Table ), while body weight gains were lower in rats fed the FOS diet through the whole experimental period. Cecal tissue weight and cecal contents were greater in rats fed the FOS diet than in those fed the control diet regardless of the time period. Cecal pH in the FOS group was lower than in the control group during the whole experimental period, but was steadily increased along with the time. Concentrations of total SCFA in the FOS group increased along with the time, while those in the control group did not change (Table ). This increment in total SCFA in the FOS group was mainly due to an increase of acetate and n-butyrate. Compared with the control group, greater lactate concentration was manifest in the FOS group, but the effect was decreased along with the time, while succinate concentration was greater in the FOS group than in the control group regardless of the time period. As for lactic acid-producing bacteria in the cecal contents, a strong increase in the numbers of lactobacilli was observed in the FOS group at 1 wk, but the effect was not maintained with the time and disappeared within 8 wk of ingestion. There was a trend of the increased number of bifidobacteria in the FOS group at 1 and 2 wk, but was fluctuated considerably during the study.
Table 1. Food intake, body weight gain, cecal variables including weights of tissue and contents, and pH in rats fed the control diet or a diet containing FOS at 60 g/kg diet for 1, 2, 4, or 8 wk (experiment 1).Table Footnotea
Table 2. Cecal organic acids and cecal numbers of lactobacilli and bifidobacteria in rats fed the control diet or a diet containing FOS at 60 g/kg diet for 1, 2, 4, or 8 wk (experiment 1).Table Footnotea
The 16S rRNA gene profiles of the bacterial collections in the cecal samples were generated by PCR coupled with DGGE. The DGGE band profiles of all rats were subjected to the analysis. The intensity and position of detected bands were subjected to cluster analysis (Fig. ). The dendrogram showed that the gut microbiota composition was different between rats fed the control and FOS diets at all of the time period, but that of the control group were also changing along with the time until 8 wk. The microbiota composition in rats fed the FOS diet for 8 wk was resemble the microbiota composition in rats fed the control diet for 8 wk rather than in those fed the FOS diet for 4 wk. Cecal IgA concentrations in the FOS group were greater than in the control group at 1 and 2 wk, but were gradually decreased along with the time and there were no differences at 4 and 8 wk (Fig. (A)). The ratio of IgA plasma cells (defined as cells with IgA+ and CD45Rlow) in the cecal lamina propria was higher in the FOS group than in the control group only at 1 and 2 wk (Fig. (B)). Cecal mucin concentrations were greater in the FOS group than in the control group regardless of the time period. This FOS effect was decreased along with time, but the significant difference was maintained until 8 wk (Fig. (C)).
Fig. 1. PCR-DGGE analysis of cecal microbiota based on 16S rRNA gene sequences in rats fed the control diet or a diet containing FOS at 60 g/kg diet for 1, 2, 4, or 8 wk (expt 1).
Notes: (A) 1 and 2 wk, (B) 4 and 8 wk. Similarities among DGGE band profiles of cecal bacteria were calculated based on the position and intensity of bands, and the dendrogram of DGGE band profiles was constructed by the unweighted pair-group method with arithmetic mean (UPGMA) clustering method. Distances are measured in arbitrary units. C1–C8, samples from rats fed the control diet for 1, 2, 4, or 8 wk. F1–F8, samples from rats fed the FOS diet for 1, 2, 4, or 8 wk.
Fig. 2. Cecal immunoglobulin A (IgA) concentrations (per g wet cecal contents) (A), the percentage of IgA plasma cells (B), and cecal mucin concentrations (per g wet cecal contents) (C) in rats fed the control diet or a diet containing FOS at 60 g/kg diet for 1, 2, 4, or 8 wk (expt 1).
Notes: Data are expressed as the mean ± SE, n = 6. Split plot design ANOVA was used to assess the effects of diet, time of exposure, and interactions between diet and time. Individual means at each time point were compared by Student-t test (*p < 0.05) or Welch’s-t test (#p < 0.05) to assess the effects of diet.
In experiment 2, lower food intake and body weight gain were observed in rats fed the FOS diet, but there were no differences in these indices between rats fed the control and FOS diets at 8 wk (Table ). Cecal variables including tissue weight, content weight, and pH were higher and lower in rats fed the FOS diet than in those fed the control diet regardless of the time period. Elevated concentrations of cecal IgA were reproduced in the FOS group at 1 and 2 wk, but the effects were disappeared at 8 wk (Fig. (A)). As in the case of expt 1, IgA plasma cells in the cecal lamina propria were higher in the FOS group than in the control group at 1 and 2 wk, but the differences were disappeared at 8 wk. However, similar to the results of expt 1, there was a trend that the ratio of IgA plasma cell in the FOS group maintained constant around 40%, while that in the control group increased with the time period (Fig. (B)). The gene expression of pIgR was enhanced in the FOS group at 1 and 2 wk than in the control group (Fig. (C)). During the incubation of cecal contents at 37 °C, cecal IgA was degraded up to 40% (1 wk) and 50% (8 wk), but there were no differences in the degradation rate between the control and FOS groups (Fig. ). Elevated concentrations of cecal mucin were reproduced in the FOS group at 1 and 2 wk. This FOS effect was decreased with the time, but was maintained at 8 wk (Fig. (A)). The gene expression of Muc2 in the cecal tissue did not differ between the two groups regardless of the time period (Fig. (B)). Fecal mucinase activity was higher in the control group than in the FOS group at 1 and 2 wk, but the differences disappeared at 8 wk (Fig. (C)).
Table 3. Food intake, body weight gain, cecal variables including weights of tissue and contents, and ph in rats fed the control diet or a diet containing FOS at 60 g/kg Diet for 1, 2, 4, or 8 wk (experiment 2).Table Footnotea
Fig. 3. Cecal immunoglobulin A (IgA) concentrations (per g wet cecal contents) (A), the percentage of IgA plasma cells (B), and the gene expression of pIgR (relative value) (C) in rats fed the control diet or a diet containing FOS at 60 g/kg diet for 1, 2, or 8 wk (expt 2).
Notes: Data are expressed as the mean ± SE, n = 6. Split plot design ANOVA was used to assess the effects of diet, time of exposure, and interactions between diet and time. Individual means at each time point were compared by Student-t test (*p < 0.05) or Welch’s-t test (#p < 0.05) to assess the effects of diet.
Fig. 4. Changes in immunoglobulin A (IgA) concentrations during the incubation of cecal contents (expt 2).
Notes: Cecal contents were incubated under nitrogen gas at 37 °C for up to 6 h. After incubation, IgA concentrations were determined and compared with values of 0 time incubation as 100%. Each point represented the mean ± SE, n = 6.
Fig. 5. Cecal mucin concentrations (per g wet cecal contents) (A), the gene expression of Muc 2 (relative value) (B), and mucinase activities (per min per mg nitrogen) (C) in rats fed the control diet or a diet containing FOS at 60 g/kg diet for 1, 2, or 8 wk (expt 2).
Notes: Data are expressed as the mean ± SE, n = 6 except for those of mucinase activities (n = 12). Split plot design ANOVA was used to assess the effects of diet, time of exposure, and interactions between diet and time. Individual means at each time point were compared by Student-t test (*p < 0.05) to assess the effects of diet.
Discussion
The purpose of the present study is to examine the effects of FOS on IgA and mucin secretion related to the fermentation products and LAB counts in the rat cecum after different periods of ingestion. In consistent with our previous studies,Citation5,6) short-term ingestion of FOS greatly increased the cecal concentrations of IgA and mucin in rats. However, these effects were attenuated along with a prolonged ingestion of FOS. FOS effects on the IgA concentrations disappeared at 4 and 8 wk, while those on the mucin concentrations remained significant until 8 wk, though the differences from the control at 4 and 8 wk were small (expt 1). A similar trend of IgA and mucin responses to FOS ingestion was also observed in the expt 2. Little digestion of IgA and mucin occurs before the large intestine, so that estimates of IgA and mucin in the cecal contents are necessary to account for the sum of both small intestinal and cecal origin. However, our previous studies showed that the amounts of IgACitation5) and mucinCitation40) in the small intestinal contents did not differ between in rats fed control and a diet containing 6% FOS. The present results therefore suggest that the FOS-induced increases in the cecal concentrations of IgA and mucin at 1 and 2 wk basically reflect greater production and secretion in the cecum. Nevertheless, it is plausible to suggest that the effects of FOS on the cecal concentrations of IgA and mucin considerably differ depending on the ingestion period.
Considerable changes in the cecal fermentation variables were also observed in rats fed the FOS diet during the different periods of ingestion. A prolonged ingestion of FOS increased cecal SCFA concentrations, and decreased lactate concentrations accompanying with increasing pH values and decreasing lactobacilli counts, while these variables were not affected overtime in rats fed the control diet (expt 1). Additionally, DGGE assay in the present study indicated that the microbiota composition in rats fed the FOS diet was changing up to 8 wk. These results were qualitatively similar with the previous results reported by Le Blay et al.Citation12) As for LAB proliferation with short-term ingestion of FOS, our results are in accordance with the previous studies showing that FOS increased the proportion of lactobacilli predominantly in healthy normal rats and mice.Citation13,41) Meanwhile, other studies showed in normal rats and those associated with a human fecal flora that FOS was bifidogenic.Citation42,43) These discrepancies may be originated from the differences in the initial number of bifidobacteria and/or lactobacilli among the respective experiments.Citation44) In the present study, cecal population of bifidobacteria was so fluctuated among individuals that we could not obtain enough data to analyze the physiological significance.
The alterations in cecal fermentation products and microbiota composition during the prolonged ingestion of FOS seem to affect cecal IgA and mucin concentrations. When correlation coefficients among fermentation variables were calculated in the expt 1, cecal IgA concentrations were significantly correlated with lactate concentrations (r = 0.77, p < 0.05), lactobacilli counts (r = 0.92, p < 0.005), and pH values (r = −0.84, p < 0.01) in the cecum, while cecal mucin concentrations showed a weak correlation solely with cecal pH values (r = −0.68, p = 0.07). Although a correlation is not necessarily a cause-and-effect relationship, Kudo et al. also indicated that ingestion of rapidly fermentable fibers for 2 wk resulting in cecal lactate accumulation and lowered pH value increased cecal IgA concentrations irrespective of the chemical structures of the fermented fibers.Citation45,46) Thus, our results and others commonly suggest that the lowered cecal pH has relevance to the increased cecal IgA concentration.
The causal relation between an early elevation of cecal IgA concentrations and lactobacilli proliferation or lowered cecal pH values in rats fed FOS diet is still remained unclear. However, the present study showed that IgA plasma cells in the cecal mucosa significantly increased in rats fed the FOS diet at 1 and 2 wk. Moreover, it is interesting to note that although the ratio of IgA plasma cells in rats fed the FOS diet maintained an elevated steady level (around 40%) up to 8 wk, the FOS-induced early elevation of cecal IgA concentrations returned to the control level at 8 wk. This simply means that the degree of magnitude of the increased number of IgA plasma cells is not necessary coincident with the cecal IgA concentrations in rats fed the FOS diet. Following secretion, the polymeric form of IgA is transported by its receptor (pIgR) across the epithelium to the mucosal surface.Citation47) In the present study, we found that a short-term ingestion of FOS, at 1 wk in particular, significantly increased pIgR expression in the cecal tissue by threefold compared with the control and that this elevation returned to the control level at 8 wk. It is well established that expression of pIgR for IgA by epithelial cells is stimulated by IFN-γ.Citation48) Regarding this, our previous study showed that IFN-γ secretion from the isolated CD4 T cells in cecal lamina propria was up-regulated in rats fed a diet including 6% FOS diet for 2 wk.Citation5) Collectively, it is reasonable to suggest that besides IgA plasma cells, the up-regulation of pIgR may be an important factor for the early elevation of cecal IgA concentrations in rats fed the FOS diet.
As stated above, FOS-induced elevation of cecal IgA concentrations appear to be a transient in adult rats. However, recent study by Gourbeyre et al.Citation49) suggested that the combined exposure (perinatal and postweaning) to galacto-oligosaccharides/inulin mix acted long-term (12 wk) and maintained higher fecal IgA level in mice, suggesting that the prebiotic effect on the mucosal immune response might be most effective in newborn animals. Human studies also showed that early exposure of non-breast-fed infants to oligosaccharides resulted in significantly higher fecal IgA excretion than counterparts.Citation50,51) Further investigations are needed to elucidate the relationship between the effect of FOS on the intestinal IgA secretion and the timing of commencement of FOS treatment.
Neither cecal concentration of acetate nor butyrate correlated with cecal mucin concentrations in the expt 1. Prolonged ingestion of FOS showed significant increases of total SCFA concentrations (butyrate in particular), but cecal mucin concentrations showed a gradual decrease along with ingestion period of FOS. This is totally unexpected, because previous studies suggested that butyrate and acetate caused a significant increase in mucus secretion in the lumen of perfused rat colon.Citation10,11) Our previous study with inulin-type fructans with different DP also suggested that the higher DP fructans predominantly enhanced cecal mucin productions that were likely to respond to cecal SCFA production.Citation6) The reason for these disparities is unclear. In the present study, however, we found that the fecal mucinase activities in rats fed the FOS diet for 1 and 2 wk were strongly depressed by more than 80% compared with those fed the control diet, but returned to the control level at 8 wk. As the results, cecal pH values were positively related to mucinase activities (r = 0.89, p < 0.01), and negatively related to cecal mucin concentrations (r = −0.91, p < 0.01). Shiau and Chang indicated that ingestion of fermentable fibers, being considered to lower cecal pH values, decreased the fecal mucinase activities in rats.Citation37) Further, in the present study, expressions of Muc2, a major secreted protein of the mucus, were not substantially changed by FOS ingestion even at 8 wk (expt 2) where the concentrations of acetate and butyrate are expected to be high from the results of the expt 1. Taken together, it seems reasonable to assume that the early elevation of mucin concentrations by FOS ingestion is mainly due to the strong suppression of mucinase activity related to the lowered cecal pH rather than due to the contribution of SCFA. The lowered cecal pH could influence bacterial mucinase activity by several factors. Supplying the bacteria with rapidly fermentable substrate (FOS in the present study) may permit them to use it in place of mucin, leading to the mucin-sparing effect and thereby the mucin accumulation in the cecum. An alternative explanation for the effect of FOS on mucinase activity may be the replacement of mucin-degrading bacteria by non-degrading species through the lowered cecal pH. Regarding the disparity between our previousCitation6) and present results, what we could only hypothesize is that there might have been differences in mucinase activities among the inulin-type fructans with different DP.
In conclusion, a short-term ingestion of FOS greatly increased the cecal concentrations of IgA and mucin in rats, but these effects were disappeared or attenuated with the prolonged ingestion. Also, the present results implicate that greater expression of pIgR in the cecal mucosa may be an important factor for the early elevation of cecal IgA concentrations and that FOS-induced early elevation of cecal mucin concentrations is mainly due to the suppression of mucinase activity related to the lowered cecal pH. However, we should keep in mind that the relatively high dose of FOS was used in the present study and that a further study is required to examine whether the same explanation for the increases in IgA and mucin concentrations can be extrapolated in a condition where dietary FOS level is moderate. Nevertheless, the present findings may be of benefit for further understanding of the mechanism of FOS effect on the colonic diseases related to the alterations of mucosal barrier function.
Acknowledgments
The study was supported in part by a Grant-in-Aid for Scientific Research from the Ministry of Education, Science, Sports and Culture of Japan. We thank Dr Koji Hase for kindly reviewing the manuscript.
Notes
Abbreviations: DGGE, denaturing gradient gel electrophoresis, DP, degree of polymerization, FOS, fructo-oligosaccharides, LAB, lactic acid-producing bacteria, LPMC, lamina propria mononuclear cells, PCR, polymerase chain reaction, pIgR, polymeric immunoglobulin receptor, SCFA, short-chain fatty acids.
References
- Bornet FR, Brouns F. Immune-stimulating and gut health-promoting properties of short-chain fructo-oligosaccharides. Nutr. Rev. 2002;60:326–334.10.1301/002966402320583442
- Watzl B, Girrbach S, Roller M. Inulin, oligofructose and immunomodulation. Br. J. Nutr. 2005;93:S49–S55.10.1079/BJN20041357
- Bouvet JP, Fischetti VA. Diversity of antibody-mediated immunity at the mucosal barrier. Infect. Immunol. 1999;67:2687–2691.
- Rescigno M. The intestinal epithelial barrier in the control of homeostasis and immunity. Trends Immunol. 2011;32:256–264.10.1016/j.it.2011.04.003
- Ito H, Takemura N, Sonoyama K, Kawagishi H, Topping DL, Conlon MA, Morita T. Degree of polymerization of inulin-type fructans differentially affects number of lactic acid bacteria, intestinal immune functions, and immunoglobulin A secretion in the rat cecum. J. Agric. Food. Chem. 2011;59:5771–5778.10.1021/jf200859z
- Ito H, Wada T, Ohguchi M, Sugiyama K, Kiriyama S, Morita T. The degree of polymerization of inulin-like fructans affects cecal mucin and immunoglobulin A in rats. J. Food Sci. 2008;73:H36–H41.10.1111/j.1750-3841.2008.00686.x
- Fukushima Y, Kawata Y, Hara H, Terada A, Mitsuoka T. Effect of a probiotic formula on intestinal immunoglobulin A production in healthy children. Int. J. Food Microbiol. 1998;42:39–44.10.1016/S0168-1605(98)00056-7
- Takahashi T, Nakagawa E, Nara T, Yajima T, Kuwata T. Effects of orally ingested Bifidobacterium longum on the mucosal IgA response of mice to dietary antigens. Biosci. Biotechnol. Biochem. 1998;62:10–15.10.1271/bbb.62.10
- Takahashi T, Oka T, Iwana H, Kuwata T, Yamamoto Y. Immune response of mice to orally administered lactic acid bacteria. Biosci. Biotechnol. Biochem. 1993;57:1557–1560.10.1271/bbb.57.1557
- Barcelo A, Claustre J, Moro F, Chayvialle JA, Cuber JC, Plaisancie P. Mucin secretion is modulated by luminal factors in the isolated vascularly perfused rat colon. Gut. 2000;46:218–224.10.1136/gut.46.2.218
- Shimotoyodome A, Meguro S, Hase T, Tokimitsu I, Sakata T. Short chain fatty acids but not lactate or succinate stimulate mucus release in the rat colon. Comp. Biochem. Physiol. A: Mol. Integr. Physiol. 2000;125:525–531.10.1016/S1095-6433(00)00183-5
- Le Blay G, Michel C, Blottière HM, Cherbut C. Prolonged intake of fructo-oligosaccharides induces a short-term elevation of lactic acid-producing bacteria and a persistent increase in cecal butyrate in rats. J. Nutr. 1999;129:2231–2235.
- Hosono A, Ozawa A, Kato R, Ohnishi Y, Nakanishi Y, Kimura T, Nakamura R. Dietary fructooligosaccharides induce immunoregulation of intestinal IgA secretion by murine Peyer’s patch cells. Biosci. Biotechnol. Biochem. 2003;67:758–764.10.1271/bbb.67.758
- Nakamura Y, Nosaka S, Suzuki M, Nagafuchi S, Takahashi T, Yajima T, Takenouchi-Ohkubo N, Iwase T, Moro I. Dietary fructooligosaccharides up-regulate immunoglobulin A response and polymeric immunoglobulin receptor expression in intestines of infant mice. Clin. Exp. Immunol. 2004;137:52–58.10.1111/j.1365-2249.2004.02487.x
- Pastorelli L, De Salvo C, Mercado JR, Vecchi M, Pizarro TT. Central role of the gut epithelial barrier in the pathogenesis of chronic intestinal inflammation: lessons learned from animal models and human genetics. Front. Immunol. 2013;4:1–22. Article 280.
- Rubin DC, Shaker A, Levin MS. Chronic intestinal inflammation: inflammatory bowel disease and colitis-associated colon cancer. Front. Immunol. 2012;3:1–10. Article 107.
- Mortensen SB, Kilian M. Purification and characterization of an immunoglobulin A1 protease from Bacteroides melaninogenicus. Infect. Immunol. 1984;45:550–557.
- Senda S, Fujiyama Y, Ushijima T, Hodohara K, Bamba T, Hosoda S, Kobayashi K. Clostridium ramosum, an IgA protease-producing species and its ecology in the human intestinal tract. Microbiol. Immunol. 1985;29:1019–1028.10.1111/mim.1985.29.issue-11
- Derrien M, van Passel MW, van de Bovenkamp JH, Schipper RG, de Vos WM, Dekker J. Mucin-bacterial interactions in the human oral cavity and digestive tract. Gut Microbes. 2010;1:254–268.10.4161/gmic
- Flint HJ, Scott KP, Duncan SH, Louis P, Forano E. Microbial degradation of complex carbohydrates in the gut. Gut Microbes. 2012;3:289–306.10.4161/gmic
- Morita T, Kasaoka S, Ohhashi A, Ikai M, Numasaki Y, Kiriyama S. Resistant proteins alter cecal short-chain fatty acid profiles in rats fed high amylose cornstarch. J. Nutr. 1998;128:1156–1164.
- American Institute of Nutrition. Report of the American Institute of Nutrition ad hoc committee on standards for nutritional studies. J. Nutr. 1977;107:1340–1348.
- Morita T, Tanabe H, Takahashi K, Sugiyama K. Ingestion of resistant starch protects endotoxin influx from the intestinal tract and reduces d-galactosamine-induced liver injury in rats. J. Gastroenterol. Hepatol. 2004;19:303–313.10.1111/jgh.2004.19.issue-3
- Tanabe H, Sugiyama K, Matsuda T, Kiriyama S, Morita T. Small intestinal mucins are secreted in proportion to the settling volume in water of dietary indigestible components in rats. J. Nutr. 2005;135:2431–2437.
- Bovee-Oudenhoven IM, Termont DS, Heidt PJ, Van der Meer R. Increasing the intestinal resistance of rats to the invasive pathogen Salmonella enteritidis: additive effects of dietary lactulose and calcium. Gut. 1997;40:497–504.
- Lin KI, Tunyaplin C, Calame K. Transcriptional regulatory cascades controlling plasma cell differentiation. Immunol. Rev. 2003;194:19–28.10.1034/j.1600-065X.2003.00040.x
- Rinttila T, Kassinen A, Malinen E, Krogius L, Palva A. Development of an extensive set of 16S rDNA-targeted primers for quantification of pathogenic and indigenous bacteria in faecal samples by real-time PCR. J. Appl. Microbiol. 2004;97:1166–1177.10.1111/jam.2004.97.issue-6
- Byun R, Nadkarni MA, Chhour KL, Martin FE, Jacques NA, Hunter N. Quantitative analysis of diverse Lactobacillus species present in advanced dental caries. J. Clin. Microbiol. 2004;42:3128–3136.10.1128/JCM.42.7.3128-3136.2004
- Hino S, Takemura N, Sonoyama K, Morita A, Kawagishi H, Aoe S, Morita T. Small intestinal goblet cell proliferation induced by ingestion of soluble and insoluble dietary fiber is characterized by an increase in sialylated mucins in rats. J. Nutr. 2012;142:1429–1436.10.3945/jn.112.159731
- Tsuboi Y, Kim Y, Paparella MM, Chen N, Schachern PA, Lin J. Pattern changes of mucin gene expression with pneumococcal otitis media. Int. J. Pediat. Otorhinolaryngol. 2001;61:23–30.10.1016/S0165-5876(01)00540-7
- Sonoyama K, Rutatip S, Kasai T. Gene expression of activin, activin receptors, and follistatin in intestinal epithelial cells. Am. J. Physiol. 2000;278:G89–G97.
- Zhu LJ, Altmann SW. mRNA and 18S-RNA coapplication–reverse transcription for quantitative gene expression analysis. Anal. Bioche. 2005;345:102–109.10.1016/j.ab.2005.07.028
- Heid CA, Stevens J, Livak KJ, Williams PM. Real time quantitative PCR. Genome Res. 1996;6:986–994.10.1101/gr.6.10.986
- Zoetendal EG, Akkermans AD, de Vos WM. Temperature gradient gel electrophoresis analysis of 16S rRNA from human fecal samples reveals stable and host-specific communities of active bacteria. Appl. Environ. Microbiol. 1998;64:3854–3859.
- Watanabe J, Sasajima N, Aramaki A, Sonoyama K. Consumption of fructo-oligosaccharide reduces 2,4-dinitrofluorobenzene-induced contact hypersensitivity in mice. Br. J. Nutr. 2008;100:339–346.
- Wasaki J, Rothe A, Kania A, Neumann G, Römheld V, Shinano T, Osaki M, Kandeler E. Root exudation, phosphorus acquisition, and microbial diversity in the rhizosphere of white lupine as affected by phosphorus supply and atmospheric carbon dioxide concentration. J. Environ. Qual. 2005;34:2157–2166.10.2134/jeq2004.0423
- Shiau SY, Chang GW. Effects of dietary fiber on fecal mucinase and beta-glucuronidase activity in rats. J. Nutr. 1983;113:138–144.
- Nelson NA. Photometric adaptation of the Somogyi method for the determination of glucose. J. Biol. Chem. 1944;153:375–380.
- Miller L, Houghton JA. The micro-Kjeldahl determination of the nitrogen content of amino acids and proteins. J. Biol. Chem. 1945;159:373–380.
- Tanabe H, Ito H, Sugiyama K, Kiriyama S, Morita T. Dietary indigestible components exert different regional effects on luminal mucin secretion through their bulk-forming property and fermentability. Biosci. Biotechnol. Biochem. 2006;70:1188–1194.10.1271/bbb.70.1188
- Sakai K, Aramaki K, Takasaki M, Inaba H, Tokunaga T, Ohta A. Effect of dietary short-chain fructooligosaccharides on the cecal microflora in gastrectomized rats. Biosci. Biotechnol. Biochem. 2001;65:264–269.10.1271/bbb.65.264
- Campbell JM, Fahey GC Jr., Wolf BW. Selected indigestible oligosaccharides affect large bowel mass, cecal and fecal short-chain fatty acids, pH and microflora in rats. J. Nutr. 1997;127:130–136.
- Kleessen B, Hartmann L, Blaut M. Oligofructose and long-chain inulin: influence on the gut microbial ecology of rats associated with a human faecal flora. Br. J. Nutr. 2001;86:291–300.10.1079/BJN2001403
- Roberfroid MB, Van Loo JA, Gibson GR. The bifidogenic nature of chicory inulin and its hydrolysis products. J. Nutr. 1998;128:11–19.
- Kudoh K, Shimizu J, Ishiyama A, Wada M, Takita T, Kanke Y, Innami S. Secretion and excretion of immunoglobulin A to cecum and feces differ with type of indigestible sacchrides. J. Nutr. Sci. Vitaminol. 1999;45:173–181.10.3177/jnsv.45.173
- Kudoh K, Shimizu J, Wada M, Takita T, Kanke Y, Innami S. Effect of indigestible saccharides on B lymphocyte response of intestinal mucosa and cecal fermentation in rats. J. Nutr. Sci. Vitaminol. 1998;44:103–112.10.3177/jnsv.44.103
- Pabst O. New concepts in the generation and functions of IgA. Nat. Rev. Immunol. 2012;12:821–832.10.1038/nri3322
- Sollid LM, Kvale D, Brandtzaeg P, Markussen G, Thorsby E. Interferon-γ enhances expression of secretory component, the epithelial receptor for polymeric immunoglobulins. J. Immunol. 1987;138:4303–4306.
- Gourbeyre P, Desbuards N, Grémy G, Le Gall S, Champ M, Denery-Papini S, Bodinier M. Exposure to a galactooligosaccharides/inulin prebiotic mix at different developmental time points differentially modulates immune responses in mice. J. Agric. Food. Chem. 2012;60:11942–11951.10.1021/jf3036403
- Kukkonen K, Kuitunen M, Haahtela T, Korpela R, Poussa T, Savilahti E. High intestinal IgA associates with reduced risk of IgE-associated allergic diseases. Pediatr. Allergy Immunol. 2010;21:67–73.10.1111/pai.2010.21.issue-1-Part-I
- Scholtens PA, Alliet P, Raes M, Alles MS, Kroes H, Boehm G, Knippels LM, Knol J, Vandenplas Y. Fecal secretory immunoglobulin A is increased in healthy infants who receive a formula with short-chain galacto-oligosaccharides and long-chain fructo-oligosaccharides. J. Nutr. 2008;138:1141–1147.