
Abstract
A single-laboratory validation study was conducted on an HPLC method for the detection and quantification of caffeic acid (CA) and seven species of caffeoylquinic acids (CQAs) in lyophilized sweet potato leaves. The procedure for extraction of the analytes from the matrix and the HPLC conditions for the efficient separation of CA and CQAs were optimized. In the proposed method, a relative response factor to one of the CQAs (5-CQA) was used to quantify the others. The method performed well in terms of precision when carried out on five different days and demonstrated Horwitz ratio (HorRat) scores ranging from 0.5 to 1.0 for all analytes, which were well within the limits of performance acceptability. Accuracy testing at three levels showed an overall recovery of 94% when duplicated on five different days. Moreover, a stability study revealed that all analytes in both standard solution and sample extract were stable for 28 days.
Graphical Abstract
Main contents of the article titled “Single-laboratory validation for the determination of caffeic acid and seven caffeoylquinic acids in sweet potato leaves”
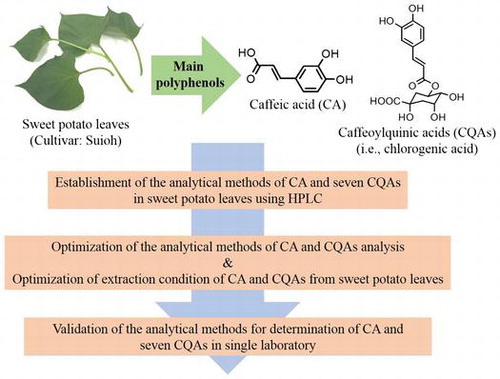
Caffeoylquinic acids (CQAs), a class of naturally occurring polyphenolic compounds (Fig. ), are widely distributed in plants in high amounts. Especially, coffee beans (27.9–52.0 g kg−1 dw), eggplant plant fruits (14.1–28.0 g kg−1 dw), mate tea (4.8–24.9 g kg−1 dw), and sweet potato leaves (14.2–171 g kg−1 dw) contained high amount of CQAs.Citation1–4) In addition, it is estimated that humans consume up to 1.0 g of CQAs per day.Citation5) CQAs have several beneficial properties, and in in vitro and in vivo experiments, have been found to induce anti-oxidant,Citation6) anti-hyperglycemic,Citation7) anti-melanogenic,Citation8) and neuroprotective effects.Citation9) Miyamae and his colleagues reported that CQAs inhibited the aggregation of neurotoxic Aβ42, and they also reported that 4,5-diCQA and 3,4,5-triCQA more strongly inhibited the aggregation of Aβ42 than other CQAs.Citation10) Moreover, the four diCQAs (3,4-, 3,5-, 4,5-, and 1,5-diCQAs) inhibited the replication to a greater extent than CA and 5-CQA.Citation11) Our previous experiments revealed that sweet potato leaves have a higher CQA content compared to other major commercial vegetables.Citation4) Our previous experiments also showed that the order of the anti-mutagenicity of CQAs was as follows: 3,4,5-triCQA > diCQAs > 5-CQA.Citation12) About a decade ago, NARO/KARC developed “Suioh”, a sweet potato cultivar, whose leaves are also edible.Citation13) “Suioh” is cultivated in the Kyushu, Tohoku, Kanto, and Chugoku regions of Japan and is used for making flour, paste, vegetable juice, and tea. “Suioh” leaves contain caffeic acid (CA) and five species of CQAs, namely, chlorogenic acid (5-CQA); 3,4-dicaffeoylquinic acid (3,4-diCQA); 3,5-dicaffeoylquinic acid (3,5-diCQA); 4,5-dicaffeoylquinic acid (4,5-diCQA); and 3,4,5-tricaffeoylquinic acid (3,4,5-triCQA).Citation14) Although the presence of neochlorogenic acid (3-CQA) and cryptochlorogenic acid (4-CQA) in sweet potato leaves has been suggested, we could not determine them in our previous studies. On the other hand, Zheng and Clifford detected 3-CQA and 4-CQA in sweet potato leaves and stems by qualitative analysis using structure-diagnostic LC-MS.Citation15) Since analytical methods for the quantification of CQAs have not been standardized yet, the analytical values cannot be compared and quality management has not been carried out. CQAs are analyzed by comparing the retention time with that of known standards using HPLC, and the amount of CQAs is calculated as CA or 5-CQA equivalent or compared using the relative amount,Citation16,17) because CQAs except for 5-CQA cannot be obtained easily as a commercial reagent and they are expensive if available. Therefore, the relative response factor (RRF), which is determined by the analysis of standards and used to compute the true concentrations of compounds in samples, was used for the analysis of CQAs in this study. RRFs were computed for each compound based on the ratio of the molar extinction coefficient and the molecular mass of authentic CQA standards. In this analytical method, if once RRFs for individual CQAs are determined, the standard solution required will be only that of 5-CQA for the CQAs determination, thereby reducing the cost of standard reagents, saving the experimental times, and making experimental operations simple.
Fig. 1. Chemical structures of caffeic acid (CA) and caffeoylquinic acids (CQAs) in sweet potato leaves.
Note: Sweet potato storage roots contain CA, 3-CQA, 4-CQA, 5-CQA, 3,4-diCQA, 3,5-diCQA, and 4,5-diCQA, but not 3,4,5-triCQA. All data for CQAs presented in this manuscript use the recommended IUPAC numbering system.Citation28)
The objectives of this study were (1) to optimize the extraction and HPLC conditions for the quantification of CA and seven species of CQAs (3-CQA, 4-CQA, 5-CQA, 3,4-diCQA, 3,5-diCQA, 4,5-diCQA, and 3,4,5-triCQA) in sweet potato leaves and storage roots, (2) to determine the intra-laboratory precision using single-laboratory validation study, and (3) to define the trueness of the method by performing a spike and recovery test with high concentrations of sweet potato leaf powder. Because of the lack of qualitative certified reference materials, an RRF was used, which is a useful tool for identifying phytochemicals, with respect to 5-CQA.
Materials and methods
Plant materials
Sweet potato cultivars, “Suioh” for leaf sampling and “Akemurasaki” for storage root sampling, were grown at the Miyakonojo Branch of NARO Kyushu Okinawa Agricultural Research Center (131°1′E, 31°45′N). Tops of “Suioh” were harvested in a greenhouse in April 2013. They were washed with tap water and cut into three parts, namely, leaves, petioles, and stems. Leaves were used in this study. The lyophilized leaves were milled to powder by a grinder mill (GM-200, Verder Scientific Co., Ltd., Haan, Germany) and stored at −20 °C until use. The storage roots of “Akemurasaki” were harvested from a field in September 2011. Both the end portions of the storage roots were removed. The remaining portions were peeled, lyophilized, and milled to powder as described above.
Reagents
CA and 5-CQA were purchased from Funakoshi Co., Ltd. (Tokyo, Japan) and Sigma-Aldrich (St Louis, MO, USA), respectively, and used as standards. The other six CQAs were purchased from Chengdu Biopurify Phytochemicals Ltd. (Chengdu, China). Based on HPLC analysis, CA and CQAs were found to be more than 97.9% pure. HPLC-grade acetonitrile was used as the mobile phase. Deionized water with a specific resistivity of 18.2 MΩ cm was used. Other chemicals were of reagent grade.
Determination of RRF
CA and all CQAs (CA, 3-CQA, 4-CQA, 5-CQA, 3,4-diCQA, 3,5-diCQA, 4,5-diCQA, and 3,4,5-triCQA) were weighed (> 1 mg), and dissolved in an 80% (v/v) ethanol aqueous solution. The sample solution was transferred into a volumetric flask and was made up to the volume with the same solution. The absorbance of the solution at 326 nm was measured using a spectrophotometer (path length = 1 cm; V-560, JASCO, Tokyo, Japan). For CQAs, the RRFs were calculated using the molecular weight and molar extinction coefficient of individual compounds, as described below, using the equation
where Mr sample is the molecular weight of individual CQAs; ε (5-CQA) is the molar extinction coefficient of 5-CQA; Mr 5-CQA is the molecular weight of 5-CQA; ε (sample) is the molar extinction coefficient of individual CQAs.
The molar extinction coefficient was determined in three to four replicate measurements, and the coefficient of variation was found to be less than 8% for each value.
Extraction of CA and CQAs from sweet potato leaves
Sweet potato leaf or storage root powder (250 mg) was weighed in a 50-mL glass centrifugal tube, and 9 mL of 80% (v/v) ethanol aqueous solution was added. After vigorously shaking the sample by a vortex mixer, the tube was capped and immersed in a water bath at 37 °C and sonicated for 5 min at an oscillating frequency of 40 kHz. The tubes were then incubated for 10 min in a water bath at 37 °C and centrifuged at 1870 × g for 10 min. The supernatant was transferred into a 25-mL volumetric flask. The extraction procedure was repeated twice with 8 mL of ethanol aqueous solution, and the final volume of the extract was made up to 25 mL.
Optimization of extraction conditions
Samples (sweet potato leaves and storage roots) were extracted with different concentrations of ethanol aqueous solution [ethanol concentration: 20, 40, 60, 80, or 100% (v/v)]. The extraction was repeated three times as described above, and the extracted solution was subjected to HPLC analysis. The ethanol concentration for the extraction solvent was optimized by comparing the total polyphenol content of CA and CQAs. In order to optimize the number of extractions required, the concentrations of CA and CQAs in each of five successive extractions were compared.
Chromatography
The extract was filtered through a 0.45-μm PVDF membrane, and 5 μL of the filtrate was injected into the HPLC system for analysis. The HPLC system consisted of a Model PU-2080i plus pump, a Model LG-2080-04 low-pressure gradient unit, a Model DG-2080-54 degasser, a Model AS-2057 plus auto injector, a Model CO-2060 plus column oven, and a Model UV-2070 plus detector with a conventional flow cell of 17 μL intrinsic volume (JASCO, Tokyo, Japan). Standard and sample solutions were stored at −20 °C before HPLC analysis. A Cadenza CD-C18 column (250 mm × 4.6 mm i.d., 3 μm, Imtakt, Kyoto, Japan) was used; the column was warmed at 40 °C in the column oven. The mobile phase consisted of water containing 0.4% (v/v) formic acid (A) and 100% acetonitrile (B). Elution was conducted with a linear gradient as follows: 7–40% (B) from 0 to 33 min, with a flow rate of 1 mL/min. Wavelength was set at 326 nm for monitoring CA and CQAs. The system was controlled by a ChromNAV (version 1.18.03) workstation (JASCO, Tokyo, Japan). The peaks of CA and CQAs were identified by comparing their retention time with those of authentic reagents. If necessary, the extract was diluted with the same extraction solvent to adjust the analyte concentration within the calibration range.
Calculation of the amount of CA and individual CQAs in sweet potato leaves
The concentration of CA or individual CQAs in the sample solution was calculated using the following equation:
where C is the concentration of CA or individual CQA in μg g−1; Asample is the peak area of CA or CQA; Aintercept is the peak area of a calibration curve y-axis intercept; Vsample is the amount of sample extraction (L); d is the dilution factor of sample solution; S is the slope of a calibration curve; and Msample is the amount of sample (g). The concentration of CA and 5-CQA was determined using the calibration curve of each authentic sample, and RRF of 1.0. On the other hand, the concentrations of individual CQAs, expect for 5-CQA, were determined to multiply each RRF (Table ) by the concentration equivalent to 5-CQA using the calibration curve of the authentic 5-CQA reagent.
Table 1. Molar extinction coefficient, molecular weight, and relation response factor of individual caffeoylquinic acid in sweet potato leaves.
Preparation of stock standard solution and working standard solutions
CA or 5-CQA (25 mg each) was dissolved in 50 mL of 80% (v/v) ethanol aqueous solution. The solutions were transferred into a polypropylene tube of 50 mL each and stored at −20 °C when not in use. The stock standard solution was found to be stable for at least a month. Working standard solutions were freshly prepared by diluting the stock standard solution with 80% (v/v) ethanol aqueous solution. The concentrations of CA in the working standard solution were 60, 45, 30, 15, 7.5, 0.15 μg/mL, while those of 5-CQA were 80, 60, 40, 20, 10, 0.2 μg/mL. Each standard solution was subjected to HPLC analysis under the same conditions as described above in duplicate, and a 6-point calibration graph was obtained for each sample by plotting peak area (y-axis) vs. concentration (x-axis).
Precision and accuracy test of the proposed method
“Suioh” leaf powder was used as a matrix blank. “POLYPHEMIN POWDER®” (Shinsei Kosan Co. Ltd., Miyazaki, Japan) with high concentrations of CA and CQAs; besides, 3,4,5-triCQA was used as a material fortified to matrix. The fortifier was resolved in an 80% (v/v) ethanol solution and spiked to sweet potato leaf (250 mg each) at 2.25, 4.5, and 9.0 g/kg of the total polyphenol content. After spiking the fortifier, the sample was allowed to stand for at least 15 min until the extraction procedure started. Fortified and unfortified samples were extracted as described above, concentrations of CA and CQAs were determined, and the percentage recovery was calculated. Duplicate measurements were repeated on five different days. According to the guideline of AOAC International, recovery, repeatability standard deviation (RSDr), and intermediate precision relative standard deviation (RSDint) were obtained from this experiment schedule.
Stability studies
The stability of CA and CQAs in a standard solution of CA and 5-CQA and in sweet potato leaves extract was evaluated. The standard solution and extracted samples were aliquoted in a polypropylene tube with a cap (safe-lock tubes, Eppendorf, Tokyo, Japan) and stored at −20 °C. Aliquots of the standard solution and the extracted samples were subjected to HPLC on the 1st, 5th, 7th, 14th, 21st, and 28th day after sample preparation.
Statistical analysis
The repeatability and intermediate standard deviations for the CA and CQA contents were calculated by one-way analysis of variance, and the stability of CA and CQAs in standard solution and the extracted sample from sweet potato leaves was evaluated by a linear regression model of Microsoft® Excel® 2013.
Results and discussion
RRF of CQAs
Since there is no quantitative certified reference material for CQAs, the standards used in this study were purchased and were found to be >97.9% pure, as determined by HPLC with UV detection at 326 nm. Because the major objective of this study was to evaluate the performance of the HPLC method, it was appropriate to use the RRF instead of the calibration curve for individual CQAs for the determination of CQAs. The RRF has been used for the HPLC determination of catechins,Citation18) isoflavones,Citation19,20) and anthocyaninsCitation21) in tea, soybean products, and purple-fleshed sweet potato, respectively. Moreover, it was revealed that usage of RRF is effective for satisfactory precision of analysis in single- or multi-laboratory studies.Citation18,19)
Table summarizes the RRF for individual CQAs with respect to chlorogenic acid (5-CQA). The RRF ranges from 0.810 to 1.121. The values for mono-CQAs (3-CQA and 4-CQA) were higher than 1, while those for di- and triCQAs (3,4-diCQA, 3,5-diCQA, 4,5-diCQA, 3,4,5-triCQA) were lower than 1.
Optimization of extraction efficacy
Polyphenolic compounds are typically extracted using an ethanol aqueous solution. In this study, the extraction efficacy for CA and CQAs in sweet potato leaves was examined using an aqueous solution containing different concentrations of ethanol. Among the extraction solvents tested, solvents with lower ethanol concentration extracted significantly lower amounts of total CA and CQAs, as shown in Fig. . An 80% (v/v) ethanol aqueous solution extracted the highest amount of individual CA and CQAs, although their total contents were illustrated in Fig. . However, the total extracted amount of CA and CQAs decreased when the ethanol concentration reached 99.5% (v/v). Similar observations were made during the extraction of sweet potato storage roots with purple flesh containing anthocyanins acrylated with sugars, cinnamic acids and so on (data not shown). It was reported that maximum amount of phenolics in black currant extracts was obtained at about 60% (v/v) ethanol and that the extracted amount decreased with further increase in ethanol concentration.Citation22) Nepote and his colleagues also found that an increase in ethanol concentration beyond 70% (v/v) dramatically reduced the amount of phenolics extracted from peanut skins.Citation23) In this study, the optimum ethanol concentration was found to be higher than that in the previous reports. This is probably the reason why a kind of polyphenolic compounds extracted and matrix containing the objective compounds was different from those previously reported. Hence, we decided to use 80% (v/v) ethanol aqueous solution as the extraction solvent for sweet potato leaves and storage roots.
Fig. 2. Effect of ethanol concentration on total caffeic acid and caffeoylquinic acid contents extracted from sweet potato leaves.
Note: Content is expressed as μg per g of dry weight. Mean values (n = 3) are shown.
Generally, the extraction efficiency of phenolic compounds from plant materials is affected by the number of extraction steps as well as the solvent used.Citation24) In this study, sweet potato leaves were extracted five times using an 80% (v/v) ethanol aqueous solution, and the sample prepared from each extracted solution was subjected to HPLC. Peaks of 5-CQA and 3,5-diCQA were detected in the sample solutions obtained from the first to third extraction. Peaks of CA and other CQAs were detected in the solutions obtained from the first and second extractions, because of the low levels of these compounds in sweet potato leaves. A similar observation was made for sweet potato storage roots with purple flesh containing mono- and diCQAs (data not shown). Thus, the number of extractions required was decided to be three since the amount of CA and CQAs extracted was found to be satisfactory from both sweet potato leaves and storage roots.
System selectivity
In our previous study, the HPLC conditions were optimized to separate and quantify CA and CQAs in sweet potato leaves and storage roots with yellow, white, or orange flesh.Citation16) In order to quantify CQAs in both sweet potato leaves and storage roots with purple flesh, we modified the conditions because the peaks of anthocyanins in the storage roots of sweet potato with purple flesh were detected to be close to that of CQAs. The modified conditions resulted in good separation between the peaks of CA, CQAs, and anthocyanins. Under these conditions, the extract of sweet potato leaves cultivar “Suioh” of CA and CQAs eluted in the order 3-CQA, 5-CQA, 4-CQA, CA, 3,4-diCQA, 3,5-diCQA, 4,5-diCQA, and 3,4,5-triCQA with retention times (in min) of 7.84, 10.70, 11.02, 12.63, 19.25, 20.10, 21.42, and 26.32, respectively, as shown in Fig. (A). Moreover, Fig. (B) also shows a chromatogram of each CA and seven CQAs standards. An adequate resolution of more than 1.5 between two adjacent peaks of the standard reagents of CA and CQAs was observed for all target analytes. Carryover was observed when the sample solution from sweet potato leaves and then, the blank (extraction solvent; 80% (v/v) ethanol aqueous solution) were injected to HPLC, in which that the same extraction solvent was injected to HPLC using the extraction solvent for washing the autosampler syringe. This indicated that the use of the extraction solvent (80% (v/v) ethanol aqueous solution) was inadequate to wash the syringe completely. Among various solvents tested, we chose degassed methanol as a preferable washing solvent to avoid carryover.
Fig. 3. Typical reversed-phase HPLC chromatogram of the extract of sweet potato leaves cultivar “Suioh” (A) and standard solutions (B).
Notes: Peak 1, neochlorogenic acid (7.84 min); peak 2, chlorogenic acid (10.70 min); peak 3, cryptochlorogenic acid (11.02 min); peak 4, caffeic acid (12.63 min); peak 5, 3,4-dicaffeoylquinic acid (19.25 min); peak 6, 3,5-dicaffeoylquinic acid (20.10 min); peak 7, 4,5-dicaffeoylquinic acid (21.42 min); peak 8, 3,4,5-tricaffeoylquinic acid (26.32 min).
Linearity of calibration curve
Mixtures with six different concentrations of standard solutions of CA and 5-CQA were randomly injected into the HPLC system. Peak areas for CA and 5-CQA were plotted, and a linear regression model was used to determine the slope and y-intercept. HPLC analyses for constructing the calibration graph were performed ten times on separate days, and the correlation coefficients were always greater than 0.999, that is, in the range of 0.15–60 mg/L and 0.2–80 mg/L for CA and 5-CQA, respectively (Table ). Changes in the slope were not observed in any of the replications, and the coefficient of variance was 0.78 and 1.53% for CA and 5-CQA, respectively. Furthermore, the linear regression analysis of 10 calibration curves for each standard reagent demonstrated that a 95% confidence interval for the y-intercept included zero. Hence, it was concluded that the y-intercept did not differ from zero at the 0.05 level of significance. However, the point of the origin of the coordinates was not used to construct the calibration graph in this study.
Table 2. Calibration curve data for caffeic acid and chlorogenic acid.
Precision of the proposed method
Precision was evaluated by performing sample extraction and analyses on sweet potato leaves on five different days. Table summarizes the precision results obtained over the course of five days. The average concentrations of CA and CQAs in sweet potato leaves sample were 125, 1594, 986, 9641, 2325, 20403, 1633, and 14-μg/g dry matter for CA, 3-CQA, 4-CQA, 5-CQA, 3,4-diCQA, 3,5-diCQA, 4,5-diCQA, and 3,4,5-triCQA, respectively. A statistical treatment revealed that the relative standard deviation of RSDr and RSDint for the determination of each CA and CQA content were 2.4–4.3% and 2.7–10.4%, respectively. In this study, we used Horwitz ratio (HorRat), the ratio of the observed RSDint to the corresponding predicted relative standard deviation of the reproducibility (PRSDR) calculated by the Horwitz equation (HorRat = RSDint/PRSDR). The value of RSDint was compared with the predicted levels of precision obtained from the Horwitz equation,
Table 3. Repeated measurements for determining the content of caffeic acid and caffeoylquinic acids in sweet potato leaves on dry basis.
where C is the commonly measured concentration of the analyte in the sample, expressed as a mass fraction. The HorRat can be used as normalized performance parameter to indicate the acceptability of the precision of the method.Citation25) The HorRat value of each CA and CQA derivative ranged from 0.5 to 1.0, as shown in Table . According to the single-laboratory validation guidelines of AOAC INTERNATIONAL,Citation26) the acceptable HorRat values are 0.3–1.3, indicating satisfactory precision for the proposed method.
Accuracy of the proposed method
A recovery study based on spiking a concentrate of sweet potato leaf extract into negative control material (freeze-dried sweet potato leaves powder) at 100, 50, and 25% of the expected level was performed on five different days. The spike recovery results are given in Table . At low-level addition, the average recoveries of CA and CQAs ranged from 94 to 99%, with the RSDr ranging from 1.4 to 3.3% and the RSDint ranging from 2.4 to 5.5%. At middle-level addition, the average recoveries ranged from 96 to 101%, with the RSDr ranging from 1.3 to 3.1% and the RSDint ranging from 2.9 to 4.1%. At high-level addition, the average recoveries ranged from 97 to 99%, with the RSDr ranging from 1.3 to 3.2% and the RSDint ranging from 1.9 to 4.0%. The guideline of AOAC International for single-laboratory validation describes that the expected recovery as a function of analyte concentration ranges from 90 to 108% and from 92 to 105% for analyte concentrations of 0.1 and 1%, respectively.Citation27) These results clearly demonstrate that the satisfactory accuracy of the method for quantifying the contents of CA and CQAs, except for 3,4,5-triCQA, in sweet potato leaves.
Table 4. Recovery of caffeic acid and caffeoylquinic acids from sweet potato leaves spiked its polyphenol concentrate with three different concentrations.
Stability of the standard solution and the solution prepared from sweet potato leaves
Stabilities of CA and CQAs were assessed after 1, 5, 7, 14, 21, and 28 days of storage at −20 °C. In this study, a sample solution extracted from sweet potato leaves and a standard stock solution of CA and 5-CQA were used. Analysis of the HPLC data using a linear regression model revealed that all the slopes for CA and CQAs in the extracted solution from sweet potato leaves were indistinguishable from zero (p values > 0.05) (Table ). In addition, the standard solution of CA and 5-CQA showed similar results to that of the sample extraction from sweet potato leaves (data not shown). Thus, it was concluded that there was no significant change in the concentration of the stock standard solution and the extracted solution from sweet potato leaves during a storage period of 28 days at −20 °C.
Table 5. Stability of CA and individual caffeoylquinic acid in the extract of sweet potato leaves during storage.
Conclusions
In this study, conditions were optimized to extract CA and CQAs effectively from sweet potato leaves and storage roots and separate eight analytes from each other satisfactorily. In the proposed method, an RRF for 5-CQA was used to determine the CQAs. A single-laboratory validation of the method was successfully performed. The obtained data confirmed the high accuracy and precision of the method. This method is applicable to the analysis of CA and CQAs in freeze-dried powder of sweet potato leaves.
Notes
Abbreviations:CA, caffeic acid; CQA, Caffeoylquinic acid; HorRat, Horwitz ratio; RRF, relative response factor; RSDr, repeatability standard deviation; RSDint, intermediate precision relative standard deviation; PRSDR, predicted reproducibility relative standard deviation.
References
- Monteiro MC, Farah A. Chlorogenic acids in Brazilian Coffea arabica cultivars from various consecutive years. Food Chem. 2012;134:611–614.10.1016/j.foodchem.2012.02.118
- Mennella G, Lo Scalzo R, Fibiani M, D’Alessandro A, Francese G, Toppino L, Acciarri N, de Almeida AE, Rotino GL. Chemical and bioactive quality traits during fruit ripening in eggplant (S. melongena L.) and allied species. J Agric Food Chem. 2012;60:11821–11831.10.1021/jf3037424
- Heck CI, Schmalko M, González de Mejía E. Effect of growing and drying conditions on the phenolic composition of mate teas (Ilex paraguariensis). J Agric. Food Chem. 2008;56:8394–8403.10.1021/jf801748s
- Islam MS, Yoshimoto M, Yahara S, Okuno S, Ishiguro K, Yamakawa O. Identification and characterization of foliar polyphenolic composition in sweetpotato (Ipomoea batatas L.) genotypes. J. Agric. Food. Chem. 2002;50:3718–3722.10.1021/jf020120l
- Chen ZY, Peng C, Jiao R, Wong YM, Yang N, Huang Y. Anti-hypertensive nutraceuticals and functional foods. J. Agric. Food Chem. 2009;57:4485–4499.10.1021/jf900803r
- Chuda Y, Ono H, Ohnishi-Kameyama M, Nagata T, Tsushida T. Structural identification of two antioxidant quinic acid derivatives from garland (Chrysanthemum coronarium L.). J. Agric. Food. Chem. 1996;44:2037–2039.10.1021/jf960182+
- Guan Y, Wu T, Lin M, Ye J. Determination of pharmacologically active ingredients of sweetpotato (Ipomoea batatas L.) by capillary electrophoresis with electrochemical detection. J. Agri Food Chem. 2006;54:24–28.10.1021/jf0508347
- Shimozono H, Kobori M, Shinmoto H, Tsushida T. Suppression of the melanogenesis of mouse melanoma b16 cells by sweet potato extract. Nippon Shokuhin Kogaku Kaishi. 1996;43:313–317. Japanese.10.3136/nskkk.43.313
- Sasaki K, Han J, Shimozono H, Villareal OM, Isoda H. Caffeoylquinic acid-rich purple sweet potato extract, with or without anthocyanin, imparts neuroprotection and contributes to the improvement of spatial learning and memory of SAMP8 mouse. J. Agric. Food. Chem. 2013;61:5037–5045.10.1021/jf3041484
- Miyamae Y, Kurisu M, Murakami K, Han J, Isoda H, Irie K, Shigemori H. Protective effects of caffeoylquinic acids on the aggregation and neurotoxicity of the 42-residue amyloid β-protein. Bioorg. Med. Chem. 2012;20:5844–5849.10.1016/j.bmc.2012.08.001
- Robinson WE, Cordeiro M, Abdel-Malek S, Jia Q, Chow SA, Reinecke MG, Mitchell WM. Dicaffeoylquinic acid inhibitors of human immunodeficiency virus integrase: inhibition of the core catalytic domain of human immunodeficiency virus integrase. Mol. Pharmacol. 1996;50:846–855.
- Yoshimoto M. Antimutagenicity of mono-, di-, and tricaffeoylquinic acid derivatives isolated from sweetpotato (Ipomoea batatas L.) leaf. Biosci. Biotechnol. Biochem. 2002;66:2336–2341.10.1271/bbb.66.2336
- Ishiguro K, Toyama J, Islam MS, Yoshimoto M, Kumagai T, Kai Y, Nakazawa Y. Yamakawa O. Suioh, a New sweetpotato cultivar for utilization in vegetable greens Acta Hort. 2004;637:339–345.
- Ishiguro K, Yoshimoto M, Tsubata M, Takagaki K. Hypotensive effect of sweetpotato tops. Nippon Shokuhin Kagaku Kogaku Kaishi. 2007;54:45–49. Japanese.10.3136/nskkk.54.45
- Zheng W, Clifford MN. Profiling the chlorogenic acids of sweet potato (Ipomoea batatas) from China. Food Chem. 2008;106:147–152.10.1016/j.foodchem.2007.05.053
- Okuno S, Ishiguro K, Yoshinaga M, Yoshimoto M. Analysis of six caffeic acid derivatives in sweetpotato leaves by high-performance liquid chromatography using a short column. Jpn. Agric. Res. Quart. 2010;44:415–420.10.6090/jarq.44.415
- Padda MS, Picha DH. Methodology optimization for quantification of total phenolics and individual phenolic acids in sweetpotato (Ipomoea batatas L.) roots. J. Food. Sci. 2007;72:C412–C416.10.1111/jfds.2007.72.issue-7
- ISO/CD 14502-2 (Committee Draft Number). Methods for determination of substances characteristic of green and black tea. Part 2: Determination of catechins in green tea – Method using high performance liquid chromatography; 2005. p. 9–10.
- Collison MW. Determination of total soy isoflavones in dietary supplements, supplement ingredients, and soy foods by high-performance liquid chromatography with ultraviolet detection: collaborative study. J. AOAC Int. 2008;91:489–500.
- Lin LZ, Harnly JM. Quantitation of flavanols, proanthocyanidins, isoflavones, flavanones, dihydrochalcones, stilbenes, benzoic acid derivatives using ultraviolet absorbance after identification by liquid chromatography–mass spectrometry. J Agric Food Chem. 2012;60:5832–5840.10.1021/jf3006905
- Terahara N, Oki T, Matsui T, Fukui K, Sugita K, Matsumoto K, Suda I. Simultaneous determination of major anthocyanins in purple sweet potato. Nippon Shokuhin Kagaku Kogaku Kaishi. 2007;54:33–38. Japanese.10.3136/nskkk.54.33
- Cacace JE, Mazza G. Optimization of extraction of anthocyanins from black currants with aqueous ethanol. J. Food Sci. 2003;68:240–248.10.1111/jfds.2003.68.issue-1
- Nepote V, Grosso NR, Guzman CA. Optimization of extraction of phenolic antioxidants from peanut skins. J. Sci. Food Agric. 2005;85:33–38.10.1002/(ISSN)1097-0010
- Shahidi F, Naczk M. Phenolics in food and nutraceuticals. Boca Raton, FL: CRC Press; 2003. p. 490.
- Horwitz W, Albert R. The Horwitz Ratio (HorRat): a useful index of method performance with respect to precision. AOAC Int. 2006;89:1095–1109.
- Latimer Jr. G. AOAC Int., Appendix F: Guidelines for Standard Method Performance Requirements. Official Methods of Analysis of AOAC Int. 19th ed. Gaithersburg, MD: USA; 2012. http://www.eoma.aoac.org/app_f.pdf
- Latimer Jr. G. AOAC Int. AOAC Guidelines for Single Laboratory Validation of Chemical Methods for Dietary Supplements and Botanicals. Official Methods of Analysis of AOAC Int. 19th ed. Gaithersburg, MD: USA; 2012.
- IUPAC. Nomenclature of cyclitols. Biochem. J. 1976;153:23–31.