
Abstract
A full set of optimization procedure was applied to the extraction of anti-viral polysaccharides from Duchesnea indica (Andrews) Focke. By Plackett–Burman factorial design, three parameters (extraction time, extraction temperature, and ratio of water to raw material) were identified as significant to the extraction yield. However, no significant parameters had been identified for antiviral activity. A three-level-three-factor Box–Behnken factorial design was then employed to further optimize the extraction condition. The experimental data were fitted to a second-order polynomial equation using multiple regression analysis and also examined using appropriate statistical methods. This led to the construction of a response surface indicating the optimal values for each parameter and response studied. Concerning the extraction yield, an extraction at 98.51 ºC for 6.16 h with a ratio of water to raw material of 30.94 mL/g was found to be optimal. Under the optimized conditions, the experimental yield was 6.430 ± 0.078%, which was well matched with the predicted yield of 6.509%.
Graphical Abstract
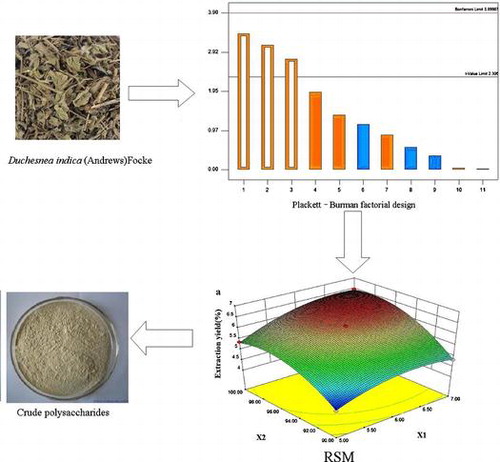
Extraction of anti-viral polysaccharides from Duchesnea indica (Andrews) Focke is optimized by response surface methodology.
Duchesnea indica (Andrews) Focke, also named Indian Mock strawberry Herb, belongs to the Rosaceae family and distributes extensively in South Asia. It has been employed as a folk medicine for centuries in China in various clinical settings, especially for infection caused by varicella-zoster virus (VZV).Citation1) VZV is a human neurotropic alpha herpes virus which becomes latent in ganglionic neurons along the entire neuraxis after primary infection and causes herpes zoster characterized by postherpetic neuralgia (PHN).Citation2) The incidence of herpes zoster per 1000 person-years ranges between 1.2 and 4.8, and increases with advancing age and immunocompromising conditions.Citation3,4) Currently, various antiviral treatments for VZV infection are available, mainly including acyclovir, valacyclovir, and famcyclovir. However, PHN (which can be limited by more potent antiviral drugs) and the emergence of drug-resistant virions remain complex clinical issues.Citation5)
Many Chinese herbs have shown promising antiviral activities due to various polysaccharides contained in them.Citation6,7) Their potent antiviral activities and different mechanisms of action from conventional drugs give new hope in anti-viral therapy. Recently, two polysaccharides from D. indica (Andrews) Focke, DIP30 and DIP60, have been characterized for the first time in our laboratory and are even more potent against VZV than acyclovir by in vitro evaluation.Citation8) Both DIP30 and DIP60 are acidic, with a molecular weight of 1.98 × 10³ kDa and 34 kDa, respectively. DIP30 is composed of mannose, rhamnose, galacturonic acid, and galactose, while DIP60 is composed of rhamnose, glucuronic acid, galacturonic, acid and galactose. According to our investigation, there are some other different polysaccharides contained in the herb that are also active against VZV. Thus, it is assumed that a group of polysaccharides in D. indica (Andrews) Focke (DIPs) contribute to the herb’s outstanding antiviral activity. This is in accordance with one of the most prominent features of traditional Chinese medicine that the major pharmacological activity of a Chinese herb is from the synergetic effect produced by one or two or even more groups of similar molecules. For example, flavonoids in Ginkgo biloba leaves present scavenging effects and cardioprotective effects,Citation9) while the total saponins in Panax notoginseng present anti-atherosclerotic effects.Citation10) In order to maximize the polysaccharides extraction from the herb and the antiviral activity of the extract, the extraction process of DIPs needs to be optimized.
Response surface methodology (RSM) has been reported to be an effective tool for optimization of a process where the independent variables have a combined effect on the desired response.Citation11) It is a combination of mathematical and statistical techniques used to analyze problems where the response of interest is affected by several factors with complex interactions.Citation12) This optimization process has been successfully used in the extraction of many natural active ingredients.Citation13–15)
In this study, RSM was employed for the extraction process of crude polysaccharides from D. indica (Andrews) Focke. As many factors can influence the yield of DIPs and the overall antiviral activity, a full set of optimization procedure was applied to determine interactions between parameters and predict extraction conditions. RSM was applied to fit and exploit mathematical models representing the relationship between the response (yield of crude polysaccharides) and input variables (extraction time, extraction temperature, and ratio of water to raw material).
Materials and methods
Materials
Adult D. indica (Andrews) Focke was harvested and the aerial parts were collected and sun-dried. The dried herb was milled in a high-speed disintegrator (Model SF-2000, Chinese Traditional Medicine Machine Works, Shanghai, China) to obtain a fine powder and then kept at room temperature. All other chemicals and solvents used were of analytical grade (Nanjing Wanqing Chemical Reagent Ltd., Jiangsu Province, China).
Extraction of DIPs
Fine powder of D. indica (Andrews) Focke was immersed in distilled water (10–60 mL/g) and extracted at a specified temperature (60–100 ºC) for a given time (2–8 h). The extraction cycle was repeated for 1–3 times. Supernatant was obtained after centrifugation (4000×g, 20 min) and vacuum concentrated to one-fifth of the initial volume using a rotary evaporator (Shanghai Ya Rong Biochemical Instrument Factory, Shanghai, China) at 85 ºC. The concentrated supernatant was deproteined by Sevag method (supernatant: chloroform: n-butanol, 25:5:1, V/V) for 1–3 times. The water phase was collected and dialyzed (Spectra/Por®, USA; MWCO, 0.5–1 kDa) for 12–48 h against deionized water to remove impurities of low molecular weight. The dialyzed solution was appropriately concentrated and absolute ethanol was added to the resulting slurry to a concentration of 70% for sedimentation of polysaccharides (6–24 h). The sediment was air dried to obtain crude DIPs.
Determination of DIPs yield
The total carbohydrate content of the crude extract was quantified by phenol–sulfuric acid colorimetric method.Citation16) Briefly, 1 mL sample was mixed with 1 mL 6% phenol solution and 5 mL concentrated sulfuric acid. The mixture was allowed to react at room temperature for 30 min and A490 was measured. The concentration can be calculated from a standard curve established with glucose.
Reducing sugars were assayed as described by Bezerra and Dias.Citation17) Briefly, to 1 mL of the sample solution 4 mL of dinitrosalicylic acid reagent was added. The mixture in test tube was placed in boiling water bath for 5 min, and then brought to room temperature. The absorbance was measured at 540 nm.
The antiviral activity of the crude extract is from various polysaccharides in the herb, not the reducing sugars which are usually monosaccharides. Therefore, the DIPs yield (%) is calculated as follows:(1)
wherein m0 (g) is the weight of DIPs, m (g) is the weight of dried extract, m1 (g) and m2 (g) represent the total carbohydrate amount and the amount of reducing sugar, respectively.
Assay for antiviral activity
The antiviral activity of the crude DIPs was tested as previously described.Citation8) Briefly, human embryonic lung fibroblast cells were cultured in a 12-well plate (5 × 10⁵) and incubated with VZVp-Oka (VZV parent Oka strain, 50 PFU/well) for 1 h. The inoculum was subsequently removed and cells washed with PBS twice, and overlaid again with mock treatment (medium only), negative control (medium and 0.1% DMSO), and serial dilution of crude DIPs. After further incubation for 72 h, the wells were fixed with methanol and stained with Giemsa stain solution (Sigma-Aldrich). Antiviral activity was evaluated by plaque assay to determine the effective concentration that achieved 50% inhibition (EC50) against VZV infection.
Experimental design and statistical analyses
A full set of optimization procedure was applied to determine interactions between parameters and predict extraction conditions using a minimum number of experiments. It consists of three distinct sets of experimental runs: (1) A Plackett–Burman factorial design was applied using 11 parameters at two levels to determine the significant parameters affecting the desired measurable responses; (2) on the basis of single-factor experiments, a three-level-three-factor Box–Behnken factorial design (BBD) was employed to further optimize the extraction condition; and (3) the suitability of the model equation for predicting the optimum response values was tested using the selected optimal conditions. Analysis of experimental design and calculation of predicted data were carried out using the free trial version of Design Expert®8.0.5 (StatEase, Inc., Minneapolis, MN).
Results and discussion
Screening design
As many factors in the extraction process can influence the yield of crude DIPs as well as the antiviral activity, and different factors contribute differently to different responses, a screening design was employed to figure out significant parameters. When there are more than seven parameters potentially contributing to the model, a Plackett–Burman factorial design is usually used. It helps to economically detect large main effect, assuming all interactions are negligible when compared with the few important main effects. In this screening design, eight parameters of actual extraction settings (namely extraction temperature, extraction time, water extraction cycle, pH, ratio of water to raw material, deprotein times, dialysis time, and sedimentation time) and three dummy factors were considered. A total of 12 experiments were conducted (n + 1) and each parameter was set at a low and a high value that were distributed throughout all the experiments. The responses used to evaluate the input variables were DIPs yield and antiviral activity expressed as EC50. The experimental design as well as the results for various responses are shown in Table .
Table 1. Plackett–Burman factorial design for screening significant parameters.
Analysis of variance (ANOVA) was performed to identify significant parameters. Pareto chart was used to show the effect of studied parameters. As shown in Fig. , when the DIPs yield is concerned, totally three parameters are statistically significant at the level of p = 0.05 and lie above the t-value limit, extraction time, ratio of water to raw material, and extraction temperature. However, when antiviral activity (expressed as EC50) is concerned, no statistically significant parameter has been identified since all studied parameters lie under the t-value limit. Thus, only the response of extraction yield is considered in further optimization by RSM. The ANOVA in Table confirms the significance of each model.
Fig. 1. Pareto chart for yield analysis: The size of the effects of each parameter is proportional to the height of the bar.
Table 2. ANOVA for DIPs yield.
Single-factor experiments
The effect of extraction time on DIPs yield is shown in Fig. (a). Extraction time was set at 2, 3, 4, 5, 6, 7, and 8 h when other extraction parameters were as follow: extraction temperature 80 ºC, ratio of water to raw material 30 mL/g, and all the other non-significant parameters were set at the lowest level. When extraction time varied from 2 to 6 h, the yield of polysaccharides increased accordingly and reached the maximum level of 5.84%. When the extraction time exceeded 6 h, the extraction yield became stable and even had a slight decreasing tendency. This reflected the loss of polysaccharides due to extended treatment under high temperature. Thus, extraction of 5–7 h was favorable for extracting polysaccharides.
Fig. 2. Effect of extraction parameters on yield of DIPs (extraction time, h; extraction temperature, ºC; ratio of water to raw material, mL/g).
The effect of extraction temperature on DIPs yield is shown in Fig. (b). The extraction temperature was set at 75, 80, 85, 90, 95, and 100 ºC when other extraction conditions were as follow: extraction time 6 h, ratio of water to raw material 30 mL/g, and all the other non-significant parameters were set at the lowest level. As shown in Fig. (b), the maximum yield of DIPs was observed when extraction temperature was 95 ºC. Although the extraction yield of polysaccharides at 100 ºC was slightly lower than that at 95 ºC, it was still at a relatively high level. Therefore, extraction temperature range of 90 – 100 ºC was considered in further optimization procedure.
Theoretically, ratio of water to raw material can significantly affect extraction yield. If the ratio is too low, incomplete extraction of polysaccharides from the raw material is resulted. On the other hand, a ratio that is too high will cause high process cost. Thus, this parameter needs to be carefully selected. The effect of ratio of water to raw material is shown in Fig. (c). This parameter was set at 10, 15, 20, 25, 30, 35, and 40 mL/g when other extraction parameters were as follow: extraction time 6 h, extraction temperature 95 ºC, and all the other non-significant parameters were set at the lowest level. As shown in Fig. (c), the maximum yield was achieved when the ratio of water to raw material was at 30 mL/g. After that, the extraction yield began to decrease, despite the increase in the ratio.
Statistical analysis and model fitting
After determining the preliminary range of extraction variables through single-factor test, a BBD with three independent parameters (X1, extraction time; X2, extraction temperature; X3, ratio of water to raw material) at three levels was performed to optimize the significant variables indicated by the Pareto chart. The range of independent variables and their levels are presented in Table . DIPs yield (Y) was taken as the response for the combination of the independent variables given in Table . The number of experiments (n) is dependent of the number of variables, as is given by the expression: n = 2 k (k−1) + C, where k is the number of variables and C is the number of replicates at the center point. There were totally 15 runs of experiments with three replicates (run 13–15) and carried out in random order to minimize the effect of unexplained variability in the observed responses due to systematic errors.
Table 3. Independent variables and their levels used in the response surface design.
Table 4. Box–Behnken design (coded) and results for extraction yield of DIP.
For statistical analysis, each variable was coded at three levels: −1, 0, and 1. All variables were coded according to the following equation:(2)
where xi is the coded value of the variable, Xi is the actual value of the variable, X0 is the actual value of Xi on the center point, and ΔX is the step change.
All trials were performed in triplicates and the data from BBD were analyzed by multiple regressions to fit the following quadratic polynomial model:(3)
In this equation, Y is the dependent variable (DIPs yield), A0 is the constant, and Ai, Aii, and Aij are coefficients estimated by the model and represent the linear, quadratic, and cross-product effects of X1, X2, and X3 factors on the response, respectively. Xi and Xj are levels of the independent variables. The model evaluated the effects of each independent variable on the response.
Table shows the process variables and responses under different extraction conditions. The maximum yield of polysaccharides (6.48%) was recorded at extraction time 6 h, extraction temperature 95 ºC, and ratio of water to raw material 35 mL/mg. By applying multiple regression analysis (Design Expert 8.0.5) on the experimental data, a mathematical model describing the DIPs yield (y) as a function of the coded independent variables in the selected range was given by the following second-order polynomial equation:(4)
The fit statistics of extraction yield (Y) for the selected quadratic predictive model is shown in Table . The p-values were used as a tool to check the significance of each coefficient, which in turn indicated the pattern of the interaction between the variables. As shown in Table , the linear coefficients (X1, X2, and X3), quadratic term coefficients (X12, , and
), and cross-product coefficients (X1X2, X1X3) were significant, with very small P values (p < 0.05). Only X2 X3 was not significant (p > 0.05).
Table 5. Estimated regression model of relationship between response variable (yield of DIP) and independent variables (X1, X2, and X3).
For the model fitted, the coefficient of determination (R2) was 0.9988, which indicated that only 0.12% of the total variations was not explained by the model. The model P-value (Prob > F) was very low (<0.0001), suggesting the model was significant. F-value for the lack of fit was insignificant (p > 0.05), which was an indication of the validity of the model. The value of the adjusted determination coefficient ( = 0.9967) also confirmed that the model was highly significant. Since CV is a measure expressing standard deviation as a percentage of the mean, the small values of CV give better reproducibility. In general, a high CV indicates that variation in the mean value is high and does not satisfactorily develop an adequate response model. In this study, a very low coefficient of the variation (0.77) clearly indicated a very high degree of precision and a good deal of reliability of the experimental values. These statistical data altogether indicated that the model had shown a good fit with the experimental data. Details can be found in Table .
Table 6. Analysis of variance for the fitted quadratic polynomial model of DIPs extraction.
Optimization of extraction conditions of DIP
In order to find the optimal solutions of the regression Equation (Equation4(4) ), numerical optimization was implemented for all responses. The three-dimensional (3-D) response surface plots and the contour plots were drawn, providing a visual interpretation of interactions between two tested variables and the relationships between responses and experiment levels of each variable. Different shapes of the contours plot indicated different interactions between the variables. Elliptical contours were obtained when there was a perfect interaction between the independent variables while circular contour plots indicated otherwise.Citation18)
Figure (a) and (b) shows the 3-D response surface plot and the two-dimensional (2-D) contour plot developed for DIPs yield as a function of extraction time and extraction temperature at fixed ratio of water to raw material (level 0). The DIP yield increased rapidly with the increase in extraction temperature from 90 to 98.3 °C and then began to decrease. The extraction yield increased evidently with the increase in extraction time from 5.0 to 6.6 h. But beyond 6.6 h, the yield slowly decreased with increasing extraction time. At this fixed ratio of water to raw material, the maximum DIPs yield (6.55%) was achieved when extraction temperature was 98.09 °C and extraction time was 6.64 h. The 2-D contour plot showed that the mutual interaction between extraction time and extraction temperature was significant.
Fig. 3. 3-D response surface plot and contour plot for DIPs yield as a function of extraction time and extraction temperature (X1: extraction time; X2: extraction temperature).
In Fig. (a) and (b), when the 3-D response surface plot and the 2-D contour plot were developed for the DIPs yield with varying extraction time and ratio of water to raw material at fixed extraction temperature (0 level), DIPs yield increased rapidly with the increase in ratio of water to raw material but slowly with the increase in extraction time. At this fixed level of extraction temperature, the maximum DIPs yield (6.49%) was achieved when extraction time was 6.24 h and ratio of water to raw material was 34.98 mL/mg. The mutual interaction between extraction time and extraction temperature was significant.
Fig. 4. 3-D response surface plot and contour plot for DIPs yield as a function of extraction time and ratio of water to raw material (X1: extraction time; X3: ratio of water to raw material).
As shown in Fig. (a) and (b), the extraction yield of DIPs was given as a function of extraction temperature and ratio of water to raw material at fixed extraction time (0 level). The DIPs yield increased slowly when ratio of water to raw material increased from 25 to 35 mL/mg. The DIPs yield also increased slowly with the increase in extraction temperature. At this fixed level of extraction time, the maximum DIP yield (6.64%) was achieved when extraction temperature was 97.67 °C and ratio of water to raw material was 34.98 mL/g. The 2-D contour plot showed that the two variables were relatively independent.
Fig. 5. 3-D response surface plot and contour plot for DIPs yield as a function of extraction temperature and ratio of water to raw material (X2: extraction temperature; X3: ratio of water to raw material).
Model adequacy checking
Usually it is necessary to check the fitted model to ensure that it provides an adequate approximation to the real system. Unless the model shows an adequate fit, proceeding with the investigation and optimization of the fitted response surface is likely to give poor or misleading results.Citation19) The residuals from the least squares fit play an important role in judging model adequacy. By constructing a normal probability plot of the residuals, a check was made for the normality assumption. As can be seen from Fig. , the residual plot approximates along a straight line, which is an indication that the normality assumption is satisfied. In addition, Fig. presents a plot of residuals vs. the predicted response. The residuals scatter randomly at around ±1.5, suggesting a fit of the experimental data with the predicted ones (obtained from the model). Both plots (Figs. and ) are satisfactory, so we securely conclude that the empirical model is adequate to describe DIPs yield by response surface.
Fig. 6. Normal probability plot of the residuals.
Fig. 7. Residuals vs. predicted values. The residuals scatter randomly at around ±1.5.
Verification of predictive model
The suitability of the model equation for predicting the optimum response values was tested using the selected optimal conditions. As shown in Table , the maximum predicted yield is 6.51% when extraction time is 6.16 h, extraction temperature is 98.51 °C, and ratio of water to raw material is 30.94 mL/g. Because the optimal values of these parameters were difficult to operate, the actual extractions were carried out with slightly modified conditions: extraction time 6.2 h, extraction temperature 98 °C, and ratio of water to raw material 31 mL/g. A mean value of 6.430 ± 0.078% (n = 5) was obtained from real experiments, which was not significantly different (P > 0.05) from the predicted value. The results of analysis confirmed that the response model was adequate for reflecting the expected optimization, and the model of Equation (Equation4(4) ) was satisfactory and accurate.
Table 7. Predicted and experimental values of the responses at optimum and modified conditions.
Conclusion
In order to increase the yield of DIPs, a full set of optimization procedure was applied to determine interactions between parameters and predict extraction conditions using a minimum number of experiments. Firstly, we identified significant parameters for different responses by a Plackett–Burman factorial design. As for DIPs yield, three parameters were statistically significant, namely extraction time, ratio of water to raw material, and extraction temperature. However, no statistically significant parameter was identified for the response of antiviral activity. This indicated that different extraction conditions did not significantly change the ratios of different polysaccharides present in the extract. A three-level-three-factor BBD was then employed to further optimize the extraction conditions based on the optimal ranges of the three main factors (extraction time, h; extraction temperature, ºC; and ratio of water to raw material, mL/g) acquired by single-factor experiments. The obtained second-order polynomial model gave a satisfactory description of the experimental data. Under optimized conditions, the experimental DIPs yield was 6.430 ± 0.078%, which was very close to the predicted yield of 6.509%.
Acknowledgments
We gratefully acknowledge the financial support by the “111 Project” from the Ministry of Education of China and State Administration of Foreign Experts Affairs of China (No.111-2-07) and a project funded by the Priority Academic Program Development of Jiangsu Higher Education Institutions.
Disclosure statement
No potential conflict of interest was reported by the authors.
Additional information
Funding
References
- Li YJ, Guo ML, Wang DM, Zhang YH, Li YF, Wang JY, Tao SL, Zhang JH, Dong LL, Li L. Wound-healing plants from TCM: in vitro investigations on selected TCM plants and their influence on human dermal fibroblasts and keratinocytes. Int. J. Immunopathol. Pharmacol. 2011;24:633–638.
- Di Legami VD, Gianino MM, Atti MCD, Massari M, Migliardi A, Tomba GS, Zotti C. Epidemiology and costs of herpes zoster: background data to estimate the impact of vaccination. Vaccine. 2007;25:7598–7604.10.1016/j.vaccine.2007.07.049
- Thomas SL, Hall AJ. What does epidemiology tell us about risk factors for herpes zoster? Lancet Infect. Dis. 2004;4:26–33.10.1016/S1473-3099(03)00857-0
- Volpi A, Gross G, Hercogova J, Johnson RW. Current management of herpes zoster. Am. J. Clin. Dermatol. 2005;6:317–325.10.2165/00128071-200506050-00005
- Gilbert C, Bestman-Smith J, Boivin G. Resistance of herpes viruses to antiviral drugs: clinical impacts and molecular mechanisms. Drug Resist. Updat. 2002;5:88–114.10.1016/S1368-7646(02)00021-3
- Song X, Yin ZQ, Li L, Cheng AC, Jia RY, Xu J, Wang Y, Yao XP, Lv C, Zhao XH. Antiviral activity of sulfated Chuanminshen violaceum polysaccharide against duck enteritis virus in vitro. Antivir. Res. 2013;98:344–351.10.1016/j.antiviral.2013.03.012
- Chen Y, Xiong W, Zeng L, Wang DY, Liu JG, Wu Y, Hu YL. Comparison of Bush Sophora Root polysaccharide and its sulfate’s anti-duck hepatitis A virus activity and mechanism. Carbohydr. Polym. 2014;102:333–340.10.1016/j.carbpol.2013.11.065
- Jiang HF, Wang J, Zhou A, Xie GR, Yan LY, Jiang YT, Chen J, Shen Y, Chen JH. Purification, characterization and antiviral activity of two heteropolysaccharides from Duchesneae Indicae. Int. J. Biol. Macromol. 2013;58:287–295.10.1016/j.ijbiomac.2013.04.061
- Madadevan S, Parl L. Multifaceted therapeutic benefits of Ginkgo biloba L.: chemistry, efficacy, safety and uses. J. Food. Sci. 2008;73:R14–R19.
- Zeng Yu, Song J, Shen XC. Herbal remedies supply a novel prospect for the treatment of atherosclerosis: a review of current mechanism studies. Phytother. Res. 2012;26:159–167.10.1002/ptr.v26.2
- Samavati V. Polysaccharide extraction from Abelmoschus esculentus: optimization by response surface methodology. Carbohydr. Polym. 2013;95:588–597.10.1016/j.carbpol.2013.02.041
- Sousa AMM, Alves VD, Morais S, Delerue-Matos C, Gonçalves MP. Agar extraction from integrated multitrophic aquacultured Gracilaria vermiculophylla: evaluation of a microwave-assisted process using response surface methodology. Bioresour. Technol. 2010;101:3258–3267.10.1016/j.biortech.2009.12.061
- Zheng X, Wang X, Lan Y, Shi J, Xue SJ, Liu C. Application of response surface methodology to optimize microwave-assisted extraction of silymarin from milk thistle seeds. Sep. Purif. Technol. 2009;70:34–40.10.1016/j.seppur.2009.08.008
- Xynos N, Papaefstathiou G, Gikas E, Argyropoulou A, Aligiannis N, Skaltsounis AL. Design optimization study of the extraction of olive leaves performed with pressurized liquid extraction using response surface methodology. Sep. Purif. Technol. 2014;122:323–330.10.1016/j.seppur.2013.10.040
- Wang LZ, Yang B, Du XQ, Yi C. Optimisation of supercritical fluid extraction of flavonoids from Pueraria lobata. Food Chem. 2008;108:737–741.10.1016/j.foodchem.2007.11.031
- Masuko T, Minami A, Iwasaki N, Majima T, Nishimura SI, Lee YC. Carbohydrate analysis by a phenol–sulfuric acid method in microplate format. Anal. Biochem. 2005;339:69–72.10.1016/j.ab.2004.12.001
- Bezerra RMF, Dias AA. Discrimination among eight modified Michaelis–Menten kinetics models of cellulose hydrolysis with a large range of substrate/enzyme ratios: inhibition by cellobiose. Appl. Biochem. Biotechnol. 2004;112:173–184.
- Zhang J, Jia S, Liu Y, Wu S, Ran J. Optimization of enzyme-assisted extraction of the Lycium barbarum polysaccharides using response surface methodology. Carbohydr. Polym. 2011;86:1089–1092.10.1016/j.carbpol.2011.06.027
- Li W, Cui SW, Kakuda Y. Extraction, fractionation, structural and physical characterization of wheat β-d-glucans. Carbohydr. Polym. 2007;63:408–416.