
Abstract
Digestion-resistant starch (RS) has many physiologic functions. The RS content is measured by enzymatically degrading flour samples according to the method of the Association of Official Analytical Chemists. Experiments have been performed with wheat, corn, and other grains, but there are no data for cooked rice grains in the form ingested by humans. Thus, we investigated a method to measure RS that is suitable for cooked rice grains using rice cultivars that are reported to differentially increase postprandial blood glucose in humans. Using a method for cooking individual rice grains and optimized enzyme reaction conditions, we established an RS measurement method. We also found that the amylopectin crystal condition affects the RS content measured using our method.
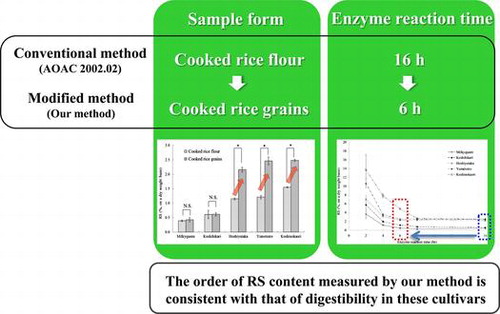
Graphical abstract
The order of RS content measured by our method that optimized the sample form and enzyme reaction time is consistent with that of digestibility in humans.
Resistant starch (RS) is a digestion-resistant starch fraction that is less likely to be digested by amylase.Citation1) RS is classified into four categories (RS1–RS4): RS with a starch structure covered with a hull, such as in whole-grain flour and unpolished rice, is classified as RS1; starch with a high amylose content and high crystallinity, RS2; retrograded starch produced by cooling gelatinized starch, RS3; and chemically modified starch, RS4.Citation2–4)
RS suppresses postprandial blood glucose and insulin elevation,Citation5–8) improves blood glucose and insulin responses,Citation9–11) and promotes postprandial lipid oxidationCitation12) due to its resistance to digestion. RS is also expected to promote body fat consumption, and its use over the long term might help prevent and improve type 2 diabetes and abnormal glucose tolerance, as well as contribute to the management of obesity and body weight increase.Citation13,14)
The Association of Official Analytical Chemists (AOAC) method (2002.02)Citation15,16) is specified as the official analytical method of measuring the RS content, and the RS content in vitro fully agrees with that in vivo. In addition, an association between the RS content and suppression of blood glucose or insulin elevation has been reported,Citation5–8,17,18) suggesting that the starch digestibility and the elevation of blood glucose and insulin in vivo are suppressed as the RS content in vitro increases. In these reports, however, the subjects of the experiments were wheat, corn, potatoes, legumes, bread, and pasta. Data for cooked rice grains, which is the form ingested by humans, have not been reported.
On the other hand, Homma et al.Citation19) measured the RS content of rice cultivars having a different amylose content following the AOAC method. They considered that the RS values of rice measured using the AOAC method indicated the RS content, in a narrow sense differing from the digestive reaction in humans, because little RS was detected and varietal differences in the RS content were not observed.
Therefore, a measuring method for determining the RS content in cooked rice is not yet fully established. In the present study, we investigated an RS content measurement method for cooked rice grains, which is the form ingested by humans, using five rice cultivars with a different amylose content and that differ in their postprandial blood glucose effects in humans.Citation20–22)
Materials and methods
Samples of white rice and composition analysis
Five cultivars of rice with different amylose contents were used: Milkyqueen as low-amylose rice; Koshihikari as medium-amylose rice; and Hoshiyutaka, Yumetoiro, and Koshinokaori as high-amylose rice (Table ). The cultivars were purchased as brown rice and polished to a yield of 90–91% using a compact rice polisher, PEARLEST (Kett Electric Laboratory, Tokyo, Japan).
Table 1. Properties of rice grain sample.
The amylose content of the polished rice was measured by iodine colorimetry following Juliano’s method.Citation23) A calibration curve was prepared using a mixture of potato amylose Type III (Sigma-Aldrich Co., St. Louis, MO, USA) and defatted, deproteinized waxy rice flour. The water content was measured by the drying method with heating at 135 °C for 3 h.
Preparation of cooked rice grains
The rice cooking method using a cup to measure the physical propetiesCitation24) leads to differences in the detected physical properties dependent on the position of the rice in the cup. Nakamura et al.Citation25) reported a method of cooking individual rice grains to detect these differences in the physical properties. We adopted their method of cooking individual rice grains.
Each one grain of rice was added to PCR tube of 200 µL capacity (AS ONE, Osaka, Japan) with 55 µL of deionized water, and was cooked after being incubated at the room temperature for 1 h using the GemeAmp PCR System 9700 (Life Technologies, Carlsbad, USA). The temperature history of cooking rice was carried out at 38 °C for 10 min, followed by 48 °C for 10 min, 60 °C for 5 min, 98 °C for 12 min, 93 °C for 10 min, 60 °C for 10 min, 30 °C for 30 min, and 25 °C for 30 min. After cooking, the cooked rice samples were stored in a refrigerator at 4 °C to investigate the effect of retrogradation. The cooking condition was the same in all the cultivars.
Preparation of rice flour sample
Cooked samples were freeze-dried using a Freeze Dryer FDU-2100 (Tokyo Rika Kikai, Tokyo, Japan), followed by milling using a hammer mill, MF10 basic (IKA Japan Co., Nara, Japan), or cyclone sample mill (UDY Corporation, Fort Collins, CO, USA) with a 0.5-mm sieve.
Measurement of RS content
The RS Assay Kit (Megazyme, Wicklow, Ireland) following the AOAC method was used to degrade starch, and glucose was measured using a Glucose C II test WAKO (Wako, Osaka, Japan). Absorbance at 505 nm was measured using the U-3310 spectrophotometer (HITACHI, Tokyo, Japan). For preparation of a calibration curve, the glucose solution supplied by the RS Assay Kit was used.
Six rice grains that become almost the same weight as the AOAC method in dry weight were used for the measurement of RS. The enzyme reaction time with pancreatin and amyloglucosidase is specified as 16 h in the AOAC method, but, in our experiment, the RS content was measured at 2, 4, 6, and 8 h to reflect the digestion process in humans. The RS content was measured following the AOAC method except the sample form and enzyme reaction time and was converted to the amount per 100 mg of dry cooked rice.
Analysis of starch gelatinization and retrogradation
Gelatinization and retrogradation properties of each rice sample were analyzed using a differential scanning calorimeter, DSC820 (METTLER TOLEDO Japan, Tokyo, Japan). To investigate the thermal properties before and after gelatinization and retrogradation, raw rice, cooked rice, and cooked rice stored overnight at 4 °C were prepared. In a medium-pressure aluminum pan (METTLER TOLEDO Japan, Tokyo, Japan), 15 mg of the flour sample was added, combined with 35 µL of deionized water, and the sample concentration was adjusted to 30%. As a reference, 50 µL deionized water was added and adjusted to an equal weight. Regarding the measurement condition, the temperature was increased from 30 to 130 °C at 1.5 °C/min. The analytical properties measured were gelatinization start, peak, and end temperatures (Ts, Tp, and Tc, respectively), and endothermic enthalpy (∆H).
Statistical analysis
Statistical analysis of the results was performed using statistical analysis software, SPSS (ver.15, IBM Japan, Tokyo, Japan). Significant differences were analyzed by multiple comparison using a one-way analysis of variance followed by Scheffe’s test. To analyze the changes in the RS content with the enzyme reaction time, curve-fitting based on a nonlinear regression analysis was performed using statistical analysis software, JMP (ver.8, SAS Institute Japan, Tokyo, Japan).
Results and discussion
Form of measurement sample
To examine the difference in the digestibility of the sample form, the RS contents of the cooked rice grain samples were compared with those of cooked rice flour following the AOAC method. Fig. shows the RS content of the two forms. In the three high-amylose rice cultivars, the RS content was significantly higher in the cooked rice grain than in the flour sample, showing a higher resistance to digestion of grains than of powder, as previously reported.Citation19) The difference in the digestibility between rice grains and rice flour was confirmed, suggesting the need to measure RS content in cooked rice grains, which is the form ingested by humans.
Fig. 1. RS content of the cooked rice flour or cooked rice grains.
Among the cooked rice grain samples, no significant difference in the RS content was detected between the low- and medium-amylose rice cultivars, Milkyqueen and Koshihikari, as previously reported.Citation19) Moreover, though a difference in the Glycemic Index (GI), which indicates digestibility in humans, was reported between Yumetoiro and Koshinokaori as high-amylose rice cultivars,Citation22) no significant difference in the RS content was detected. These findings suggested that the RS content in the AOAC method in which only the sample form is changed could not reflect the digestive reaction in humans.
Enzyme reaction time
The measuring method was reconsidered, focusing on the enzyme reaction time. The enzyme reaction time with pancreatin and amyloglucosidase is set at 16 h in the AOAC method, but in humans, the small intestinal transit time of food is approximately 5 h,Citation26) suggesting that resistance to digestion in humans is not reflected by the AOAC method due to the excessive enzyme reaction. Thus, we investigated the enzyme reaction time for RS content measurement of cooked rice grains.
The enzyme reaction time was shortened from 16 h in the AOAC method to 2, 4, 6, and 8 h, and the RS contents of cooked rice grain samples were measured (Fig. ). A period of 4–6 h was thought to be appropriate because that time is similar to the small intestinal transit time, and the difference in the RS content between the rice cultivars was clearly confirmed. Considering the point of analytical accuracy, 6-h enzyme reaction time was adopted since the coefficient of variation was smaller than at 4 h. In this condition, the RS content of each cultivar increased with a significant difference in the order of Milkyqueen, Koshihikari, Hoshiyutaka and Yumetoiro, and Koshinokaori (Fig. ). On the other hand, based on postprandial blood glucose levels and GI in a previous report,Citation20−Citation22) the digestibility in humans decreases in order of Milkyqueen, Koshihikari, Hoshiyutaka and Yumetoiro, and Koshinokaori. This order of digestibility is consistent with that of the RS content measured using our method. These findings suggest that our method of measuring the RS content of cooked rice well reflects digestibility in humans.
Fig. 2. Changes in the RS content over the enzyme reaction time from 2 to 16 h.
Fig. 3. RS content in the cooked or retrograded rice at the 6-h enzyme reaction point.
Kinetic analysis by nonlinear regression analysis
To investigate the adequacy of our method for measuring RS, the enzyme kinetics of the results shown in Fig. were subjected to nonlinear regression analysis using the statistical analysis software JMP. The data obtained after a 2-h enzyme reaction were excluded because of the large coefficient of variation. For the nonlinear regression equation, the equation, based on a previous report,Citation27–30) was as follows:
where, t represents the enzyme reaction time; Yt represents the RS content (%) after reaction for t hours; and a, b, and c represent enzyme kinetics parameters. The parameter a represents the theoretical RS content in initial reaction; parameter b represents the rate of enzyme degradation; and parameter c represents enzyme reaction rate, and enzyme reaction is slow when the value of c is small. The values of a, b, and c estimated by the analysis and the RS content at 6 h are shown in Table . These results indicated that parameter c was low and the enzyme reaction was slow as the RS content at the 6-h enzyme reaction point increased.
Table 2. Model parameters.
Thus, it suggested that the RS content measured using the cooked rice and setting the enzyme reaction time at 6 h correlates with the enzyme kinetics and resistance to digestion. This method is thus considered to be appropriate as a measurement condition of RS.
Gelatinization property analysis of the rice cultivars
Fig. shows the RS content of cooked rice and the cooked rice stored at 4 °C measured by our method. The RS content of Koshinokaori was significantly high compared with other high-amylose rice. In general, the RS content is considered to correlate with the amylose content. The RS content of Koshinokaori, however, does not correlate with the amylose content and is higher than that of Hoshiyutaka and Yumetoiro, which contain the same amount of amylose (Fig. ). Moreover, the RS content of Koshinokaori was increasing greatly by retrogradation. The gelatinization property was analyzed by DSC because this phenomenon could be due to differences in the starch structure.
Fig. 4. Correlation between RS content and amylose content.
The results of the calorimetry measurements of raw rice, cooked rice, and cooked rice after cooling are shown in Fig. (A)–(C), respectively. The gelatinization property values of raw rice and cooked rice after cooling are shown in Tables and , respectively. The endothermic peak observed below 80 °C in the starch measurement derives from the gelatinization of amylopectinCitation31). The gelatinization peak temperature (Tp) in Koshinokaori, which had the highest RS content, was significantly higher than that of other high-amylose rice cultivars, Hoshiyutaka and Yumetoiro. Moreover, in the measurement of Koshinokaori after cooling, we observed an endothermic peak near 45 °C, which was not observed in rice immediately after cooking. As this endothermic peak derives from recrystallized amylopectin due to retrogradation,Citation32) the difference in the crystal condition of amylopectin might have influenced the RS content of Koshinokaori.
Fig. 5. DSC thermogram of the samples.
Table 3. DSC thermal parameters of the raw rice flour.
Table 4. DSC thermal parameters of the cooled after cooking rice.
These results suggested that a high RS content is due to differences in the crystal conditions of amylopectin. In addition, we confirmed that the increase in the RS content with retrogradation was accelerated in rice with a high RS content, suggesting that the increase derives from the recrystallization of amylopectin.
Conclusions
The AOAC method of measuring RS cannot fully reflect the RS content of rice. In the present study, we investigated a modified AOAC method using rice cultivars for which differences in postprandial blood glucose elevation have been reported.
Adopting a method for cooked individual rice grains, we treated cooked rice grains, which is the form ingested by humans, and optimized the enzyme reaction time to modify the AOAC method. The measurement accuracy was high, and the difference in the RS content values between each cultivar was significant when the enzyme reaction time was modified to 6 h and cooked rice grains were used as the sample compared with the original AOAC method.
The order of the RS content was consistent with the in vivo postprandial blood glucose increase-inhibitory effect reported previouslyCitation20−Citation22); thus, we successfully developed an RS content measurement method that well reflects digestibility in humans. In a nonlinear regression analysis, the order of the RS content measured using our method was also consistent with the order of the enzyme reaction rate, suggesting that our method is also valid from a kinetic viewpoint.
Based on these findings, we propose a novel method for measuring the RS content that well reflects the previously reported digestibility in humans. The amylose content has been considered to greatly influence the RS content of cooked rice. Based on the results of the gelatinization properties, however, our findings suggest that the structure of amylopectin also affects the RS content. This novel method of measuring RS and the knowledge gained about amylopectin will be useful for evaluating the physiologic functions of rice cultivars. Our next step will be to clarify the relationship between RS content measured using our method and actual digestibility by performing an in vivo digestibility test.
Author contribution
YN, Yoji K, and KO conceived and designed the study. YN and SN carried it out. YN, SN, and Yoji K analyzed the data. YN drafted the manuscript. Yoji K, DS, Yoshihisa K, and KO reviewed the manuscript. All authors read and approved the final manuscript.
Disclosure statement
No potential conflict of interest was reported by the authors.
Notes
Abbreviations: RS, resistant starch; DSC, differential scanning calorimetry
References
- Englyst HN, Wiggins HS, Cummings JH. Determination of the non-starch polysaccharides in plant foods by gas-liquid chromatography of constituent sugars as alditol acetates. Analyst. 1982;107:307–312.10.1039/an9820700307
- Englyst HN, Kingman SM, Cummings JH. Classification and measurement of nutritionally important starch fractions. Eur. J. Clin. Nutr. 1992;46:33–50.
- Brown IL, McNaught KJ, Moloney E. Hi-maizeTM: new directions in starch technology and nutrition. Food Australia. 1995;47:272–275.
- Matsuki J. Resistant starch. Nippon Shokuhin Kagaku Kougaku Kaishi. 2010;57:224. Japanese.
- Nugent AP. Health properties of resistant starch. Nutr. Bull. 2005;30:27–54.10.1111/nbu.2005.30.issue-1
- Sharma A, Yadav BS, Ritika BY. Resistant starch: physiological roles and food applications. Food Rev. Int. 2008;24:193–234.10.1080/87559120801926237
- Skrabanja V, Liljeberg Elmståhl HG, Kreft I, Björck IM. Nutritional properties of starch in buckwheat products: studies in vitro and in vivo. J. Agric. Food Chem. 2001;49:490–496.10.1021/jf000779w
- Granfeldt Y, Drews A, Bjorck I. Arepas made from high amylose corn flour produce favorably low glucose and insulin responses in healthy humans. J. Nutr. 1995;125:459–465.
- EFSA Panel on Dietic Products, Nutrition and Allergies. Scientific opinion on the substantiation of health claims related to resistant starch and reduction of post-prandial glycaemic responses (ID 681), ‘digestive health benefits’ (ID 682) and’ favours a normal colon metabolism’ (ID 783) pursuant to article 13(1) of regulation (EC) No 1924/20061. EFSA J. 2011;9:2024–2040.
- Jovin H, Sun-Ok L, Suzanne H, Stephen S, Yongfeng A, Jay-lin J. Characterization of a novel resistant-starch and its effects on postprandial plasma-glucose and insulin responses. Cereal Chem. 2010;87:257–262.
- Hayakawa T, Tsuge H. Starch intake and health -physiological effects of resistant starch. Nippon Syokumotsuseni Kenkyuukaishi. 1999;3:55–63. Japanese.
- Higgins JA, Higbee DR, Donahoo WT, Brown IL, Bell ML, Bessesen DH. Resistant starch consumption promotes lipid oxidation. Nutr. Metab. 2004;1:8–18.10.1186/1743-7075-1-8
- Higgins JA. Resistant starch: metabolic effects and potential health benefits. J. AOAC Int. 2004;87:761–768.
- Kim WK, Chung MK, Kang NE, Kim MH, Park OJ. Effect of resistant starch from corn or rice on glucose control, colonic events, and blood lipid concentrations in streptozotocin-induced diabetic rats. J. Nutr. Biochem. 2003;14:166–172.10.1016/S0955-2863(02)00281-4
- McCleary BV, Monaghan DA. Measurement of resistant starch. J. AOAC Int. 2002;85:665–675.
- McCleary BV, McNally M, Rossiter P. Measurement of resistant starch by enzymatic digestion in starch and selected plant materials: collaborative study. J. AOAC Int. 2002;85:1103–1111.
- Hallstrom E, Sestili F, Lafiandra D, Bjorck I, Ostman E. A novel wheat variety with elevated content of amylose increases resistant starch formation and may beneficially influence glycaemia in healthy subjects. Food Nutr. Res. 2011;55:7074–7081.
- Behall KM, Hallfrisch J. Plasma glucose and insulin reduction after consumption of breads varying in amylose content. Eur. J. Clin. Nutr. 2002;56:913–920.10.1038/sj.ejcn.1601411
- Homma N, Akaishi R, Yoshii Y, Nakamura K, Ohtsubo K. Measurement of resistant starch content in polished rice and processed rice products. Nippon Shokuhin Kagaku Kogaku Kaishi. 2008;55:18–24. Japanese.10.3136/nskkk.55.18
- Ohtsubo K, Nakamura S, Utsunomiya K, Masuda Y, Tsuji K. Hard rice and its preventive effect on diabetes: an approach in practical use. Shokuhin Kogyo. 2010;53:46–51. Japanese.
- Ohtsubo K, Sakai K, Masuda Y, Kunou M, Hasegawa M. Rice for controlling rise of blood glucose level and processed food using the same. Japan patent. JP 2005-328,776A. 2005 Dec 2.
- Murata Y, Ogawa T, Yoshikawa S. Blend rice and retort food using the same and aseptic packed food. Japan patent. JP 2011-135,849A. 2011 Jul 14.
- Juliano BO. A simplified assay for milled-rice amylose. Cereal Sci. Today. 1971;12:3334–3360.
- Okabe M. Studies on eating quality of cooked rice. New Food Ind. 1977;19:65–71.
- Nakamura S, Suzuki K, Haraguchi K, Ohtsubo K. Development of method for cooked individual rice grain and physical measurements by tensipresser. Ikusyugaku Kenkyu. 2007;9:63–66. Japanese.
- Li M, Piao J, Tian Y, Li W, Li K, Yang X. Postprandial glycaemic and insulinaemic responses to GM-resistant starch-enriched rice and the production of fermentation-related H2 in healthy Chinese adults. Br. J. Nutr. 2009;103:1029–1034.
- Ørskov ER, McDonald I. The estimation of protein degradability in the rumen from incubation measurements weighted according to rate of passage. J. Agric. Sci. Camb. 1970;92:499–503.
- Peisong H, Haijun Z, Zhiying D, Zhang L, Dianxing W. Starch digestibility and the estimated glycemic score of different types of rice differing in amylose contents. J. Cereal Sci. 2004;40:231–237.
- Osawa M, Inoue N. Studies on the in vitro starch digestibility and the Glycemic Index in rice cultivars differing in amylose content. Jpn. J. Crop Sci. 2007;76:410–415. Japanese.10.1626/jcs.76.410
- Osawa M, Inoue N. Evaluation of starch digestibility and physicochemical properties related to texture in rice cultivars by application of principal compornent analysis. Jpn. J. Crop Sci. 2008;77:61–68. Japanese.10.1626/jcs.77.61
- Ishii Y, Kawabata A, Nakamura M. Retrogradation specificities of amylopectins isolated from tropical starches using differential scanning calorimetry (DSC). Oyo Toshitsu Kagaku. 1994;41:297–303. Japanese.
- Okuda M, Aramaki I, Koseki T, Inouchi N, Hashizume K. Structural and retrogradation properties of rice endosperm starch affect enzyme digestibility of steamed milled-rice grains used in sake production. Cereal Chem. 2006;83:143–151.10.1094/CC-83-0143