
Abstract
We studied the effects of fermented barley extract P (FBEP) in stroke-prone spontaneously hypertensive rats (SHRSP). Male 10-week-old SHRSP were divided into three groups that were fed: an AIN-93M diet (control), a low dose of FBEP (4 g/kg; FBEP1), and a high dose of FBEP (20 g/kg; FBEP2) for three weeks. Hypertension was significantly improved by the use of FBEP supplementation. The FBEP diet improved plasma triglyceride, insulin sensitivity, enhanced plasma catalase, and superoxide dismutase activities, and decreased plasma 8-hydroxy-2′-deoxyguanosine levels. In addition, the FBEP diet upregulated hepatic antioxidative genes and modulated Nrf2 protein levels in the liver. Furthermore, a single oral dose of FBEP (2 g/kg body weight) was able to lower blood pressure in SHRSP. In conclusion, our data suggest that increased expression of hepatic antioxidative genes and modulation of Nrf2 may play a role in the regulation of metabolic diseases in SHRSP consuming a FBEP diet.
Graphical Abstract
Chronic administration of fermented barley extract significantly reduces systolic blood pressure in SHRSP.
High blood pressure (BP) or hypertension is a significant health problem that causes morbidity and mortality worldwide.Citation1) Hypertension is a multifactor disease that is known to be related to abnormalities in glucose levels, lipid profile, and insulin resistance (IR). One of the risk factors for developing metabolic-related diseases is BP level. In fact, a 5-mm Hg decrease in BP has been equated to a 16% decrease in metabolic-related diseases.Citation2)
Sustained hypertension is one of the most powerful determinants of the development of hypertension-related disorders. Therefore, any food components having the ability to reduce hypertension are potential candidates for the prevention or treatment of hypertension-related disorder such as type II diabetes, hypercholesterolemia, atherosclerosis, and heart failure due to a high production of reactive oxygen species (ROS).Citation3) The defense system in humans and rodents is protected against ROS through antioxidant enzymes such as superoxide dismutase (SOD), glutathione peroxidase (GPx), and catalase (CAT).Citation4) Nuclear factor-E2-related factor-2 (Nrf2) is a transcription factor that regulates the expression of numerous ROS detoxifying and antioxidant genes, and other studies have produced strong evidence that the key point for the transcription factor and antioxidant enzymes is Nrf2.Citation5,6) It has been previously demonstrated that the administration of some phenolic acids such as gentisic, ferulic, gallic, and p-coumaric acids to rats over a period of 14 days largely increased the transcription and activity of the enzymes SOD, CAT, and GPx. A proposed mechanism suggests that phenolic acids act as indirect inducers, activating the protein Nrf2 and increasing the mRNA expression of the enzymes.Citation7–9)
Our previous study investigated the effect of fermented barley extract (FBE) in chronic ethanol fed female Wistar rats. We revealed that FBE significantly improved the expression of hepatic antioxidant genes that corresponded to the increase in enzymatic activities against oxidative stress and decrease in plasma alanine aminotransferase and aspartate aminotransferase activities.Citation10) Furthermore, we showed that FBE suppressed acute increases in oxidative stress in response to lipopolysaccharide-induced inflammation, such as interleukin (IL)-1β, IL-6, and tumor necrosis factor-α, by 25, 34, and 35%, respectively.Citation11) We also demonstrated the beneficial effects and safety of fermented barley extract subfraction P (FBEP) in treating human subjects with slightly high serum uric acid or mild hyperuricemia by a randomized, placebo-controlled, parallel-group, and double-blinded study.Citation12) Thus, the goal of the current study was to determine the effects of FBEP on metabolic-related parameters in an animal model of hypertension-related disorders similar to human essential hypertension, dyslipidemia, and IR. SHRSP is an animal model of hypertension-related disorders similar to human essential hypertension due to a high production of ROS.
Materials and methods
Fermented barley extract P-fraction
Fermented barley extract P-fraction (FBEP) was prepared from barley spirit distilled by-products as described in our previous studies.Citation12) The nutritional composition of FBEP was as follows: protein, 39.2%; dietary fiber, 8.8%; fat, 0.3%; ash, 3.7%; water, 6.2%; and carbohydrate, 41.8%.
Animal experiments
Male SHRSP/Izumo strain rats (Japan SLC, Shizuoka, Japan) were used in this study. The rats were housed in individual stainless steel cages in a controlled atmosphere (temperature, 23 ± 2 °C; humidity, 50 ± 10%; 12 h light-dark cycle). Animals were categorized by body weight, and animals with the same body weight before administration of FBEP were used for each study. The experimental design for the present study was approved by the Animal Research-Animal Care Committee of Tohoku University (2011 dounou-38). This work was conducted in accordance with the guidelines issued by this committee and the Japanese government’s legislation (2005). The same committee supervised the care and use of the rats used in the present study.
BP measurements
The systolic BP, diastolic BP, and heart rates were measured using the tail-cuff method with a BP meter without warming (MK-2000, Muromachi Kikai, Tokyo, Japan), as described previously.Citation13) At least six measurements were performed on each rat. The average value of four consistent readings of each parameter was regarded as the individual systolic BP, diastolic BP, and heart rates.
A single oral dose of FBEP
After a 1-week acclimatization period, the 15-week-old SHRSP were divided into two groups: the control group and the FBEP group. After the rats fasted for 16 h, FBEP dissolved in distilled water (FBEP group, 2 g/kg body weight) and distilled water (control group, 1 mL) were orally administered to the SHRSP via a gastric tube. The systolic BP was measured before the dose and 1, 2, 4, and 6 h after the administration.
Chronic administration of FBEP
After a one-week acclimatization period, 10-week-old SHRSP were divided into three groups: the control group was fed an AIN 93M diet, and the two others were fed FBEP at a low dose of 4 g/kg (FBEP1) and a high dose of 20 g/kg (FBEP2) for three weeks. The rats had free access to fresh food and drinking water during the experimental period. The composition of the diet (g/kg) was as follows: tert-butylhydroquinone (0.008), l-cystine (1.8), choline bitartrate (2.5), vitamin mixture (10), mineral mixture (35), soybean oil (40), cellulose (50), sucrose (100), casein (140), and corn starch (620.692). The food intake was recorded every day. The systolic and diastolic BP and body weight were measured every week during the experimental period. At the end of the experimental period, the rats were sacrificed under diethyl ether anesthesia after 16 h of fasting. Blood from the abdominal aorta was collected; the plasma was immediately separated by centrifugation, and stored at −20 °C. Organs were excised, weighed, and kept frozen at –80 °C. For mRNA analysis, the liver and kidney of each rat was cut into 0.5-cm sections, immediately transferred into a tube containing RNA-later solution, and incubated at 4 °C overnight prior to storing the samples at −20 °C, per the manufacturer’s instructions (Applied Biosystems Co., Tokyo, Japan).
Analytical procedures
Plasma levels of total cholesterol (TC), triglyceride (TG), HDL-cholesterol, glucose, blood urea nitrogen (BUN), and albumin were measured by enzymatic colorimetric methods (Wako Pure Chemical Co., Osaka, Japan), according to the manufacturers protocol. LDL-cholesterol was calculated according to the Friedewald formula: (TC − HDL-cholesterol) − (1/5 × TG).Citation14) Plasma insulin levels were measured with a rat insulin ELISA kit (Shibayagi Co., Gunma, Japan). Total liver lipids were determined by the Folch method.Citation15) Liver TC and TG concentrations were determined with the same kit that was used for determining plasma TC and TG concentrations, following the extraction of liver samples with methanol–chloroform (1:2, v/v). Plasma total SOD, catalase (Cat), and 8-hydroxy-2′-deoxyguanosine (8-OHdG) levels were measured using commercial kits from Cayman Chemical (Ann Arbor, MI).
Oral glucose tolerance test
Oral glucose tolerance tests (OGTTs) were conducted on 12-week-old SHRSP that had fasted for 16 h. Blood for glucose measurements was collected from the tail vein before and 30, 60, and 120 min after the rats were fed glucose (1.8 g/kg body weight) via a gastric tube. Plasma glucose and insulin levels were measured as described above. The analysis of the incremental area under the curve (iAUC) of the plasma glucose and insulin response was calculated based on the Wolever and Jenkins method.Citation16) We calculated IR index with the homeostatic model assessment-insulin resistance (HOMA-IR) index, which is defined as HOMA-IR = (fasting insulin level (μU mL−1) × fasting glucose level (mmol L−1))/22.5.Citation17)
RNA preparation and quantitative RT-PCR
Total RNA was isolated from the liver using a guanidine isothiocyanate-based reagent, Isogen (Nippon Gene, Toyama, Japan), according to the manufacturer’s instructions. The wavelength ratio at 260 and 280 nm was measured, and agarose gel electrophoresis was performed to facilitate the quantitative and qualitative analysis of the isolated RNA. Total RNA (2.5 μg) was used as a template to synthesize the complementary DNA (cDNA). The RNA was denatured with oligo-dT/random primers in 10 mmol/L deoxyribonucleotide (GE Healthcare, Tokyo, Japan) at 65 °C for 5 min. RNA was then incubated in 20 μL of master mix solution, containing 50 mmol/L Tris-HCl buffer (pH 8.3), 0.1 mol/L DTT containing 50 units of SuperScript III Reverse Transcriptase (Invitrogen, Carlsberg, CA), and 20 units of RNaseOUT RNase inhibitor (Invitrogen, Carlsberg, CA), at 25 °C for 5 min, 50 °C for 60 min, and 70 °C for 15 min. Aliquots of cDNA were used as a template for the subsequent quantitative RT-PCR procedure with an Applied Biosystems 7300 Real Time PCR System (Foster City, CA) and a SYBR Premix Ex Taq (Takara Bio Inc., Shiga, Japan), according to the manufacturer’s instructions. The relative gene expression levels were normalized by the amount of eukaryotic elongation factor-1α1 mRNA.Citation18) Table lists the primer sequences of the genes used for quantitative RT-PCR.
Table 1. Oligonucleotide sequences used for mRNA expression analysis.
Western blot analysis
The nuclear fraction of rat livers was obtained according to the modified Dignam method.Citation19,20) The isolated nuclei were lysed in SDS gel loading buffer, and their protein concentration was measured with a protein assay reagent (Bio-Rad, Hercules, CA). Twenty micrograms of protein was resolved on a 10–20% SDS-polyacrylamide gel by electrophoresis (Wako Pure Chemical Industries, Osaka, Japan), and then the protein was transferred onto a polyvinylidene fluoride membrane (Millipore, Billerica, MA). The membrane was subjected to blocking for 1 h with Tris-buffered saline with Tween 20 (10 mmol/L Tris-HCl at pH 7.4, 150 mmol/L NaCl, and 0.1% Tween 20) containing 5% fat-free dried milk, and then incubated with an anti-Nrf2 antibody (H-300, Santa Cruz Biotechnology, Inc., Dallas, TX). The protein bands were visualized using Immobilon Western Detection Reagent (Millipore) and a luminescent image analyzer LAS-4000 mini (Fujifilm, Tokyo, Japan). The relative expression level of each protein was normalized according to the amount of Lamin A/C detected by its antibody (4C11, Cell Signaling Technology, Danvers, MA).
Statistical analysis
Values are presented as mean ± SEM. Statistical analysis was performed by the repeated measurement of one-way analysis of variance, followed by the Fisher’s test (Figs. , Tables and ) and Dunnett’s test (Fig. ). A probability of p < 0.05 was considered to indicate a significant difference among the means. For the single dose experiment (Fig. ), the differences between groups’ means were evaluated by the Student’s t-test (SPSS statistical package, version 11.0). Differences were considered significant at p < 0.05.
Table 2. Effects of the chronic administration of FBEP on physiological and metabolic parameters in SHRSP.Table Footnotea
Table 3. Effects of chronic administration of FBEP on mRNA expression levels in the liver, measured by quantitative RT-PCR.Table Footnotea
Fig. 1. Effect of a single oral dose of FBEP (2 g/kg body weight) on systolic BP.
Notes: Values are expressed as mean ± SEM, n = 4; *p < 0.05; †p < 0.01 denote a significant difference when compared with the control group.
Results
Effects of a single oral dose of FBEP on systolic BP
Fifteen-week-old male SHRSP, with hypertension and a systolic BP of approximately 220 mm/Hg, were used in this study to investigate whether or not FBEP shows antihypertensive effects after a single oral dose of FBEP at 2 g/kg body weight (Fig. ). The systolic BP of the control group was similar before and after administration of distilled water, with a slight decrease observed at 6 h. Administration of FBEP to the SHRSP effectively decreased systolic BP during the experimental period compared with that of the control group.
Effects of chronic administration of FBEP on physiological parameters of rats
At the end of the experimental period, chronic administration of FBEP did not affect the physiological parameters of SHRSP, such as food intake, body weight gain, final body weight, food efficiency ratio, and organ weight (liver and kidney) (Table ). The intakes of both FBEP groups were 76.6 ± 1.5 mg/day (FBEP1) and 376.4 ± 9.10 mg/day (FBEP2).
Effects of chronic administration of FBEP on BP, plasma BUN, and albumin
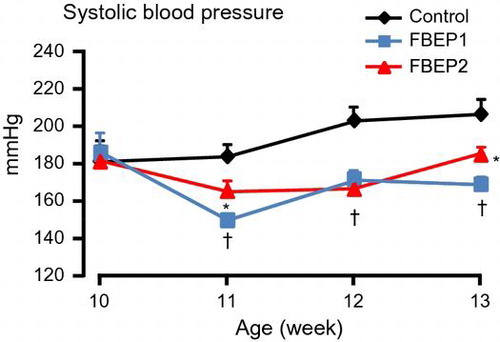
Low and high dose chronic administration of FBEP significantly decreased the systolic and diastolic BP of the rats; however, the heart rates were not different among the groups (Fig. (A)–(C)). The decrease in systolic BP started during the first week of experiment and lasted until the end of experiment compared with the control group. At the end of the experimental period, the low dose of FBEP was more effective in decreasing the systolic BP than the high dose of FBEP, even though both groups showed a significant difference when compared to the control group. The mean systolic BP was 206.7 ± 8.2, 169.0 ± 4.3, and 184.8 ± 4.5 mm Hg for the control, FBEP1, and FBEP2, respectively. Both FBEP groups significantly reduced the diastolic BP in the second week after administration compared with the control group. We further analyzed the plasma kidney function parameters of SHRSP, including albumin and BUN levels. The results showed that the low dose FBEP group had significantly lower plasma albumin than the control group (Table ), while there was no significant difference in the high dose FBEP group compared to the control group. Plasma BUN results were similar between the control and both FBEP groups.
Fig. 2. Effects of chronic administration of FBEP on systolic BP (A), diastolic BP (B), and heart rates (C).
Notes: Values are expressed as a mean ± SEM, n = 6; *p < 0.05; †p < 0.01 denote a significant difference when compared with the control group.
Effects of chronic administration of FBEP on plasma lipid, glucose, and insulin
Table summarizes the values of plasma and hepatic lipid contents obtained from this study. At the end of the study, the low dose FBEP groups had significantly lower plasma TG and lower total lipids although the difference was not significant (p = 0.052) compared with the control group. The high dose FBEP group showed significantly higher plasma TC when compared with the control group. Furthermore, there was no difference in the plasma HDL-cholesterol, LDL-cholesterol, hepatic TG, and TC between the FBEP group and the control. After three weeks, the low dose FBEP group exhibited a significant reduction in plasma glucose and insulin levels compared with the control group (Table ). To determine whether FBEP improves glucose tolerance, we performed OGTT after two weeks of FBEP administration at a dose of 1.8 g glucose/kg body weight (Fig. ). Both FBEP groups showed no significant difference in response to the glucose administration compared with the control group. Moreover, the HOMA-IR indices of the low dose FBEP group were significantly lower than the control group (Table ).
Fig. 3. Changes in plasma glucose (A), iAUC glucose (B), plasma insulin (C), and iAUC insulin (D) based on the OGTT in rats.
Notes: Values are expressed as a mean ± SEM, n = 5–6; *p < 0.05 denotes a significant difference when compared with the control group.
Effects of chronic administration of FBEP on plasma SOD, CAT, and 8-OHdG
In order to evaluate the protective effect of FBEP on oxidative stress markers, we examined the activities of antioxidant enzymes, including SOD and CAT. The low dose FBEP diet group had significantly higher plasma total SOD and CAT enzymatic activities (Fig. (A) and (B)) compared with the control group. Furthermore, plasma 8-OHdG levels, another oxidative marker, was significantly decreased (Fig. (C)) in the low dose FBEP diet group, but not in the high dose FBEP diet group.
Fig. 4. Effect of FBEP on SOD (A) and CAT (B) activities and the level of 8-OHdG (C) in plasma of rats.
Notes: Values are expressed as a mean ± SEM, n = 5. Different letters represent significant differences (p < 0.05).
Effects of chronic administration FBEP on mRNA expression and protein levels in the liver
In order to understand further the mechanisms by which FBEP decreases oxidative markers, we analyzed the effect of FBEP administration on mRNA expression levels in the liver using quantitative RT-PCR (Table ). The hepatic mRNA expression of antioxidants, including catalase (Cat), glutathione peroxidase 1 (Gpx1), glutathione reductase (Gsr), and peroxiredoxin 2 (Prdx2) were upregulated in the low dose FBEP diet group compared to that in the control group. Hepatic Nrf2 expression in the low dose FBEP group was also significantly upregulated compared with the high dose FBEP and control groups. Furthermore, the mRNA level of NADPH-oxidase 1 (Nox1) was significantly downregulated by the low dose FBEP diet group. The mRNA expression levels of peroxisome proliferator-activated receptor α (Pparα), sterol regulatory element binding transcription factor 1 (Srebf1), fatty acid synthase (Fasn), and cytochrome P450, family 7, subfamily a, polypeptide 1 (Cyp7a1) did not show significant differences among the groups. The mRNA levels of genes related to glucose metabolism, including glucose-6-phosphatase, catalytic subunit (G6pc), and phosphoenolpyruvate carboxykinase 1 (Pck1), were lower in the low dose FBEP diet group, although the difference was not significant. We used western blot analysis to determine the protein levels of Nrf2 (Fig. ) in the liver. Western blot analysis showed that the administration of FBEP increased the nuclear Nrf2 protein level in both groups compared with the control group.
Fig. 5. Effects of FBEP administration on Nrf2 by western blot analysis.
Notes: Each lane was loaded with 20 μg protein. Data have been normalized with lamin A/C. Values are expressed as mean ± SEM, n = 6; *p < 0.05 denotes a significant difference when compared with the control group.
Discussion
The present study is the first report, to our knowledge, in which both a single dose and chronic administration of FBEP improved hypertension in SHRSP. Indeed, we have shown that FBEP administration improves insulin sensitivity, enhances plasma catalase and SOD activities, decreases plasma 8-OHdG, and upregulates hepatic gene expression of antioxidant genes. These results extend the findings of our previous studiesCitation10–12) suggesting that FBE may play a key role in the regulation of lifestyle-related diseases in SHRSP.
A single dose of FBEP at 2.0 g/kg body weight lowers BP at 1, 2, 4, and 6 h after administration (Fig. ). The development of high BP was significantly prevented by the supplementation of both low and high doses of FBEP in the diets of rats (Fig. (A) and (B)). Angiotensin I-converting enzyme (ACE) inhibitory activity in FBEP might be a possible factor responsible for the decrease in the BP of SHRSP. ACE, a dipeptidyl carboxypeptidase (EC 3.4.15.1), belongs to the class of zinc proteases that play a key role in the regulation of BP through their actions in the body.Citation21) In recent years, various kinds of bioactive peptides containing ACE inhibitory peptides have been extensively isolated and reported, such as fermented milk, soy sauce-like seasoning, loach, dried-salted fish, and tofuyo-fermented soybean food.Citation22–25) In addition, there have also been a few reports on non-peptidyl ACE inhibitors such as polyphenol, which is found in foods such as mushroom, ashitaba, and garlic.Citation26–28) FBE contains a high level of polyphenol, 850 mg/100 mL.Citation10) FBEP exhibited angiotensin I-converting enzyme inhibitory activity with an IC50 value 68.3 μg/mL. We believe that the ACE-inhibitory substances contained in FBEP could be responsible for the decrease in BP of SHRSP in single and chronic administration.
Excess ROS generation decreased antioxidant defense mechanisms by reducing antioxidant enzymes, such as catalase, SOD, and GPx, which contribute to oxidative stress in patients with hypertension.Citation29) In the present study, we found that the low dose FBEP diet group had significantly higher plasma SOD and catalase enzymatic activities. The levels of plasma 8-OHdG, one of systemic oxidative markers, was significantly decreased by the low dose FBEP diet group, but not the high dose FBEP diet group. Our results corresponded with previous studies demonstrating the potential of antioxidants in treating conditions associated with oxidative stress.Citation30)
Similar to the results of the plasma SOD and catalase enzymatic activities, we found that the hepatic mRNA expression of antioxidants, including Cat, Gpx1, and Gsr, were also upregulated by the low dose FBEP diet. In addition, Nrf2 plays an important role in the activation of antioxidant enzymes such as SOD, catalase, GPx, Gsr, and Nox1 by regulating their transcription.Citation31) Thus, we showed that compared with the high dose FBEP group and the control group, the low dose FBEP group showed a significant upregulation of hepatic Nrf2 expression. Furthermore, the mRNA expression of NADPH-oxidase 1 (Nox1), one of the indicators of lipid peroxidation, was significantly downregulated by the low dose FBEP diet group. The downregulation of Nox1 is one of the key factors in improving hypertension in SHRSP due to the importance of NADPH oxidase in metabolic-related diseases. It has been demonstrated that polymorphisms in NADPH oxidase subunits are associated with increased atherosclerosis and hypertension.Citation32) Inhibition of Nox1 expression and activity by chlorogenic acid, one of the polyphenol components contained in coffee, has contributed to decrease free radical production related to hypertension.Citation33) Our previous results showed that, the polyphenol content of FBE exhibited antioxidative activity of IC50 at 100.37 mg/mLCitation10) providing protection against oxidative stress and suppression of ROS in SHRSP.
Since Nrf2 acts in DNA promoter regions as a direct factor for the transcription of the antioxidant enzymes, we determined whether FBEP also influences the expression of Nrf2 protein levels. The protein level of nuclear Nrf2 was measured and showed an increase in nuclear protein levels in both groups (Fig. ) compared with that in the control. Since Nrf2 plays an important role in the transcription of antioxidant enzymes, the upregulation of Nrf2 protein could contribute to an increase in the expressions of SOD, CAT, and GPx, resulting in higher activities of these enzymes.
Polyphenols are free radical scavengers and can reduce the complications of diabetes.Citation34) Green tea polyphenols, containing green tea catechins, given to Wistar rats that were fed high-fructose diets caused a significant decrease in blood glucose and insulin levels.Citation35) In the present study, the low dose FBEP group exhibited a significant reduction in plasma glucose and insulin levels compared with the control group. Moreover, the HOMA-IR indices of the low dose FBEP group were significantly lower than the control group. Therefore, the results of our study clearly demonstrate that FBEP can improve insulin sensitivity in SHRSP.
In this study, low dose and high dose of FBEP showed similar tendency to decrease plasma insulin level (Table ) and to increase enzyme activities of SOD and catalase (Fig. ), even though significant difference was only found in low dose of FBEP. Our previous study showed that indices of oxidative stress were significantly reduced in mice fed 5% FBEP diet for three months.Citation36) In another experiment, administration of FBEP (2 or 4 g/kg body weight) enhanced urinary excretion of uric acid in adenine-induced urinary hyperuricemia model in dose dependent manner.Citation12) Therefore, we suggest that optimal dose of FBEP may be varied among the experimental disease models.
In summary, our results showed that a single oral and chronic administration of FBEP is effective in improving BP. Furthermore, it is possible to conclude that the administration of FBEP was sufficient to modulate the protein Nrf2, which contributed to an increase in the activity of antioxidant enzymes and improved the defensive status against oxidative stress. Therefore, the results of this study suggest that FBEP supplementation may be a potential treatment against oxidative stress in patients with metabolic syndrome.
Author contribution
All authors are responsible for the content of the manuscript. Ardiansyah carried out majority of the analytical work, designed the experiment and wrote the manuscript. Puspo E. Giriwono, Kazuki Oguchi, Kazuma Ueda, and Shoko Sato contributed to the western blot analysis. Hideki Hokazono, Kazuyuki Hiwatashi, Saori Takahashi, and Michio Komai were involved in the experiments and discussion of the experimental results. Hitoshi Shirakawa contributed to the supervision and drafting of the manuscript and to the design of some of the experiments.
Disclosure statement
No potential conflict of interest was reported by the authors.
Notes
Abbreviations: 8-OHdG, 8-hydroxy-2′-deoxyguanosine; BP, blood pressure; BUN, blood urea nitrogen; Cat, catalase; Gpx1, glutathione peroxidase 1; Gsr, glutathione reductase; iAUC, incremental area under the curve; Nox1, NADPH-oxidase; Nrf2, NF-E2-related factor-2; OGTT, oral glucose tolerance test; ROS, reactive oxygen species; SHRSP, stroke-prone spontaneously hypertensive rats; Sod1, cytosolic superoxide dismutase 1; TC, total cholesterol; TG, triglyceride.
Related Research Data
References
- Chobanian AV. Mixed messages on blood pressure goals. Hypertension. 2011;57:1039–1040.10.1161/HYPERTENSIONAHA.111.170514
- FitzGerald RJ, Murray BA, Walsh DJ. Hypotensive peptides from milk proteins. J. Nutr. 2004;134:980S–988S.
- Hamilton CA, Miller WH, Al-benna S, et al. Strategies to reduce oxidative stress in cardiovascular disease. Clin. Sci. 2004;106:219–234.10.1042/CS20030379
- Giugliano D. Dietary antioxidant for cardiovascular prevention. Nutr. Metab. Cardiovasc. Dis. 2000;10:38–44.
- Vicente SJV, Ishimoto EY, Torres EAFS. Coffee modulates transcription factor Nrf2 and highly increases the activity of antioxidant enzymes in rats. J. Agric. Food Chem. 2014;62:116–122.10.1021/jf401777m
- Rosario J, Juan D, Francisco PV. Epicatechin: endothelial function and blood pressure. J. Agric. Food Chem. 2012;60:8823–8830.
- Yeh CT, Yen GC. Induction of hepatic antioxidant enzymes by phenolic acids in rats is accompanied by increased levels of multidrug resistance-associated protein 3 mRNA expression. J. Nutr. 2006;136:11–15.
- Kwak MK, Wakabayashi N, Kensler TW. Chemoprevention through the Keap1-Nrf2 signaling pathway by phase 2 enzyme inducers. Mutat. Res. 2004;555:133–148.10.1016/j.mrfmmm.2004.06.041
- Yeh CT, Ching LC, Yen GC. Inducing gene expression of cardiac antioxidant enzymes by dietary phenolic acids in rats. J. Nutr. Biochem. 2009;20:163–171.10.1016/j.jnutbio.2008.01.005
- Giriwono PE, Hashimoto T, Ohsaki Y, et al. Extract of fermented barley attenuates chronic alcohol induced liver damage by increasing antioxidative activities. Food Res. Int. 2010;43:118–124.10.1016/j.foodres.2009.09.008
- Giriwono PE, Shirakawa H, Hokazono H, et al. Fermented barley extract supplementation maintained antioxidative defense suppressing lipopolysaccharide-induced inflammatory liver injury in rats. Biosci. Biotechnol. Biochem. 2011;75:1971–1976.10.1271/bbb.110374
- Hokazono H, Omori T, Yamamoto T, et al. Effects of a fermented barley extract on subjects with slightly high serum uric acid or mild hyperuricemia. Biosci. Biotechnol. Biochem. 2010;74:828–834.10.1271/bbb.90936
- Ardiansyah, Shirakawa H, Koseki T, et al. Rice bran fractions improve blood pressure, lipid profile, and glucose metabolism in stroke-prone spontaneously hypertensive rats. J. Agric. Food. Chem. 2006;54:1914–1920.10.1021/jf052561l
- Friedewald WT, Levy RI, Fredrickson DS. Estimation of the concentration of low-density lipoprotein cholesterol in plasma without use of the preparative ultracentrifuge. Clin. Chem. 1972;18:499–502.
- Folch J, Lees M, Stanley GHS. A simple method for the isolation and purification of total lipid from animal tissues. J. Biol. Chem. 1957;226:497–509.
- Wolever TM, Jenkins DJ. The use of the glycemic index in predicting the blood glucose response to mixed meals. Am. J. Clin. Nutr. 1986;43:167–172.
- Matthews DR, Hosker JP, Rudenski AS, et al. Homeostasis model assessment: insulin resistance and beta-cell function from fasting plasma glucose and insulin concentrations in man. Diabetologia. 1985;28:412–419.10.1007/BF00280883
- Shirakawa H, Ohsaki Y, Minegishi Y, et al. Vitamin K deficiency reduces testosterone production in the testis through down-regulation of the Cyp11a a cholesterol side chain cleavage enzyme in rats. Biochim. Biophys. Acta. 2006;1760:1482–1488.10.1016/j.bbagen.2006.05.008
- Mura C, Le Gac G, Jacolot S, et al. Transcriptional regulation of the human HFE gene indicates high liver expression and erythropoiesis coregulation. FASEB J. 2004;18:1922–1924.
- Taguchi K, Hirano I, Itoh T, et al. Nrf2 enhances cholangiocyte expansion in Pten-deficient livers. Mol. Cell Biol. 2014;34:900–913.10.1128/MCB.01384-13
- Wang JP, Hu JN, Cui JZ, et al. Purification and identification of a ACE inhibitory peptide from oyster proteins hydrolysate and the antihypertensive effect of hydrolysate in spontaneously hypertensive rats. Food Chem. 2008;111:302–308.10.1016/j.foodchem.2008.03.059
- Nakahara T, Sano A, Yamaguchi H, et al. Antihypertensive effect of peptide-enriched soy sauce-like seasoning and identification of its angiotensin I-converting enzyme inhibitory substances. J. Agric. Food. Chem. 2010;58:821–827.10.1021/jf903261h
- Li Y, Zhou J, Huang K, et al. Purification of a novel angiotensin I-converting enzyme (ACE) inhibitory peptide with an antihypertensive effect from loach (Misgurnus anguillicaudatus). J. Agric. Food. Chem. 2012;60:1320–1325.10.1021/jf204118n
- Astawan M, Wahyuni M, Yasuhara T, et al. Effects of angiotensin I-converting enzyme inhibitory substances derived from indonesian dried-salted fish on blood pressure of rats. Biosci. Biotechnol. Biochem. 1995;59:425–429.10.1271/bbb.59.425
- Kuba M, Tanaka K, Tawata S, et al. Angiotensin I-converting enzyme inhibitory peptides isolated from tofuyo fermented soybean food. Biosci. Biotechnol. Biochem. 2003;67:1278–1283.10.1271/bbb.67.1278
- Choi HS, Cho HY, Yang HC, et al. Angiotensin I-converting enzyme inhibitor from Grifola frondosa. Food Res. Int. 2001;34:177–182.10.1016/S0963-9969(00)00149-6
- Shimizu E, Hayashi A, Takahashi R, et al. Effects of angiotensin I-converting enzyme inhibitor from ashitaba (Angelica keiskei) on blood pressure of spontaneously hypertensive rats. J. Nutr. Sci. Vitaminol. 1999;45:375–383.10.3177/jnsv.45.375
- Sharifi AM, Darabi R, Akbarloo N. Investigation of antihypertensive mechanism of garlic in 2K1C hypertensive rat. J. Ethnopharmacol. 2003;86:219–224.10.1016/S0378-8741(03)00080-1
- Simic DV, Mimic-Oka J, Pljesa-Ercegovac M, et al. Byproducts of oxidative protein damage and antioxidant enzyme activities in plasma of patients with different degrees of essential hypertension. J. Hum. Hypertens. 2006;20:149–155.10.1038/sj.jhh.1001945
- Montezano AC, Touyz RM. Molecular mechanisms of hypertension—reactive oxygen species and antioxidants: a basic science update for the clinician. Can. J. Cardiol. 2012;28:288–295.10.1016/j.cjca.2012.01.017
- Zhang Q, Pi J, Woods CG, et al. A systems biology perspective on Nrf2-mediated antioxidant response. Toxicol. Appl. Pharmacol. 2010;244:84–97.10.1016/j.taap.2009.08.018
- San José G, Fortuño A, Beloqui Ó, et al. NADPH oxidase CYBA polymorphisms, oxidative stress and cardiovascular diseases. Clin. Sci. ( London). 2008; 114:173–182.10.1042/CS20070130
- Zhao Y, Wang J, Ballevre O, et al. Antihypertensive effects and mechanism of chlorogenic acid. Hypertens. Res. 2011;35:370–374.
- Ihara Y, Toyokuni S, Uchida K, et al. Hyperglycemia causes oxidative stress in pancreatic beta-cells of GK rats, a model of type 2 diabetes. Diabetes. 1999;48:927–932.10.2337/diabetes.48.4.927
- Qin B, Polansky MM, Harry D, et al. Green tea polyphenols improve cardiac muscle mRNA and protein levels of signal pathways related to insulin and lipid metabolism and inflammation in insulin-resistant rats. Mol. Nutr. Food Res. 2010;54:S14–S23.10.1002/mnfr.v54.4s
- Hokazono H, Omori T, Suzuki H, et al. Effects of fermented barley extract on antioxidant status in mice. Food Sci. Technol. Res. 2009;15:599–604.10.3136/fstr.15.599