
Abstract
Hypocholesterolemia has been epidemiologically identified as one of the causes of stroke (cerebral hemorrhage). We previously reported that lower protein levels of mevalonate pyrophosphate decarboxylase (MPD), which is responsible for reducing serum cholesterol levels in stroke-prone spontaneously hypertensive rats (SHRSP), in the liver were caused by a reduction in mRNA levels. However, the mechanism responsible for reducing MPD expression levels in the SHRSP liver remains unclear. Thus, we compared microRNA (miR)-214 combined with the 3′-untranslated region of MPD mRNA and heterogeneous nuclear RNA (hnRNA) between SHRSP and normotensive Wistar Kyoto rats (WKY). miR-214 levels in the liver were markedly higher in SHRSP than in WKY, whereas hnRNA levels were significantly lower. These results indicate that the upregulation of miR-214 and downregulation of MPD transcription in the liver both play a role in the development of hypocholesterolemia in SHRSP.
Graphical abstract
The upregulation of miR-214 and downregulation of MPD transcription in the liver both play a role in the development of hypocholesterolemia in SHRSP.
Cholesterol is a major constituent of cellular membranes; therefore, reductions in the cholesterol content in the cell have been shown to reduce the proliferation of cells, enhance cell membrane fluidity, and lead to fragile plasma membranes.Citation1–3) An epidemiological study identified lower serum cholesterol levels as one of the causes of cerebral hemorrhage because the risk of death from cerebral hemorrhage was found to be three fold higher in men with lower serum cholesterol levels (<160 mg/dL) than in those with higher cholesterol levels (≥160 mg/dL).Citation4,5) The liver is the main site for cholesterol synthesis, and cholesterol is supplied to other tissues by lipoproteins released from liver that contain cholesterol. The hepatic biosynthesis of cholesterol from acetic acid requires more than 20 enzymatic reactions. HMG-CoA reductase is known to be a rate-limiting enzyme in cholesterol synthesis. Statin, which is an inhibitor of HMG-CoA reductase, has been shown to decrease serum cholesterol levels by accelerating the uptake of low-density lipoprotein (LDL) from serum to the liver, which, in turn, supplements low cholesterol levels in the liver caused by the decreased biosynthesis of cholesterol due to the suppression of HMG-CoA reductase.Citation6) Lower serum cholesterol levels are considered to be highly influenced by reductions in the content of cholesterol due to the inhibition of cholesterol biosynthetic enzymes in the liver. Cholesterol biosynthetic enzymes containing HMG-CoA reductase are regulated by transcription factors (sterol regulatory element binding proteins: SREBPs).Citation7–10) Three isoforms (SREBP-1a, -1c, and -2) of SREBPs have so far been identified in mammals. Previous studies using knockout mice showed that SREBP-1c acted as a transcriptional factor in fatty acid synthesis, SREBP-2 was specifically involved in cholesterol synthesis, and SREBP-1a activated the synthesis of both fatty acids and cholesterol.Citation11,12) SREBPs in the endoplasmic reticulum (ER) membrane require proteolytic processing (two-steps proteolytic process of cleavage after transfer from ER to Golgi complex) to release N-terminal bHLH-Zip domains into the nucleus, and the N-terminal domains of SREBP bind to target genes (sterol regulatory element : SRE) in order to activate the transcription of fatty acids or cholesterol synthesis.Citation13) SREBP processing is regulated by changes in the content of cholesterol in the liver or the amount of cholesterol absorbed from the small intestine. Increases in cellular cholesterol synthetic enzymes and receptors (LDL-receptor) involved in the uptake of serum cholesterol by the liver have been attributed to the stimulation of SREBP processing by the depletion of cholesterol levels in liver or the amount of cholesterol (small amount) absorbed from the small intestine. Furthermore, the inhibition of SREBP processing by increases in cellular cholesterol levels or the amount of cholesterol (large amount) absorbed from the small intestine decreased the cholesterol synthetic enzymes and receptors involved in the uptake of serum cholesterol by the liver. On the other hand, serum cholesterol levels were previously shown to be highly influenced by the absorption of cholesterol from the small intestine as well as the accumulation of phytosterols in the liver.Citation14) Phytosterols compete with cholesterol for intestinal absorption to limit absorption and inhibit the activity of the HMG-CoA reductase and cholesterol 7α-hydroxylase, which is the rate-limiting enzyme in the formation of bile acid from cholesterol.Citation14) The ATP binding cassette (ABC) transporters ABCG5 and ABCG8, which are localized in the small intestine and liver, have been shown to excrete phytosterols from the small intestine lumen to gastrointestinal tract and also facilitate the secretion of bile acids containing cholesterol from the liver.Citation15) A previous study using knockout mice of ABCG5/8 reported that cholesterol levels in plasma, bile acids, and the liver as well as cholesterol biosynthetic enzymes (the mRNA levels of 14 enzymes) including HMG-CoA reductase in the liver were significantly lower in knockout mice than in wild-type.Citation15) These findings suggested serum cholesterol levels were influenced by the absorption and excretion of cholesterol and phytosterols from the small intestine, the biosynthesis and excretion of cholesterol in the liver, the uptake of serum cholesterol by receptors in the liver, the formation and secretion of bile acids in the liver, and the contents of cholesterol and phytosterols in serum and the liver. Recent studies demonstrated the transcytosis of LDL receptors in endothelial cells in the rat brain.Citation16–18) Therefore, cholesterol in vascular endothelial cells (VECs) in the brain is supplied/maintained at a constant level via two pathways: the uptake of LDL-mediated cholesterol from the serum and the synthesis of cholesterol in VECs. Thus, lower cholesterol levels in the serum and the reduced biosynthesis of cholesterol by the brain may induce angionecrosis in the brain.
Although no significant differences have been reported in the metabolism of cholesterol between rats and humans, the ratio of lipoprotein ([high-density lipoprotein] HDL and LDL) in rat serum (HDL > LDL) differed from that in human serum (LDL > HDL) because the cholesterol ester transfer protein, which transfers cholesterol esters from HDL to VLDL and LDL, is absent in rats.Citation19) stroke-prone spontaneously hypertensive rats (SHRSP) are rats with severe hypertension and stroke.Citation20,21) Serum cholesterol levels in these rats are lower than those in normotensive Wistar Kyoto rats (WKY).Citation22) Shiota et. al reported that the pathogenesis of stroke in SHRSP was inhibited by the feeding of high fat and cholesterol diets.Citation23) Yamori et al. also demonstrated that the intake of a diet containing cholesterol for a 2-month period reduced the incidence of cerebral sites in SHRSP.Citation24,25) Therefore, lower serum cholesterol levels in SHRSP may play a role in the development of cerebral strokes in these rats. SHRSP have a missense mutation in the ABCG5 gene.Citation26) However, there were no difference of the biliary secretion and lymphatic absorption of plant sterols between SHRSP and WKY (without the mutation in ABCG5) fed on a diet containing 0.5% plant sterols, although plant sterols in serum and the liver in SHRSP were higher than those in WKY.Citation27) Also, the amount of plant sterols in the serum (12–15%) of SHRSP rats fed commercial pellets was the same as that of WKY.Citation28) In order to determine the mechanisms responsible for reducing serum cholesterol levels in SHRSP, the following were examined: (1) absorption of dietary cholesterol (SHRSP > WKY),Citation29) (2) disappearance of labeled cholesterol from the serum (SHRSP < WKY),Citation30) (3) biosynthesis of cholesterol from acetic acid in the liver (SHRSP < WKY),Citation31) (4) the activity of cholesterol 7α-hydroxylase (SHRSP = WKY).Citation32) Furthermore, the activity of mevalonate pyrophosphate decarboxylase (MPD), which is involved in cholesterol biosynthesis, was previously shown to be reduced in the livers of SHRSP.Citation33) If reductions in cholesterol levels in the liver and serum are caused by the accumulation of plant sterols in SHRSP livers due to a mutation in ABCG5, a decrease in cholesterol biosynthetic enzymes may occur in these livers. However, the amount of plant sterols in the serum of SHRSP fed commercial pellets,Citation28) and the activities of HMG-CoA reductase, mevalonate kinase, and phosphomevalonate kinase in the liver were found to be similar to those in WKY.Citation28,33) As described above, lower serum cholesterol levels are strongly influenced by the inhibition of cholesterol biosynthetic enzymes. Therefore, lower serum cholesterol levels in SHRSP may be more strongly influenced by reductions in a specific cholesterol biosynthetic enzyme (MPD) than in the accumulation of plant sterols by a mutation in ABCG5 in liver. We previously demonstrated that the reduced activity of MPD was caused by lower protein levels of MPD in the liver; however, no significant difference was observed in MPD-specific activity between SHRSP and WKY.Citation34) We also reported that MPD mRNA levels in the liver were lower in SHRSP than in WKY.Citation35) These findings indicated that the reduced expression of MPD could be attributed to two causes. Low MPD mRNA levels in the livers of SHRSP may be caused by (1) a post-transcriptional effect (accelerated mRNA degradation or inhibited translation from mRNA to protein) or (2) reduction in the expression of heterogeneous nuclear RNA (hnRNA) at the transcriptional level.
microRNA (miR) was recently shown to reduce protein levels by inhibiting its synthesis from mRNA or accelerating the degradation of mRNA.Citation36,37) ABCA1 facilitates the efflux of cholesterol from various tissues including the liver to serum HDL or poorly lapidated apoA-I, and is reportedly regulated by miR-33 incorporated in the introns in the SREBP genes.Citation38) Marked reductions in cholesterol levels in the liver elevate miR-33 with SREBP transcription, and the efflux of cholesterol contents from the liver is inhibited by the degradation of ABCA1 due to the upregulation of miR-33. Whether miR is involved in the decrease in MPD mRNA, whether miR involved in the degradation of MPD mRNA is present in the introns of transcription factor genes similarly to miR-33 incorporated in the introns of the SREBP genes, and whether the miR level is increased in the liver of SHRSP remain unclear. We also hypothesized that the lower hnRNA levels of MPD containing an intron in the livers of SHRSP may have been caused by an increase in repressor binding to the silencer element in the promoter sequence of MPD or a decrease in activator binding to the enhancer element in the promoter region of MPD if the reduction in MPD mRNA levels that occurred due to changes in transcriptional level was considered.
In the present study, we determined whether endogenous MPD protein and mRNA levels in cells transfected with miR combined with the 3′-untranslated region (3′-UTR) of MPD mRNA were lower than those in non-treated cells, if miRNA levels in the liver were higher in SHRSP than in WKY, and also whether reductions occurred in the hnRNA levels of MPD in SHRSP.
Materials and methods
Materials
Rabbit anti-GAPDH IgG or rabbit anti-Rab 5 IgG was purchased from Santa Cruz Biotechnology, Inc. (Santa Cruz, CA.); goat anti-rabbit IgG conjugated to horseradish peroxidase (HRP), from Invitrogen Corporation (Carlsbad, CA.); Quick Gene RNA tissue kit SII, from Fujifilm (Tokyo, Japan); the ECL Western blotting detection kit, from GE Healthcare (Tokyo, Japan); pEGFP-n1, from Clontech Laboratories Inc.; recombinant DNase I and the SYBR Ex Script RT-PCR kit, from TaKaRa (Shiga, Japan); BioMasher®, from Nippi, Inc. (Tokyo, Japan); mmu-miR-214-3p and non-target RNA, from Cosmo Bio Co., Ltd. (Tokyo, Japan); reverse transcriptase (RT), from Thermo Fisher Scientific Inc. (Kanagawa, Japan); Lipofectamine RNAiMAX, Lipofectamine 2000, Taqman Micro RNA Assay Kit (miR-214 or U6 snRNA), and Taqman Micro RT Kit, from Life Technologies Japan; the High Pure miRNA Isolation Kit, from Roche; the cholesterol E-test Wako, from Wako (Osaka, Japan); o-nitrophenyl-β-d-galactopyranoside, from Sigma Aldrich (Tokyo, Japan); a PGV-B2 vector (PGV-B2) containing the luciferase gene and luciferase luminescence kit (PGL1500), from TOYO B-Net, Co., Ltd. (Tokyo, Japan); a pSV-β-galactosidase control vector (pSV), from Promega Corporation (U.S.A.); and the HDL and VLDL/LDL Quantification Kit, from BioVision, Inc. All other chemicals were of reagent grade and purchased commercially.
Animals
Inbred male (10 weeks old) SHRSP/Izm (average body weight: 220 g, average liver weight 6.6 g, and approximately 240 mm Hg) and WKY/Izm (average body weight: 250 g, average liver weight 7.1 g, and approximately 150 mm Hg) were obtained from the Disease Model Co-operative Research Association, Japan. Rats were fed pelleted rat food (Lab H Standard; Nosan Corporation Life-Tech Department) ad libitum. All rats were sacrificed at 9:00 for 3 days after purchasing. The experimental protocol was reviewed and approved by the Animal Care and Use Committee of Fukuyama University and complied with guidelines for the care and use of animals by the Ministry of Education, Culture, Sports, Science and Technology.
Cell culture and transfection of miRNA or pEGFP-n1
Normal rat kidney (NRK) cells were provided by Professor Tsuji (Ph.D.) of Fukuyama University.Citation39) NRK cells were cultured in D-MEM supplemented with 10% FCS.Citation39) Cells were grown at 37 °C in a humidified atmosphere of 5% CO2. mmu-miR-214-3p (15 pmol) or non-target RNA (15 pmol) was transfected into NRK cells (40% cells; cell culture plates 12-well) by the Lipofectamine RNAiMAX transfection reagent. Real-time polymerase chain reaction (PCR) or immunoblotting was conducted using non-treated NRK (non-treatment: control) or cultured NRK cells for 3 days after transfection. pEGFP-n1 (15 pmol) was also transfected into NRK cells (40% cells; cell culture plates 12-well) by Lipofectamine 2000. To examine the expression efficiency of GFP, observations under light or fluorescence microscopy to examine survival cells and cells transfected with GFP were conducted using cultured NRK cells for 3 days after transfection.
Real-time PCR of mRNA, hnRNA, and miR
Rat tissues (15 mg), transfected cells, or non-treated cells were homogenized with a Biomasher (tissue homogenizer; Asist, Tokyo, Japan). After the homogenate was dissolved with the appropriate reagents from the Quick Gene RNA tissue kit S II (Fujifilm, Tokyo, Japan), total RNA (17 μg) containing mRNA and hnRNA was isolated from the homogenate using the Quick Gene RNA tissue kit S II (total RNA extraction kit), recombinant DNase I, and Gene-810 (Nucleic Acid Isolation System; Fujifilm, Tokyo, Japan). The concentration of total RNA was calculated using a spectrophotometer (optical density [O.D.] 260 nm). Two-microgram samples of total RNA from each group of tissues or cells were subjected to RT using RT in a 50 μl reaction volume. After the RT reaction, the cDNA template was amplified by PCR with the SYBR Ex Script RT-PCR kit. SYBR Green was used for the real-time PCR analysis of cholesterol biosynthetic enzymes, which was performed using an ABI7500 system (Applied Biosystems Japan, Tokyo, Japan). The cDNA products generated by RT-PCR were electrophoresed on a 2% agarose gel and visualized by ethidium bromide staining under UV light.
Relative gene expression of mRNA was quantified using GAPDH as an internal control. Primer pairs (MPD: F-AGGACCGCATCTGGCTGAAC, R-TGACGCCACGTGCACCTTA/GAPDH: F-GGCACAGTCAAGGCTGAGAATG, R-ATGGTGGTGAAGACGCCAGTA/ HMG-CoA synthase: F-ACGTCATACCTCGCTGCATGTTTA, R-ACGTCATACCTCGCTGCATGTTTA/Squalene synthase: F-GCCCTGTCGTTAGCCCTTGA, R-TTGCAGGCCAGTCTGAGCTAGTTA) were designed using the primer Select program of TaKaRa. Primer pairs of phosphatase and tensin homolog deleted from chromosome 10 (PTEN: F-GATGGATTCGACTTAGACTTGACC, R-GGTGTCATAATGTCTCTCAGCAC) were designed using UCSC Genome Bioinformatics. Relative gene expression of hnRNA was quantified using β-actin (the primer of the exon and intron regions) as an internal control. The primer pairs from the sites in the exon and intron of MPD or β-actin hnRNA were designed, respectively.
Also, total RNA containing miR was isolated from the homogenate using the High Pure miRNA Isolation Kit (Roche). Two-microgram samples of total RNA from each group of tissues or cells were subjected to RT using Taqman Micro RNA RT and the Taqman Micro RNA primer (miR-214 or U6 snRNA) in a 20 μl reaction volume. After the RT reaction, the cDNA template was amplified by PCR with the Taqman Micro RNA Assay Kit (miR-214 or U6 snRNA). Real-time PCR analysis was performed using an ABI7500 system (Applied Biosystems Japan, Tokyo, Japan). Relative gene expression of miR-214 was quantified using U6 snRNA as an internal control.
Preparation of the crude extract and immunoblot analysis
Rat tissues (15 mg), transfected cells, or non-treated cells were homogenized with five strokes in a Teflon homogenizer in three volumes of homogenization buffer containing 1% Triton X-100. After centrifugation for 1 h at 106,000 × g, the supernatant was used for the immunoblot analysis. SDS-PAGE was performed on 10% slab gels according to the method of Laemmli.Citation40) Proteins on the SDS-slab gel were transferred to a nylon membrane (NEN) by electrophoresis, using a modified version of the procedure of Towbin et al.Citation41) GAPDH, Rab5 or MPD (45 kDa) on the NEN was detected by incubating with rabbit anti-GAPDH IgG, rabbit anti-Rab5 IgG, or rabbit anti-MPD antiserum,Citation42) washing five times using wash buffer containing PBS and 1% skim milk, and then incubating with goat anti-rabbit IgG conjugated to HRP. Positive bands were visualized using the ECL Western blotting detection kit (Amersham Pharmacia, Amersham, UK), which contained a sensitive chemiluminescent substrate for HRP. Bands of MPD were quantified using the Intelligent Quantifier (Bio Image Systems, Inc.). Relative MPD protein levels were quantified using GAPDH as an internal control.
Luciferase reporter assay and galactosidase assay
The 3′UTR of MPD containing putative miR-214 matching sites was amplified by PCR from the cDNA of the rat liver using primers containing flanking XbaI recognition sequences (F-AGCTCTAGACTCTCCCATGTGCATCTGGAG, R-TAATCTAGACTAGCCAGCAGGAAGGTGAGGCAC). The PCR products were ligated in the XbaI restriction site downstream of the luciferase coding region of PGV-B2. NRK cells were plated at a confluency of 40–60% on 24-well plates. After a 24-h incubation, a mixture of 100 ng PGV-B2 containing putative miR-214 matching sites with mmu-miR-214-3p or non-target RNA were co-transfected with 100 ng pSV (containing the β-galactosidase gene) into NRK cells using Lipofectamine 2000. Luciferase and β-galactosidase activities were measured 48 h after transfection. A luciferase assay was carried out using a luciferase luminescence kit. β-galactosidase activity was measured by the method of Kaufmann et al.Citation43) β-galactosidase activity was measured by incubating enzymes with 2.6 mM o-nitrophenyl-β-d-galactopyranoside (ONPG) in 60 mM sodium phosphate buffer (pH 7.5) containing 6 mM KCl, 0.6 mM MgCl2, 0.06% Triton-X100, and 60 mM DTT at 37 °C for 10 min. Reactions were stopped by the addition of 0.6 M Na2CO3, and hydrolysis of the nitrophenyl group was detected spectroscopically at 420 nm. The efficiency of the uptake of PGV-B2 containing putative miR-214 matching sites was adjusted/normalized for β-galactosidase activity in pSV.
Cholesterol levels in liver and Serum
One hundred milligrams in the liver were homogenized in 500 μl of homogenization buffer (50 mM Tris–HCl, pH 7.5 containing 0.5 mM phenylmethylsulfonyl fluoride (PMSF), 10 mM 2-mercap-toethanol, 1 mM ethylenediaminetetraacetic acid (EDTA), and protease inhibitors [1 μM leupeptin, 1 μM pepstatin A, 1 μM chymostatin, and 1 μM antipain]) and centrifuged at 1,000 g for 10 min. Forty microliters of postnuclear supernatant were mixed with 5 ml of Folch extract (chloroform–methanol, 2:1), and the mixture was incubated for 10 min at 37 °C with shaking. After the mixture was centrifuged at 3,000 g for 10 min, 3 ml of the supernatant was evaporated dry by boiling at 100 °C, and then dissolved in 200 μl of isopropyl alcohol containing 1% Triton-X-100. The cholesterol content of the solution or serum (20 μl) was determined using the Cholesterol E-test Wako (O.D. 600 nm).
Isolation of HDL and VLDL/LDL fractions from serum
The HDL and VLDL/LDL fractions were isolated from serum with the HDL and VLDL/LDL Quantification Kit, and their cholesterol content measured (O.D. 570 nm).
Protein assay
Protein levels were measured by the method of Lowry et al. using bovine serum albumin as the standard.Citation44)
Statistical analysis
Statistical analyses were performed using the Student’s t-test (Microsoft Excel, Microsoft Japan. Co., Ltd). Data are presented as the means ± SD.
Results
Comparison of MPD expression levels in cells transfected with mmu-miR-214-3p
miR was recently shown to cause a reduction in protein levels by inhibiting its synthesis from mRNA or accelerating the degradation of mRNA.Citation36,37) Thus, we investigated whether miR was involved in reducing MPD mRNA levels. When miR combined with the 3′-UTR of MPD mRNA was searched for using microRNA.org (www.microrna.org/microrna/getGeneForm.do),Citation45) miR-214 was detected (Fig. ).
Fig. 1. The 3′-untranslated region of MPD mRNA and binding site of miR-214.
Notes: A: The 3′-untranslated region (3′-UTR) of MPD mRNA. uga is the stop codon of MPD mRNA. B: Binding site between the 3′-UTR of MPD mRNA and miR-214. * shows the binding site.
We initially investigated whether the uptake of mmu-miR-214-3p was caused by transfection, as described in the Materials and Methods. A comparison of miR-214 between NRK cells transfected with mmu-miR-214-3p and non-treated NRK cells (non-treatment) was performed by real-time PCR. miR-214 levels in NRK cells transfected with mmu-miR-214-3p were markedly higher (100-fold) than those in non-treated NRK cells (Fig. (A)). The uptake of mmu-miR-214-3p was confirmed by transfection. After pEGFP-n1 was transfected in NRK cells, the efficiency of expression by transfection was then calculated from the number of cells transfected with GFP and survival cells using fluorescence and transmission microscopy. The efficiency of GFP expression by transfection was approximately 50% (data not shown).
Fig. 2. MPD mRNA and protein levels in cells transfected with mmu-miR-214-3p.
Notes: A: Uptake of mmu-miR-214-3p by lipofection. Real-time PCR was performed using primer pairs for miR-214 or U6 snRNA from total RNA containing miR in NRK cells transfected with mmu-miR-214-3p and non-treated cells (non-treatment: control). Relative miR-214 levels were quantified using U6 snRNA as an internal control. Values are the means for two independent experiments. B: MPD mRNA levels in NRK cells transfected with mmu-miR-214-3p or non-target RNA and non-treated cells. Real-time PCR was performed using primer pairs for MPD or GAPDH from total RNA containing miR in NRK cells transfected with mmu-miR-214-3p or non-target RNA and non-treated cells (control). Relative MPD levels were quantified using GAPDH as an internal control. Values are the means ± SD of four independent experiments. C: MPD protein levels in NRK cells transfected with mmu-miR-214-3p or non-target RNA and non-treated cells. Samples (15 μg) for NRK cells transfected with mmu-miR-214-3p or non-target RNA and non-treated cells (control) were subjected to SDS-PAGE followed by immunoblot analysis. Bands of MPD were quantified using the Intelligent Quantifier. Relative MPD protein levels were quantified using GAPDH as an internal control. Values are the means ± SD of four independent experiments.
Furthermore, we established whether the mRNA and protein levels of endogenous MPD were reduced by the transfection of mmu-miR-214-3p. Although MPD mRNA levels in NRK cells transfected with non-target RNA were the same as those in non-treated NRK cells (control), MPD mRNA levels in NRK cells transfected with mmu-miR-214-3p were significantly lower (approximately 50%) than those in non-treated NRK cells (control) (Fig. (B)). MPD protein levels in NRK cells transfected with non-target RNA were also similar to those in non-treated NRK cells (control) (Fig. (C)). However, MPD protein levels in NRK cells transfected with mmu-miR-214-3p were markedly lower (approximately 55%) than those in non-treated NRK cells (control) (Fig. (C)). Rab5 (miR-214 does not bind to the 3′-UTR of Rab5 mRNA) protein levels in NRK cells transfected with mmu-miR-214-3p were similar to those in non-treated NRK cells (control) (data not shown). These results indicated that the reduction in MPD mRNA and protein levels was caused by an increase in miR-214 levels, and the transfection of non-targeted RNA did not negatively impact on MPD mRNA levels in the transfected NRK cells. Furthermore, the transfection (more 100-fold) of mmu-miR-214-3p had no effect on proteins unaffected by miR-214 such as Rab5.
Direct effects of miR-214 by the luciferase assay
In order to determine the direct effects of miR-214 on the MPD 3′-UTR, transient transfection experiments were carried out using the 3′-UTR of MPD, containing putative miR-214 matching sites, downstream of the luciferase open reading frame. Luciferase activity in co-transfected cells was significantly weaker with PGV-B2 and mmu-miR-214-3p (approximately 40%) than with PGV-B2 and non-target RNA (Fig. ). These results indicated that miR-214 bound to the sequence present in the 3′-UTR of rat MPD in order to suppress the expression of MPD.
Fig. 3. miR-214 directly bound to the 3′-UTR of MPD in the rat.
Notes: PGV-B2 (containing putative miR-214 matching sites downstream of the luciferase coding region) with mmu-miR-214-3p or non-target RNA and pSV (containing the β-galactosidase gene) were co-transfected. Luciferase and β-galactosidase activities were measured as described in the Materials and Methods. The efficiency of the uptake of PGV-B2 was adjusted for by β-galactosidase activity in pSV. Values are the means ± SD of four independent experiments.
Comparison of serum and liver cholesterol levels between SHRSP and WKY
In order to examine whether serum cholesterol levels in SHRSP reduce as described previously reported,Citation22) we compared not only total cholesterol, but also HDL- and VLDL/LDL-cholesterol in serum between SHRSP and WKY. Total cholesterol (approximately 40%), HDL (approximately 40%), and VLDL/LDL (approximately 20%) cholesterol levels in serum were significantly lower in SHRSP than in WKY (Fig. ). Furthermore, we investigated whether the decrease of cholesterol contents in the liver of SHRSP occurred by the reduction of MPD. Cholesterol contents in the liver of SHRSP were lower (approximately 20%) than that of WKY (Fig. ). From these data, it was suggested that serum cholesterol in SHRSP was decreased as described previously, and the reduction of cholesterol contents in the liver of SHRSP were caused by the reduction of MPD.
Fig. 4. Total cholesterol levels and cholesterol levels of HDL and VLDL/LDL in serum samples from WKY and SHRSP.
Notes: Total cholesterol levels (A) and the cholesterol levels of HDL (HDL-C: B) and VLDL/LDL (VLDL/LDL-C: C) were measured in serum samples as described in the Materials and Methods. Values are the means ± SD of four independent experiments.
Fig. 5. Cholesterol levels in liver of WKY and SHRSP.
Notes: Cholesterol levels in the liver were measured as described in Materials and Methods. Values are the means ± SD of four independent experiments.
Comparison of MPD and miR-214 expression levels between SHRSP and WKY
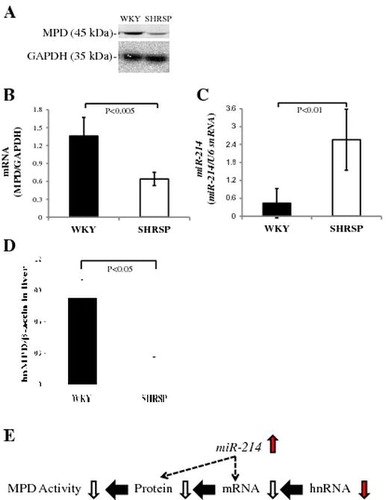
In order to confirm whether miR-214 levels in the liver were higher in SHRSP than in WKY, we measured the expression levels of miR-214 in SHRSP and WKY after MPD protein and mRNA levels in SHRSP were detected. MPD protein (approximately 80%) and mRNA (approximately 55%) levels in the liver were significantly lower in SHRSP than in WKY, which is consistent with previous findings (Fig. (A–C)). miR-214 levels in the liver were significantly higher (more 5-fold) in SHRSP than in WKY (Fig. (D)). These results suggested that MPD mRNA levels in the livers of SHRSP were partially reduced by an increase in miR-214 levels.
Fig. 6. MPD protein and mRNA levels in WKY and SHRSP livers.
Notes: A: Samples (15 μg) from the livers of WKY and SHRSP were subjected to SDS-PAGE followed by immunoblot analysis. B: Bands of MPD and GAPDH from the liver (A) were quantified using the Intelligent Quantifier. C: Real-time PCR was performed using primer pairs for MPD or GAPDH from total RNA in the livers of WKY and SHRSP. Relative protein (B) and mRNA (C) levels of MPD were quantified using GAPDH as an internal control. D: Real-time PCR was performed using primer pairs for miR-214 or U6 snRNA from total RNA containing miR in the livers of WKY and SHRSP. Relative miR-214 levels were quantified using U6 snRNA as an internal control. Values are the means ± SD of four independent experiments.
Comparison of HMG-CoA synthase, squalene synthase, and PTEN mRNA levels between SHRSP and WKY
To determine whether miR-214 was connected with the 3′-UTR of mRNA of cholesterol biosynthetic enzymes other than MPD, miR that bound to the 3′-UTR of mRNA of thirteen cholesterol biosynthetic enzymes was searched for using microRNA.org. As shown in Table , miR-214 was suggested to be bound to the 3′-UTR of mRNA of HMG-CoA synthase (HMG-CoAS) and squalene synthase (SQS). A previous study also reported that miR-214 bound to the 3′-UTR of PTEN mRNA and facilitated the degradation of PTEN mRNA.Citation46) Thus, we investigated whether the decrease in the mRNA levels of HMG-CoAS, SQS, and PTEN was caused by an increase in miR-214 levels in the livers of SHRSP. No significant differences were observed in HMG-CoAS, SQS, or PTEN mRNA levels in the liver between SHRSP and WKY, although a slight decrease was noted in PTEN mRNA in SHRSP (Fig. ). These results suggested that an increase in miR-214 levels was not involved in the regulation of HMG-CoAS and SQS mRNA levels in the livers of SHRSP. Furthermore, the degradation of PTEN may be partly attributed to an increase in miR-214 levels.
Table 1. miR combined with the 3′-UTR of cholesterol biosynthetic enzyme mRNA (Target mRNA) in rats.
Fig. 7. HMG-CoAS, SQS, and PTEN mRNA levels in WKY and SHRSP livers.
Notes: Real-time PCR was performed using primer pairs for HMG-CoAS, SQS, PTEN, or GAPDH from total RNA in the livers of WKY and SHRSP. Relative mRNA levels of HMG-CoAS, SQS, or PTEN were quantified using GAPDH as an internal control. Values are the means ± SD of four independent experiments.
Comparison of MPD hnRNA levels between SHRSP and WKY
If low levels of MPD hnRNA were detected in the livers of SHRSP, changes in the expression of MPD were considered to have occurred instead of a transcriptional regulation mechanism. Thus, we compared the hnRNA levels of MPD containing an intron in the liver between SHRSP and WKY. As shown in Fig. , primers to examine MPD hnRNA levels were prepared from the site of the exon and intron of MPD. When MPD hnRNA levels measured by real-time PCR using the above primers was subjected to reverse transcription using RT following the treatment of total RNA with DNase I, MPD hnRNA levels in the liver were significantly lower (approximately 60%) in SHRSP than in WKY (Fig. ). These results suggested that the decrease in MPD mRNA levels in the livers of SHRSP was caused by reductions in transcriptional levels.
Fig. 8. Exon and intron regions of β-actin and MPD.
Notes: Exon (under line) and intron regions in the DNA of β-actin (A) or MPD (B), respectively. Primer pairs (italic type) were designed from the sites of the exon and intron in the DNA of β-actin or MPD, respectively.
Fig. 9. MPD hnRNA levels in WKY and SHRSP livers.
Notes: Real-time PCR was performed using primer pairs (Fig. ) for MPD or β-actin from total RNA in the livers of WKY and SHRSP. Relative hnRNA levels of MPD were quantified using β-actin as an internal control. Values are the means ± SD of four independent experiments.
Discussion
We herein demonstrated that reductions in the endogenous mRNA and protein levels of MPD in cells were caused by marked increases in miR-214 levels (Fig. ), and miR-214 bound to the sequence in the 3′-UTR of MPD (Fig. ). We also found that miR-214 levels were higher while those of MPD hnRNA were lower in the SHRSP liver than in the WKY liver (Fig. (D) and ). The incidence rate of GFP in survival cells treated with pEGFP-n1 was approximately 50% (data not shown), MPD mRNA levels in cells transfected with mmu-miR-214-3p were also 50% those of non-treated cells (control) (Fig. (B)). Similar incidence rates of miR-214 and GFP suggested that most MPD mRNA was degraded in cells that incorporated miR-214. Furthermore, the incorporation of miR-214 into all cells led to the degradation of 50% of MPD mRNA. Thus, reductions (50–100%) were observed in MPD mRNA levels in cells that incorporated miR-214 because the amount of miR-214 in these cells was more 100-fold that in non-treated cells. miR-214 levels in the liver were 5-fold higher in SHRSP than in WKY (Fig. (D)); therefore, reductions (2.5–5%) were detected in MPD mRNA levels in the livers of SHRSP. Furthermore, lower MPD mRNA (55%) and hnRNA (60%) levels were found in the livers of SHRSP than in those of WKY (Fig. (C) and ). These results suggested that the decrease in MPD mRNA levels in the livers of SHRSP was mainly caused by a reduction in MPD hnRNA levels rather than an increase in miR-214 levels. We previously reported that MPD protein levels in the livers of SHRSP were reduced from as early as 2 weeks of age.Citation47) Therefore, reductions in MPD hnRNA levels in the livers of SHRSP in the present study may have occurred from 2 weeks of age. We also hypothesized that the lower MPD hnRNA levels detected in the livers of SHRSP may have been caused by an increase in repressor binding to the silencer element in the promoter sequence of MPD or a decrease in activator binding to the enhancer element in the promoter region of MPD from 2 weeks of age if the reduction in MPD hnRNA levels that occurred due to changes in transcriptional factors was considered. However, the promoter element containing the silencer and enhancer of MPD was not examined. Therefore, the promoter region and transcriptional factors of MPD need to be identified in order to more clearly understand the mechanism responsible for reducing MPD hnRNA levels in the SHRSP liver.
Although an 80% decrease was observed in MPD protein levels in the livers of SHRSP, its mRNA levels were reduced by 55% (Fig. (B, C)). miR is known to accelerate the degradation of mRNA or reduce protein levels by inhibiting its synthesis from mRNA.Citation36,37) A small amount of miR-214 in the livers of SHRSP may be involved in the suppression of protein synthesis from mRNA. Namely, miR-214 may act as inhibitor of translation rather than accelerating the degradation of mRNA.
miR that bound to the 3′-UTR of MPD mRNA was searched for using microRNA.org, and revealed miR-214 only; however, 36 or 13 miR were found to bind to the 3′-UTR of HMG-CoAS or SQS mRNA, respectively (Table ). As HMG-CoAS and SQS mRNA levels in the livers of SHRSP were similar to those in the livers of WKY (Fig. (A, B)), their mRNA levels may be regulated by a miR other than miR-214. When miR-214 levels in cells (transfected with mmu-miR-214-3p) markedly (more 100-fold) increased, PTEN mRNA was reduced (approximately 50%).Citation48) In the present study, a slight decrease was observed in PTEN mRNA levels in SHRSP (Fig. (C)). The 3′-UTR of PTEN has been combined with various miR (including miR-21, -19a, -26a, and -106b) other than miR-214.Citation48) Therefore, an increase not only in miR-214 levels (more 5-fold), but other miR may be required to cause significant reductions in PTEN mRNA levels,.
The results of the present study revealed that cholesterol contents in the liver were lower in SHRSP than in WKY, while no significant differences were noted in the mRNA levels of HMG-CoAS and SQS (Fig. (A,B)). These results suggested that the decrease observed in MPD mRNA and cholesterol levels in the livers of SHRSP was not regulated by SREBP. miR-214, which was mapped to chromosome 13, was not located in the introns of the enzymes involved in cholesterol metabolism or transcriptional factors such as miR-33, indicating that the decrease of MPD mRNA levels in the livers of SHRSP was caused by transcriptional factors or a regulation mechanism other than SREBP.
In the present study, we found that total cholesterol, HDL- and VLDL/LDL-cholesterol in the serum and cholesterol contents in the liver were significantly lower in SHRSP than in WKY (Fig. ). Reductions in VLDL-cholesterol in the serum of SHRSP may be responsible for low cholesterol contents due to a decrease in MPD in the liver. The reduction observed in HDL-cholesterol was attributed to an increase in the uptake of HDL from serum to the liver, which, in turn, supplemented low cholesterol levels in the livers of SHRSP caused by the decreased biosynthesis of cholesterol due to low MPD levels. Kato et al. reported that quantitative trait loci for serum cholesterol levels in SHRSP were detected on rat chromosomes 5, 7, and 15.Citation49) No significant relationship was detected between cholesterol traits and MPD, the lecithin:cholesterol acyltransferase gene mapped on rat chromosome 19, or the HMG-CoA reductase gene mapped on rat chromosome 2. Therefore, chromosome 19, which contains the MPD gene, may also be an essential/key chromosome for hypocholesterolemia/serum cholesterol because stroke is a polygenic disease.
The high miR-214 levels detected in the livers of SHRSP were attributed to the upregulation of miR-214 in the liver or transport to the liver from other tissues by exosomes containing miR-214. Exosomes are small membrane vesicles of an endosomal origin that are secreted into the extracellular compartment by exocytosis.Citation50) Exosomes consist of a limiting lipid bilayer, transmembrane proteins, and a hydrophilic core containing proteins, mRNAs, and miRs. Endothelial cells were previously shown to require miR-214 to secrete exosomes.Citation51) If an increase in miR-214 levels in the liver or other tissues occurred in SHRSP, exosomes containing miR-214 may be released from the liver or other tissues into the serum. Therefore, exosomal miR-214 expression in the serum may be related to the reduction in MPD mRNA levels or increase in miR-214 levels observed in the livers of SHRSP. Further studies are necessary to establish whether miR-214 is useful as a biomarker of stroke.
miR-214 was previously shown to be significantly downregulated in hepatocellular carcinoma (HCC) cells.Citation52) The overexpression of miR-214 inhibited the proliferation of HCC cells through β-catenin, which is a transcription factor (T-cell: TCF/Lymphoid enhancer factor: LEF) of coactivators. miR-214 could directly target the 3′-UTR of β-catenin mRNA and suppress its protein expression. In the present study, an increase in miR-214 levels in the livers of SHRSP was shown to be involved in reducing MPD levels. Cholesterol is a constituent of cellular membranes. Statin, which has a cholesterol-lowering function and is an inhibitor of HMG-CoA reductase, was shown to suppress hepatic cell proliferation.Citation53) Thus, the reduction induced in cholesterol biosynthesis by an increase in miR-214 levels may also be involved in inhibiting HCC cells.
In conclusion, reductions in MPD expression levels in the livers of SHRSP were suggested to be controlled by the upregulation of miR-214 and downregulation of transcriptional levels. Further studies are required to elucidate the mechanism responsible for reducing MPD protein levels in the SHRSP liver in more detail.
Author contribution
A.M. shared responsibility for the writing of the manuscript with H.M., and K.A. All authors were responsible for the study concept and design. N.I., Y.M., M.O., and M.U. carried it out. All the authors contributed to the critical revision of the manuscript.
Supplemental material
The supplemental material for this paper is available at http://dx.doi.org/10.1080/09168451.2015.1061417.
Disclosure statement
No potential conflict of interest was reported by the authors.
Related Research Data
References
- Bruckdorfer KR, Demel RA, De Gier J, van Deenen LL. The effect of partial replacements of membrane cholesterol by other steroids on the osmotic fragility and glycerol permeability of erythrocytes. Biochim. Biophys. Acta. 1969;183:334–345. 10.1016/0005-2736(69)90089-3
- Morita I, Sato I, Ma L, Murota S. Enhancement of membrane fluidity in cholesterol-poor endothelial cells pre-treated with simvastatin. Endothelium. 1997;5:107–113. 10.3109/10623329709079868
- Sato I, Ma L, Ikeda M, Morita I, Murota S. Simvastatin, a potent HMG-CoA reductase inhibitor, inhibits the proliferation of human and bovine endothelial cells in vitro. J. Atheroscler. Thromb. 1998;4:102–106. 10.5551/jat1994.4.102
- Iso H, Jacobs DR Jr., Wentworth D, Neaton JD, Cohen JD. Serum cholesterol levels and six-year mortality from stroke in 350,977 men screened for the multiple risk factor intervention trial. Engl N. J. Med. 1989;320:904–910. 10.1056/NEJM198904063201405
- Neaton JD, Blackburn H, Jacobs D, et al. Serum cholesterol level and mortality findings for men screened in the Multiple Risk Factor Intervention Trial. Multiple Risk Factor Intervention Trial Research Group. Arch. Intern. Med. 1992;152:1490–1500. 10.1001/archinte.1992.00400190110021
- Sirtori CR. Pharmacology and mechanism of action of the new HMG-CoA reductase inhibitors. Pharmacol. Res. 1990;22:555–563. 10.1016/S1043-6618(05)80047-7
- Brown MS, Goldstein JL. The SREBP pathway: regulation of cholesterol metabolism by proteolysis of a membrane-bound transcription factor. Cell. 1997;89:331–340. 10.1016/S0092-8674(00)80213-5
- Yokoyama C, Wang X, Briggs MR, et al. SREBP-1, a basic-helix-loop-helix-leucine zipper protein that controls transcription of the low density lipoprotein receptor gene. Cell. 1993;75:187–197. 10.1016/S0092-8674(05)80095-9
- Wang X, Sato R, Brown MS, et al. SREBP-1, a membrane-bound transcription factor released by sterol-regulated proteolysis. Cell. 1994;77:53–62. 10.1016/0092-8674(94)90234-8
- Hua X, Yokoyama C, Wu J, et al. SREBP-2, a second basic-helix-loop-helix-leucine zipper protein that stimulates transcription by binding to a sterol regulatory element. Proc. Natl. Acad. Sci. U. S. A. 1993;90:11603–11607. 10.1073/pnas.90.24.11603
- Shimano H, Yahagi N, Amemiya-Kudo M, et al. Sterol regulatory element-binding protein-1 as a key transcription factor for nutritional induction of lipogenic enzyme genes. J. Biol. Chem. 1999;274:35832–35839. 10.1074/jbc.274.50.35832
- Shimano H, Horton JD, Shimomura I, et al. Isoform 1c of sterol regulatory element binding protein is less active than isoform 1a in livers of transgenic mice and in cultured cells. J. Clin. Invest. 1997;99:846–854. 10.1172/JCI119248
- Daimiel LA, Fernández-Suárez ME, Rodríguez-Acebes S, et al. Promoter analysis of the DHCR24 (3β-hydroxysterol Δ(24)-reductase) gene: characterization of SREBP (sterol-regulatory-element-binding protein)-mediated activation. Biosci. Rep. 2012;33:57–69.
- Shefer S, Salen G, Bullock J, et al. The effect of increased hepatic sitosterol on the regulation of 3-hydroxy-3-methylglutaryl-coenzyme A reductase and cholesterol 7 alpha-hydroxylase in the rat and sitosterolemic homozygotes. Hepatology. 1994;20:213–219.
- Yu L, von Bergmann K, Lutjohann D, Hobbs HH, Cohen JC. Selective sterol accumulation in ABCG5/ABCG8-deficient mice. J. Lipid Res. 2004;45:301–307.
- Roux FS, Mokni R, Hughes CC, Clouet PM, Lefauconnier JM, Bourre JM. Lipid synthesis by rat brain microvessel endothelial cells in tissue culture. J. Neuropathol. Exp. Neurol. 1989;48:437–447. 10.1097/00005072-198907000-00005
- Candela P, Gosselet F, Miller F, et al. Physiological pathway for low-density lipoproteins across the blood-brain barrier: transcytosis through brain capillary endothelial cells in vitro. Endothelium. 2008;15:254–264. 10.1080/10623320802487759
- Méresse S, Delbart C, Fruchart JC, Cecchelli R. Low-density lipoprotein receptor on endothelium of brain capillaries. J. Neurochem. 1989;53:340–345. 10.1111/jnc.1989.53.issue-2
- Tsutsumi K, Hagi A, Inoue Y. The relationship between plasma high density lipoprotein cholesterol levels and cholesteryl ester transfer protein activity in six species of healthy experimental animals. Biol. Pharm. Bull. 2001;24:579–581. 10.1248/bpb.24.579
- Okamoto K, Yamori Y, Nagaoka A. Establishment of the stroke-prone spontaneously hypertensive rat (SHR). Cir. Res. 1974;34(35):143–153.
- Yamori Y. Gene-Environment Interaction in Common Diseases. In: Inoue E, Nishimura H. University of Tokyo Press:Tokyo;1977. p. 141–154.
- Iritani N, Fukuda E, Nara Y, Yamori Y. Lipid metabolism in spontaneously hypertensive rats (SHR). Atherosclerosis. 1977;28:217–222. 10.1016/0021-9150(77)90171-X
- Shiota C, Harada K, Ogawa H, Fukushima S, Sasagawa S. Effects of high-fat and cholesterol diets on SHRSP. Med. J. Kinki. Univ. 1981;6:125–131.
- Yamori Y, Horie R, Ohtaka M, et al. Effect of hypercholesterolemic diet on the incidence of cerebrovascular and myocardial lesions in spontaneously hypertensive rat. Clin. Exp. Pharmacol. Physiol. 1976;3 :205–208.
- Yamori Y, Horie R, Ohtaka M, Nara Y. Effect of high fat cholesterol diet on cerebrovascular circulation and the heart in stroke-prone SHR. Proceedings. Jpn. Heart J. 1977;18:533–535. 10.1536/ihj.18.533
- Scoggan KA, Gruber H, Lariviere K. A missense mutation in the Abcg5 gene causes phytosterolemia in SHR, stroke-prone SHR, and WKY rats. J. Lipid Res. 2003;44:911–916. 10.1194/jlr.M200438-JLR200
- Kato M, Ito Y, Tanaka Y, et al. SHRSP/Izm and WKY/NCrlCrlj rats having a missense mutation in abcg5 deposited plant sterols in the body, but did not change their biliary secretion and lymphatic absorption—comparison with jcl:wistar and WKY/Izm rats. Biosci. Biotechnol. Biochem. 2012;76:660–664. 10.1271/bbb.110667
- Ikeda I, Nakagiri H, Sugano M, et al. Mechanisms of phytosterolemia in stroke-prone spontaneously hypertensive and WKY rats. Metabolism. 2001;50:1361–1368. 10.1053/meta.2001.26739
- Yamori Y, Iritani N, Nara Y, Fukuda E, Mitani F. Cholesterol metabolism in spontaneously hypertensive rats. Jpn. Heart J. 1978;19:665–666. 10.1536/ihj.19.665
- Iritani N, Nara Y, Yamori Y. Cholesterol and bile acid metabolism in hypertensive arteriolipidosis-prone rats (ALR). Jpn. Circ. J. 1982;46:151–155. 10.1253/jcj.46.151
- Iritani N, Fukuda E, Nara Y, et al. Lipid metabolism in spontaneously hypertensive rats (SHR). Atherosclerosis. 1977;28:217–222. 10.1016/0021-9150(77)90171-X
- Yamori Y, Kitamura Y, Nara Y, Iritani N. Mechanism of hypercholesterolemia in arteriolipidosis-prone rats (ALR). Jpn. Circ. J. 1981;45:1068–1073. 10.1253/jcj.45.1068
- Sawamura M, Nara Y, Yamori Y. Liver mevalonate 5-pyrophosphate decarboxylase is responsible for reduced serum cholesterol in stroke-prone spontaneously hypertensive rat. J. Biol. Chem. 1992;267:6051–6055.
- Michihara A, Sawamura M, Nara Y, Ikeda K, Yamori Y. Lower mevalonate pyrophosphate decarboxylase activity is caused by the reduced amount of enzyme in stroke-prone spontaneously hypertensive rat. J. Biochem. 1998;124:40–44. 10.1093/oxfordjournals.jbchem.a022094
- Michihara A, Shimatani M, Akasaki K. Comparison of the gene expression levels of mevalonate pyrophosphate decarboxylase between stroke-prone spontaneously hypertensive and wistar kyoto rats. J. Health Sci. 2010;56:733–737. 10.1248/jhs.56.733
- Lu J, Getz G, Miska EA, et al. MicroRNA expression profiles classify human cancers. Nature. 2005;435:834–838. 10.1038/nature03702
- O’Donnell KA, Wentzel EA, Zeller KI, Dang CV, Mendell JT. c-Myc-regulated microRNAs modulate E2F1 expression. Nature. 2005;435:839–843. 10.1038/nature03677
- Najafi-Shoushtari SH, Kristo F, Li Y, et al. MicroRNA-33 and the SREBP host genes cooperate to control cholesterol homeostasis. Science. 2010;328:1566–1569. 10.1126/science.1189123
- Michihara A, Sawamura M, Yamori Y, Akasaki K, Tsuji H. Mevalonate pyrophosphate decarboxylase is predominantly located in the cytosol of rat hepatocytes. Biol. Pharm. Bull. 2001;24:1235–1240. 10.1248/bpb.24.1235
- Laemmli UK. Cleavage of structural proteins during the assembly of the head of bacteriophage T4. Nature (London). 1970;227:680–685. 10.1038/227680a0
- Towbin H, Staehelin T, Gordon J. Electrophoretic transfer of proteins from polyacrylamide gels to nitrocellulose sheets: procedure and some applications. Proc. Natl. Acad. Sci. U.S.A. 1979;76:4350–4354. 10.1073/pnas.76.9.4350
- Michihara A, Sawamura M, Nara Y, et al. Purification and characterization of two mevalonate pyrophosphate decarboxylases from rat liver: a novel molecular species of 37 kDa. J. Biochem.1997;122:647–654. 10.1093/oxfordjournals.jbchem.a021802
- Kaufmann P, Pfefferkorn A, Teuber M, et al. Identification and quantification of Bifidobacterium species isolated from food with genus-specific 16S rRNA-targeted probes by colony hybridization and PCR. Appl. Environ. Microbiol. 1997;63:1268–1273.
- Lowry OH, Rosebrough NJ, Farr AL, et al. Protein measurement with the Folin phenol reagent. J. Biol. Chem. 1951;193:265–275.
- Xie YF, Shu R, Jiang SY, Liu DL, Zhang XL. Comparison of microRNA profiles of human periodontal diseased and healthy gingival tissues. Int. J. Oral. Sci. 2011;3:125–134. 10.4248/IJOS11046
- Lv G, Shao S, Dong H, Bian X, Yang X, Dong S. MicroRNA-214 protects cardiac myocytes against H2O2 -induced injury. J. Cell Biochem. 2014;115:93–101. 10.1002/jcb.v115.1
- Michihara A, Sawamura M, Yamori Y, Akasaki K, Tsuji H. Mevalonate pyrophosphate decarboxylase in stroke-prone spontaneously hypertensive rat is reduced from the age of two weeks. Biol. Pharm. Bull. 2001;24:1417–1419. 10.1248/bpb.24.1417
- Li LM, Hou DX, Guo YL, et al. Role of microRNA-214-targeting phosphatase and tensin homolog in advanced glycation end product-induced apoptosis delay in monocytes. J. Immunol. 2011;186:2552–2560. 10.4049/jimmunol.1001633
- Kato N, Tamada T, Nabika T, et al. Identification of quantitative trait loci for serum cholesterol levels in stroke-prone spontaneously hypertensive rats. Arterioscler. Thromb Vasc Biol. 2000;20:223–229. 10.1161/01.ATV.20.1.223
- van Balkom BW, de Jong OG, Smits M, et al. Endothelial cells require miR-214 to secrete exosomes that suppress senescence and induce angiogenesis in human and mouse endothelial cells. Blood. 2013;121:3997–4006. 10.1182/blood-2013-02-478925
- Fang DY, King HW, Li JY, et al. Exosomes and the kidney: Blaming the messenger. Nephrology (Carlton). 2013;18:1–10. 10.1111/nep.2013.18.issue-1
- Wang X, Chen J, Li F, et al. MiR-214 inhibits cell growth in hepatocellular carcinoma through suppression of β-catenin. Biochem. Biophys. Res. Commun. 2012;428:525–531. 10.1016/j.bbrc.2012.10.039
- Klein S, Klösel J, Schierwagen R, et al. Atorvastatin inhibits proliferation and apoptosis, but induces senescence in hepatic myofibroblasts and thereby attenuates hepatic fibrosis in rats. Lab. Invest. 2012;92:1440–1450. 10.1038/labinvest.2012.106