
Abstract
B-group vitamins are involved in the catabolism of 2-oxo acids. To identify the functional biomarkers of B-group vitamins, we developed a high-performance liquid chromatographic method for profiling 2-oxo acids in urine and applied this method to urine samples from rats deficient in vitamins B1 and B6 and pantothenic acid. 2-Oxo acids were reacted with 1,2-diamino-4,5-methylenebenzene to produce fluorescent derivatives, which were then separated using a TSKgel ODS-80Ts column with 30 mmol/L of KH2PO4 (pH 3.0):acetonitrile (7:3) at a flow rate of 1.0 mL/min. Vitamin B1 deficiency increased urinary levels of all 2-oxo acids, while vitamin B6 deficiency only increased levels of sum of 2-oxaloacetic acid and pyruvic acid, and pantothenic acid deficiency only increased levels of 2-oxoisovaleric acid. Profiles of 2-oxo acids in urine samples might be a non-invasive way of clarifying the functional biomarker of B-group vitamins.
Graphical abstract
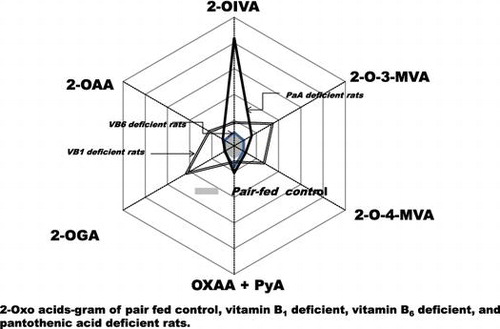
2-Oxo acids-gram of pair-fed control, vitamin B1-deficient, vitamin B6-deficient, and pantothenic acid-deficient rats.
Members of the B-group vitamin family function as coenzymes in a number of enzyme reactions. Evaluation of nutritional status for an individual’s vitamin using biomarkers is therefore important for maintenance of good health. We previously reported that the urinary excretion of B-group vitamins, except for B12, reflects vitamin intakeCitation1–7) and proposed reference values for evaluating the nutritional status of water-soluble vitamins in humans.Citation6) However, while nutritional assessment via the measurement of urinary excretion levels of B-group vitamins is an effective technique that can encourage transformation of habitual dietary intake, a limitation is that this method does not evaluate the physiological functions of the biomarkers expressed by vitamins.
B-group vitamins are involved in the catabolism of amino acids. For example, a loading test of tryptophan has been established to evaluate the nutritional status of vitamin B6,Citation8) with urinary excretion of the catabolite of tryptophan (xanthurenic acid) measured. To evaluate the nutritional statuses of vitamins B1Citation9,10) and B2,Citation10–12) the enzyme activity of erythrocyte transketolase and glutathione peroxidase are measured, respectively. To evaluate the nutritional status of vitamin B12, the measurement of urinary excretion of methylmalonic acid has been proposed,Citation13) as methylmalonyl-CoA is a vitamin B12-dependent enzyme involved in the degradation of valine and isoleucine. To evaluate the nutritional status of biotin, the measurement of urinary excretion of 3-hydroxyisovaleric acid has been proposed,Citation14) as 3-methylcrotonyl-CoA decarboxylase is a biotin-dependent enzyme involved in the degradation of leucine. To evaluate the nutritional status of folate, the measurement of urinary excretion of N-formylglutamic acid has been proposed,Citation15) as formiminoglutamase is a folate-dependent enzyme involved in histidine degradation. However, practicality as well as time and cost restraints limit application of such measurements in a clinical environment. Tests to evaluate the physiological functions of B-group vitamins typically measure the urinary excretion of amino acids catabolites.
The initial degradation of amino acids involves deamination catalyzed by the pyridoxal 5′-phosphate (PLP)-dependent enzyme transaminase and the pyridine nucleotide coenzymes-dependent enzyme dehydrogenase to form 2-oxo acids. These 2-oxo acids are generally catabolized to form acyl-CoA by a multi-enzyme system dehydrogenase complex that requires multiple B-group vitamins such as thiamin diphosphate (TDP), NAD+, CoA, and FAD, with additional B-group vitamins required for further catabolism (Supplemental Fig. 1).
Nakamura et al.Citation16) reported a chemical derivatization method for 2-oxo acids with 1,2-diamino-4,5-methylenedioxybenzene (DMB). However, they did not describe the reaction between 2-oxoadipic acid (2-OAA, a catabolite of tryptophan and lysine) and DMB in detail. We previously reported the generation of a fluorescent compound on reaction of 2-OAA with DMB and development of a method for separating urine samples based on this reaction using high-performance liquid chromatography (HPLC).Citation17)
Here, we describe a new HPLC assay with pre-chemical derivatization for measuring urinary levels of 2-oxo acids such as 2-oxoisovaleric acid (2-OIVA, a catabolite of valine), 2-oxo-3-methylvaleric acid (2-O-3-MVA, a catabolite of isoleucine), and 2-oxo-4-methylvaleric acid (2-O-4-MVA, a catabolite of leucine). This method of measuring levels of 2-oxo acids was subsequently used to evaluate the profiles of 2-oxo acids in urine samples from rats with potential application in evaluating nutritional status of B-group vitamins in future studies.
Materials and methods
Chemicals
2-Oxoglutaric acid (2-OGA, molecular weight [MW] = 146.1), oxaloacetic acid (OXAA, MW = 132.1), 2-OIVA (MW = 138.1), pyruvic acid (PyA, MW = 88.1), 2-mercaptoethanol, and sodium hydrosulfite were purchased from Wako Pure Chemical Industries (Osaka, Japan). 2-O-3-MVA (MW = 130.1), 2-O-4-MVA (MW = 130.1), and 2-OAA (MW = 160.1) were purchased from Sigma-Aldrich Chemicals (St. Louis, MO, USA). DMB was purchased from Dojinkagaku Laboratories (Kumamoto, Japan). Thiamin hydrochloride (C12H17ClN4OS-HCl, MW = 337.27) and calcium pantothenate (C18H32N2O10-Ca, MW = 476.54) were purchased from Wako Pure Chemical Industries. 4-Pyridoxic acid (4-PIC) (C8H9NO4, MW = 183.16) was synthesized by ICN Pharmaceuticals (Costa Mesa, CA, USA) and obtained via Wako Pure Chemical Industries. Casein from vitamin-free milk, sucrose, l-methionine, gelatinized cornstarch, and sucrose were purchased from Wako Pure Chemical Industries. Corn oil was obtained from Ajinomoto (Tokyo, Japan). A mineral mixture (AIN-93-G-MX)Citation18) and vitamin mixture (AIN-93-VX)Citation18) were purchased from Oriental Yeast Kogyo (Tokyo, Japan). All other chemicals were of the highest purity available from commercial sources.
Derivatization of 2-oxo acids with DMB
2-Oxo acids were derivatized following the method of Nakamura et al.Citation16) The DMB solution was prepared by mixing the following in sequence: 8.7 mL of H2O, 0.049 g of sodium hydrosulfite, 0.7 mL of 2-mercaptoethanol, 0.58 mL of concentrated HCl, and 0.016 g of DMB. The DMB solution was stable for 1 month when stored at 4 °C. The 2-mercaptoethanol and sodium hydrosulfite were added to stabilize the DMB during the reaction.
The reaction between 2-oxo acids and DMB is shown in Supplemental Fig. 2. A total of 0.1 mL of the DMB solution was added to 0.1 mL of each 2-oxo acid solution or to a urine sample diluted to a suitable concentration in a microtube with a sealed cap. The reaction was conducted by immersing the microtube in a bath of boiling water for 45 min, after which the microtube was cooled in ice water for at least 5 min. The resulting reaction mixture was filtered through a 0.45-µm filter equipped with hydrophilic Durapore™ (PVDF) (Millipore, Bedford, MA, USA), and the filtrate (5 µL) was then injected directly into the HPLC system.
Chromatographic analysis of 2-OIVA, 2-O-4-MVA, and 2-O-3-MVA
We previously reported the successful separation of the fluorescent product of 2-OAA in urine samplesCitation2) but were unable to analyze the fluorescent products of 2-OIVA, 2-O-4-MVA, and 2-O-3-MVA. The fluorescent product of each 2-oxo acid in each urine sample was therefore separated using a TSKgel ODS-80Ts column (average particle diameter: 5 µm, 4.6 i.d. × 250 mm) (Tosoh, Tokyo, Japan). The mobile phase consisted of 30 mmol/L KH2PO4-H3PO4 (pH 3.0):acetonitrile (7:3, v/v). A flow rate of 1.0 mL/min was used, and the column temperature was maintained at 40 °C. Fluorescence detection was performed using an excitation wavelength of 367 nm and an emission wavelength of 446 nm.
Standard preparation
Stock solutions of each 2-oxo acid were prepared at a concentration of 100 µmol/L in water and stored at −20 °C. Each working standard solution was diluted from the stock solution to produce a series of concentrations (8, 12, 28, 56, 84, 112, and 140 nmol/L). A total of 0.1 mL of each concentration was then reacted with 0.1 mL of the DMB solution, and 5 µL of the reacted mixture containing 0.02, 0.03, 0.07, 0.14, 0.21, 0.28, or 0.35 pmol of the fluorescent compound was injected into the HPLC system. Quality control (QC) samples were prepared by spiking the standard solution into a pooled urine sample from three rats.
Assay validation
Within-run precision was calculated by analyzing five replicates of the QC urine sample on the same day. Between-run precision was determined by triplicate analysis of the QC urine sample on three separate occasions, and the value of each was calculated by analyzing five replicates. The coefficient of variation (CV) was calculated to evaluate the precision, as follows:
Within-run accuracy was measured in different experiments to calculate the precision and was evaluated in the same experiments to calculate the percentages of recovery. Accuracy was expressed as relative error (RE) and calculated using the following equation:
Recovery was calculated using the following formula:
Two additional concentrations (0.4 and 1.2 µmol/L of 2-oxo acid, containing 0.5 and 1.5 nmol/0.05 mL of standard 2-oxo acid) were added to a 0.05-mL urine sample and then reacted with 0.1 mL of the DMB solution. Analyses were performed in triplicate.
Stability of fluorescent compounds of standard 2-oxo acids
The stability of the fluorescent compound of each standard 2-oxo acid was evaluated by comparing the peak area on the HPLC chromatogram when the sample containing the fresh fluorescence compound was injected and when the sample exposed to light at room temperature for 24 h was injected.
Stability of 2-oxo acids in urine
Short-term stability was examined by storing QC urine samples at room temperature for 24 h, mid-term stability by storing QC urine samples at 4 °C for 7 days, and long-term stability by storing samples at −20 °C for 30 days. Freeze-thaw stability of 2-oxo acids was determined over three cycles of thawing at 4 °C for 12 h and refreezing at −20 °C for 12 h. For each storage condition, five replicates were analyzed in each batch. The concentration of 2-oxo acids after each storage period was related to the initial concentration determined for the sample, which was freshly prepared and immediately processed. The range of change in concentration was calculated using the following formula:
Analyses of 2-OAA, 2-OGA, OXAA, and PyA
2-Oxo acids such as 2-OAA, 2-OGA, OXAA, and PyA were reacted with DMB in an acidic solution to produce fluorescent derivatives. Reaction products were separated using a TSKgel ODS 80Ts column (average particle diameter: 5 µm, 4.6 i.d. × 250 mm) with 20 mmol/L KH2PO4–K2HPO4 buffer (pH 7.0):methanol (7:3, v/v) at a flow rate 0.8 mL/min.Citation17) Fluorescence detection was performed using an excitation wavelength of 267 nm and an emission wavelength of 446 nm. Under these conditions, the fluorescent compounds were eluted at the following times: 2-OGA, 8 min; 2-OAA, 11 min; OXAA, 26 min; and PyA, 26 min (Supplemental Fig. 3). OXAA and PyA were not separated under these conditions and were expressed as a sum value. 2-OIVA, 2-O-3-MVA, and 2-O-4-MVA were not eluted under the conditions used.
Animals and diets
Ethical approval of study protocol
The care and treatment of laboratory animals conformed to the guidelines set by the University of Shiga Prefecture (Shiga, Japan).
Vitamin-deficient rats
Male Wistar rats were obtained from CLEA Japan (Tokyo, Japan), and each rat was housed individually in a metabolic cage CT-10 (CLEA Japan). The animal room was maintained at approximately 22 °C with a humidity of approximately 60% and a 12/12 h light–dark cycle (lights on, 06:00–18:00). Rats initially had free access to a nutritionally complete diet (Supplemental Table 1) for 7 days to acclimatize to the environment. After acclimatization, rats were then divided into the following groups (n = 5 per group): “Ad libitum control,” fed a nutritionally complete diet ad libitum (n = 5) (Supplemental Table 1); “Pair-fed control,” fed the complete diet, but the daily quantity of food was equal to that of the vitamin-deficient group (n = 5); and “Vitamin-deficient,” fed the complete diet with only vitamin B1, vitamin B6, or pantothenic acid (PaA) removed ad libitum (n = 5) (vitamin B1-, vitamin B6-, or PaA-deficient diet; Supplemental Table 1).
Body weight and food intake were measured daily at approximately 09:00, and food and water were renewed at that point. Twenty-four-hour urine samples (09:00–09:00) were periodically collected in amber bottles containing 1 mL of 1 mol/L HCl and then stored at −25 °C until use.
In the vitamin B1-deficient experiment, 8-week-old rats were evaluated for 14 days. Twenty-four-hour urine samples were collected on Days 0, 3, 6, 9, 12, and 14. The quantity of vitamin B1 excreted in urine was measured on Days 0, 3, 6, 9, 12, and 14. Quantities of 2-oxo acids excreted into urine were measured on Day 14.
In the vitamin B6-deficient experiment, 5-week-old rats were evaluated for 21 days. Twenty-four-hour urine samples were collected on Days 3, 6, 9, 12, 15, 19, 20, and 21. Quantities of vitamin B6 excreted into urine were measured on Days 3, 6, 9, 12, 15, 19, 20, and 21. Quantities of 2-oxo acids excreted into urine were measured on Day 21.
In the PaA-deficient experiment, 4-week-old rats were evaluated for 34 days. Twenty-four-hour urine samples were collected on Days 7, 14, 21, 32, 33, and 34. Quantities of PaA excreted into urine were measured on Days 7, 14, 21, 32, 33, and 34. Quantities of 2-oxo acids excreted into urine were measured on Day 34.
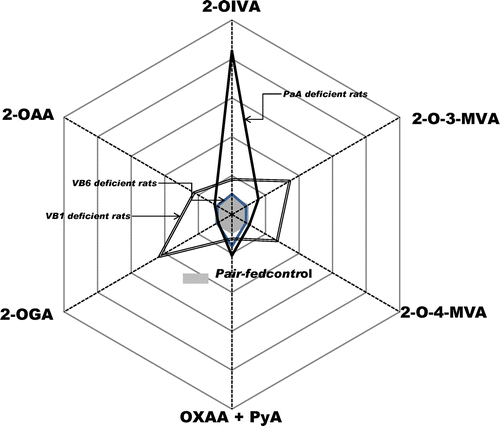
2-Oxo acids-gram
To construct the 2-oxo acids-gram, the relative ratios of respective 2-oxo acids against the pair-fed control compared to rats deficient in vitamin B1, vitamin B6, and PaA were calculated.
Assays for vitamin B1, vitamin B2, 4-PIC, and PaA in urine
The concentrations of free thiamin (vitamin B1),Citation19) the catabolite of vitamin B6 4-PIC,Citation20) and free PaA in urine samplesCitation21) were measured as previously described.
Statistical analysis
Statistical significance was determined using Student’s t-test. p < 0.05 was considered statistically significant. All statistical analyses were performed using GraphPad Prism version 5.0 (GraphPad Software, San Diego, CA, USA).
Results
Stability of fluorescent compound with standard 2-oxo acids
In the final mixture, the fluorescent compound was stable for at least 24 h exposed to light at room temperature.
Linearity of calibration curve and limits of quantification
The linearity of the calibration curve was determined by plotting the peak areas (y-axis) of the fluorescent compound against the standard 2-oxo acid concentrations (x-axis). The correlation coefficient was more than 0.99, which confirmed that calibration curves were linear over the concentration range of 0.02–0.35 pmol per injection of the 2-oxo acid standards (Supplemental Fig. 4). The limit of detection was 0.02 pmol per injection at a signal-to-noise ratio of 5:1. The limit of quantification was 0.07 pmol per injection, which was sufficient to determine of the concentrations of 2-oxo acids in rat urine samples.
Accuracy and precision
The CVs of the within-run precision for each 2-oxo acid were as follows: 2-OIVA, 3.89%; 2-O-3-MVA, 2.46%; and 2-O-4-MVA, 2.89%. The CVs of between-run precision for each 2-oxo acid were as follows: 2-OIVA, 2.00%; 2-O-3-MVA, 2.60%; and 2-O-4-MVA 1.78%. The accuracy for measuring 2-OIVA as shown by RE at a concentration of 0.500 pmol per 5 µL of sample was −4.7%, and at 1.500 pmol per 5 µL of sample, it was −3.8%. The accuracy for 2-O-3-MVA as shown by RE at a concentration of 0.500 pmol per 5 µL of sample was −2.4% and at 1.500 pmol per 5 µL of sample, it was −4.9%. The accuracy for 2-O-4-MVA as shown by RE at a concentration of 0.500 pmol per 5 µL of sample was −2.0% and at 1.500 pmol per 5 µL of sample, it was 2.2%. These data indicate that the assay was reproducible, accurate, and reliable.
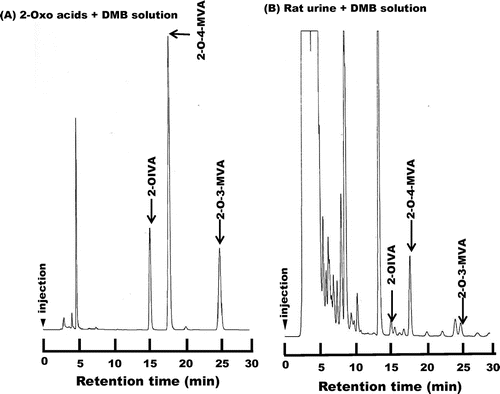
A typical chromatogram of the reference 2-OIVA, 2-O-4-MVA, and 2-O-3-MVA derivatives are shown in Fig. (A). The derivatives were eluted at the following time points: 2-OIVA, 15 min; 2-O-4-MVA, 18 min; and 2-O-3-MVA, 25 min.
Fig. 1. Chromatogram of standard 2-OIVA, 2-O-3-MVA, and 2-O-4-MVA derivatives.
Recovery
As in the “Stability of the fluorescent compounds of standard 2-oxo acids in Assay validation” section, 0.5 or 1.5 nmol/0.05 mL of standard 2-OIVA, 2-O-3-MVA, and 2-O-4-MVA were added to urine samples, and the mixture was derivatized to the fluorescent compound. For both of these 2-oxo acids, more than 95% was recovered.
Stability of 2-oxo acids in urine samples
As in the “Stability of 2-oxo acids in urine in Assay validation” section, compared to fresh urine (100%), the change in stability of 2-OIVA, for each cycle, was as follows: short-term, 2%; long-term, −3%; and freeze-thaw, −2%. For those of 2-O-3-MVA and 2-O-4-MVA, similar values were obtained. Under all conditions, 2-OIVA, 2-O-3-MVA, and 2-O-4-MVA were stable in urine.
Application of HPLC method
A representative chromatogram of a derivatized rat urine sample is shown in Fig. (B). The 2-OIVA, 2-O-3-MVA, and 2-O-4-MVA derivatives in the sample were characterized on the basis of retention time and the entire excitation and emission spectra between 320 and 500 nm.
Vitamin B1-deficient rats
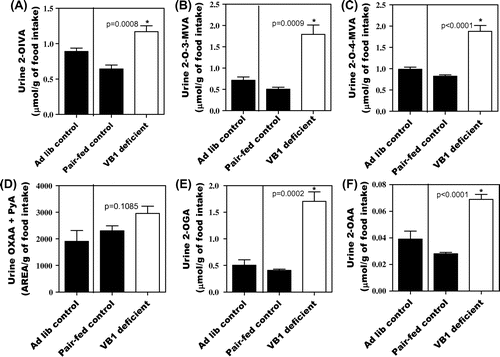
Fig. shows a comparison of the quantity of 2-oxo acids excreted into urine between the ad libitum control, pair-fed control, and vitamin B1-deficient groups. On Day 14, food intake was slightly lower in the vitamin B1-deficient group than in the ad libitum control group (Supplemental Fig. 5). Urinary excretion of vitamin B1 was close to 0 on Day 14 (Supplemental Fig. 6(A)). Mild vitamin B1 deficiency in the group fed the vitamin B1-deficient diet was thus confirmed. On Day 14, levels of all 2-oxo acids were higher in the group fed the vitamin B1-deficient diet than in the pair-fed control group.
Fig. 2. Urinary excretion of 2-OIVA (A), 2-O-3-MVA (B), 2-O-4-MVA (C), OXAA + PyA (D), 2-OGA (E), and 2-OAA (F) affected by vitamin B1 deficiency in rats. Values are mean ± SE for five rats.
Vitamin B6-deficient rats
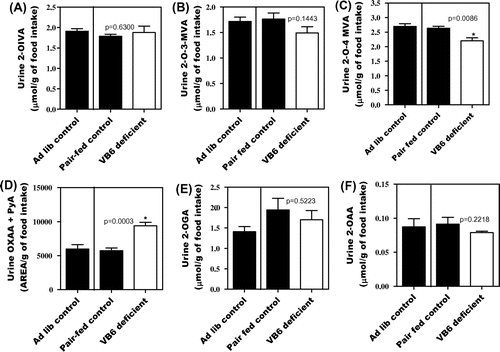
Fig. shows a comparison of the quantity of 2-oxo acids excreted into urine between the ad libitum control, pair-fed control, and vitamin B6-deficient groups. Food intake during the experiment was slightly lower in the vitamin B6-deficient group than in the ad libitum control group (Supplemental Fig. 7). Urinary excretion of 4-PIC, a metabolite of vitamin B6, was extremely low in the vitamin B6-deficient group compared to the pair-fed control rats on Day 21 (Supplemental Fig. 6(B)). Mild vitamin B6 deficiency in the group fed the vitamin B6-deficient diet was thus confirmed. On Day 21, only level of sum of OXAA + PyA was higher in the group fed the vitamin B6-deficient diet than in the pair-fed control group.
Fig. 3. Urinary excretion of 2-OIVA (A), 2-O-3-MVA (B), 2-O-4-MVA (C), OXAA + PyA (D), 2-OGA (E), and 2-OAA (F) affected by vitamin B6 deficiency in rats. Values are mean ± SE for five rats.
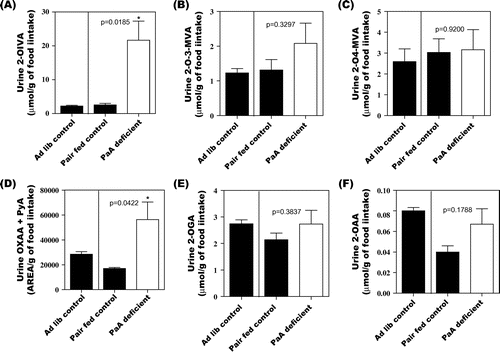
PaA-deficient rats
Fig. shows a comparison of the quantity of 2-oxo acids excreted into urine between the ad libitum control, pair-fed control, and PaA-deficient groups. On Day 34, food intake was lower in the PaA-deficient group than in the ad libitum control group (Supplemental Fig. 8). Urinary excretion of PaA was close to 0 on Day 34 (Supplemental Figure 6(C)). PaA deficiency in the group fed the PaA-deficient diet was thus confirmed. On Day 34, levels of 2-OIVA, 2-O-3-MVA, sum of OXAA + PyA, and 2-OAA were higher in the group fed the PaA-deficient diet than in the pair-fed control group.
Fig. 4. Urinary excretion of 2-OIVA (A), 2-O-3-MVA (B), 2-O-4-MVA (C), OXAA + PyA (D), 2-OGA (E), and 2-OAA (F) affected by PaA deficiency in rats. Values are mean ± SE for five rats.
2-Oxo acids-gram in rat urine
A urine 2-oxo acids-gram on normal nutritional status and vitamin-deficient status is shown in Fig. . Vitamin B1 deficiency induced an increase in urinary excretion of all 2-oxo acids measured. Vitamin B6 deficiency induced an increase in urinary excretion of sum of OXAA + PyA, but not of any other 2-oxo acids. PaA deficiency induced a marked increase in urinary excretion of 2-OIVA.
Fig. 5. 2-Oxo acids-gram of pair-fed control, vitamin B1-deficient, vitamin B6-deficient, and PaA-deficient rats.
Discussion
Our HPLC method showed that vitamin B1 deficiency increased the urinary levels of all 2-oxo acids. In addition, vitamin B6 deficiency increased urinary level of sum of 2-OXAA + PyA, but not of other 2-oxo acids. PaA deficiency increased urinary levels of 2-OIVA levels. Profiles of 2-oxo acid in urine samples might therefore help facilitate the evaluation of vitamin and nutritional status.
2-Oxo acids are common metabolites of amino acids that produce CO2 and H2O on reaction with various enzymes. We therefore investigated the utility of 2-oxo acid formation as a functional biomarker for evaluating the nutritional statuses of B-group vitamins. Although methods of measuring 2-oxo acid levels in urine samples have been previously reported,Citation16,22–26) these methods are not practical or convenient. In this study, we first developed a practical and straightforward technique for separating various 2-oxo acids pretreated with DMB using HPLC. 2-Oxo acids, including PyA, OXAA, 2-OGA, 2-OAA, 2-OIVA, 2-O-3-MVA, and 2-O-4-MVA, in urine samples were reacted with DMB and then injected into the same HPLC system. However, the mobile phases used different solvents. For separation of PyA, OXAA, and 2-OAA, a mixture of 20 mmol/L KH2PO4-K2HPO4 buffer (pH 7.0):methanol (7:3, v/v) was used at a flow rate of 0.8 mL/min. To separate 2-OIVA, 2-O-3-MVA, and 2-O-4-MVA in the samples, a mixture of 30 mmol/L KH2PO4 (pH adjusted to 3.0 by addition of H3PO4):methanol (7:3, v/v) was used with a flow rate of 1.0 mL/min. However, this technique could not separate the fluorescent derivatives of PyA and OXAA, which represents a potential problem.
We applied our HPLC method to urine samples obtained from vitamin B1-, vitamin B6-, and PaA-deficient rats. To compare the effects of the vitamin deficiencies, a urine 2-oxo acid-gram was constructed. Vitamin B1 is involved in the transformation of 2-oxo acids to acyl-CoA; a vitamin B1 deficiency is therefore likely to increase the quantity of 2-oxo acids excreted in urine. The present profile confirmed an increase in the urinary excretion of all 2-oxo acids examined. Vitamin B6 deficiency increased the urinary excretion of sum of PyA + OXAA compared to pair-fed control rats. Vitamin B6 is involved in the transamination of amino acids and 2-oxo acids to a new amino acid and a new 2-oxo acid. We therefore predicted that a vitamin B6 deficiency would result in reduced urinary excretion of 2-oxo acids. The results of this study, however, were contrary to our expectations. Of note, another deamination reaction of amino acids involves oxidation via NAD+. The major deamination reaction for the degradation of amino acids might therefore involve oxidation, rather than transamination. PaA is also involved in the transformation of 2-oxo acids to acyl-CoA; a PaA deficiency is thus expected to increase the quantity of 2-oxo acids excreted in urine. In this study, PaA deficiency resulted in a large increase in urinary excretion of 2-OIVA, which is a catabolite of valine. 2-OIVA, 2-O-3-MVA, and 2-O-4-MVA are collectively termed branched-chain 2-oxo acids and are metabolized to acyl-CoA by the same branched-chain 2-oxo acid dehydrogenase.Citation27) Higher urinary excretion of 2-OIVA suggests that the substrate specificity of 2-OIVA might be lower than that of 2-O-3-MVA and 2-O-4-MVA.
Characterizing the mechanism by which 2-oxo acid levels in urine vary depending on the type of vitamin deficiency is important. The increase in levels of all 2-oxo acids under vitamin B1-deficient conditions may have been due to 2-oxo acid dehydrogenase requiring TDP as a coenzyme. However, if that were the case, a PaA deficiency should also increase levels of all 2-oxo acids, with profiles resembling those induced by a vitamin B1 deficiency, as both vitamin B1 and PaA are involved in transformation to acyl-CoA. Instead, the 2-oxo acid profile produced by a PaA deficiency was clearly distinct from that produced by vitamin B1 deficiency, with levels of the catabolite of valine urine 2-OIVA markedly increased. Vitamin B6 has a major role as a coenzyme of the transaminase reaction of amino acids. Although 2-OGA also plays a major role in this reaction, vitamin B6 deficiency did not affect levels of 2-OGA in urine. OXAA and PyA are associated with leading roles in the transamination reaction. As these could not be measured separately, the sum of OXAA and PyA is presented. This value was slightly higher in rats deficient in vitamin B6 than in pair-fed controls.
We assessed the utility of 2-oxo acid profiles in urine in evaluating the effects of deficiency of multiple B-group vitamins. Our technique enabled the rapid and straightforward measurement of 2-oxo acids in urine. In addition to providing insights into the regulation of individual 2-oxo acids following vitamin deficiency, the data obtained here and in future studies might prove a valuable reference for the diagnosis and treatment of conditions associated with altered amino acid metabolism.
In conclusion, we characterized the profiles of 2-oxo acids in urine for future reference. These profiles of 2-oxo acids in urine might be useful in evaluating vitamin and nutritional status.
Author contributions
K.S. designed the study. C.N. conducted the experiments. K.S. drafted the manuscript. T.F. provided critical comments to the manuscript. All authors read and approved the final manuscript.
Disclosure statement
No potential conflict of interest was reported by the authors.
Supplemental material
The supplemental material for this paper is available at http://dx.doi.org/10.1080/09168451.2015.1083395.
Funding
This investigation was part of the project “Studies on the nutritional evaluation of amino acids and B-group vitamins” (principal investigator, Katsumi Shibata), which was supported by a Research Grant from Grants-in-Aid for Scientific Research from Japan Society for the Promotion of Science [grant number 24300258].
6-27_Supplement_material_2-Oxo_acids.docx
Download MS Word (748.5 KB)References
- Fukuwatari T, Shibata K. Urinary water-soluble vitamins and their metabolite contents as nutritional markers for evaluating vitamin intakes in young Japanese women. J. Nutr. Sci. Vitaminol. 2008;54:223–229.10.3177/jnsv.54.223
- Fukuwatari T, Sugimoto E, Tsuji T, et al. Urinary excretion of vitamin B12 depends on urine volume in Japanese female university students and elderly. Nutr. Res. 2009;29:839–845.10.1016/j.nutres.2009.10.008
- Tsuji T, Fukuwatari T, Sasaki S, et al. Urinary excretion of vitamin B1, B2, B6, niacin, pantothenic acid, folate, and vitamin C correlates with dietary intakes of free-living elderly, female Japanese. Nutr. Res. 2010;30:171–178.10.1016/j.nutres.2010.02.001
- Tsuji T, Fukuwatari T, Sasaki S, et al. Twenty-four-hour urinary water-soluble vitamin levels correlate with their intakes in free-living Japanese university students. Eur. J. Clin. Nutr. 2010;64:800–807.10.1038/ejcn.2010.72
- Tsuji T, Fukuwatari T, Sasaki S, et al. Twenty-four-hour urinary water-soluble vitamin levels correlate with their intakes in free-living Japanese school children. Pub. Health Nutr. 2011;14:1691–1693.
- Shibata K, Fukuwatari T. Values for evaluating the nutritional status of water-soluble vitamins in humans. J. Integr. OMICS. 2013;3:51–59.
- Shibata K, Hirose J, Fukuwatari T. Relationship between urinary concentrations of nine water-soluble vitamins and their vitamin intakes in Japanese adult males. Nutr. Metab. Insight. 2014;7:61–75.10.4137/NMI
- Yeh JK, Brown RR. Effects of vitamin B-6 deficiency and tryptophan loading on urinary excretion of tryptophan metabolites in mammals. J. Nutr. 1977;107:261–271.
- Heller S, Salkeld RM, Körner WF. Vitamin B1 status in pregnancy. Am. J. Clin. Nutr. 1974;27:1221–1224.
- Thurnham DI. Red cell enzyme tests of vitamin status: do marginal deficiencies have any physiological significance? Proc. Nutr. Soc. 1981;40:155–163.10.1079/PNS19810024
- Böni H, Wassmer A, Brubacher G, et al. Assessment of the vitamin B2 status by means of the glutathione reductase test. Nutr. Metab. 1977;21:20–21.
- Heller S, Salkeld RM, Körner WF. Riboflavin status in pregnancy. Am. J. Clin. Nutr. 197; 27:1225–1230.
- Barness LA. Vitamin B12 deficiency with emphasis on methylmalonic acid as a diagnostic aid. Am. J. Clin. Nutr. 1967;20:573–582.
- Mock NI, Malik MI, Stumbo PJ, et al. Increased urinary excretion of 3-hydroxyisovaleric acid and decreased urinary excretion of biotin are sensitive early indicators of decreased biotin status in experimental biotin deficiency. Am. J. Clin. Nutr. 1997;65:951–958.
- Chanarin I. Studies on urinary formiminoglutamic acid excretion. Proc. R. Soc. Med. 1964;57:384–388.
- Nakamura M, Hara S, Yamaguchi M, et al. 1,2-Diamino-4,5-methylenedioxybenzene as a highly sensitive fluorogenic reagent for α-keto acids. Chem. Pharm. Bull. 1987;35:687–692.10.1248/cpb.35.687
- Shibata K, Yasui M, Sano M, et al. Fluorometric determination of 2-oxoadipic acid, a common metabolite of tryptophan and lysine, by high-performance liquid chromatography with pre-chemical derivatization. Biosci. Biotechnol. Biochem. 2011;75:185–187.10.1271/bbb.100723
- Reeves PG. Components of the AIN-93 diets as improvements in the AIN-76A diet. J. Nutr. 1997;127:838S–841S.
- Iwata H, Matsuda T, Tonomura H. Improved high-performance liquid chromatographic determination of thiamine and its phosphate esters in animal tissues. J. Chromtogr. 1988;450:317–323.10.1016/S0021-9673(01)83586-X
- Gregory JF 3rd, Kirk JR. Determination of urinary 4-pyridoxic acid using high performance liquid chromatography. Am. J. Clin. Nutr. 1979;32:879–883.
- Takahashi K, Fukuwatari T, Shibata K. Fluorometric determination of pantothenic acid in human urine by isocratic reversed-phase ion-pair high-performance liquid chromatography with post-column derivatization. J. Chromatogr. 2009;877:2168–2172.
- Liao JC, Hoffman NE, Barborlak JJ, et al. High-performance liquid chromatography of pyruvic and α-ketoglutaric acids and its application to urine samples. Clin. Chem. 1977;23:802–805.
- Liebich HM, Först C. Hydroxycarboxylic and oxocarboxylic acids in urine: products from branched-chain amino acid degradation and from ketogenesis. J. Chromatogr. 1984;309:225–242.10.1016/0378-4347(84)80031-6
- Hara S, Takemori Y, Iwata T, et al. Fluorimetric determination of α-keto acids with 4,5-dimethoxy-1,2-diaminobenzene and its application to high-performance liquid chromatography. Anal. Chim. Acta. 1985;172:167–173.10.1016/S0003-2670(00)82604-5
- Hara S, Yamaguchi M, Nakamura M, et al. Fluorescent products of reaction between ALPHA-keto acids and 1,2-diamino-4,5-dimethoxybenzene. Chem. Pharm. Bull. 1985;33:3493–3498.10.1248/cpb.33.3493
- Wulkan RW, Verwers R, Neele M, et al. Measurement of pyruvate in blood by high-performance liquid chromatography with fluorescence detection. Ann. Clin. Biochem. 2001;38:554–558.10.1177/000456320103800514
- Danner DJ, Lemmon SK, Besharse JC, et al. Purification and characterization of branched chain alpha-ketoacid dehydrogenase from bovine liver mitochondria. J. Biol. Chem. 1979;254:5522–5526.