
Abstract
A goose-type lysozyme from ostrich egg white (OEL) was produced by Escherichia coli expression system, and the role of His101 of OEL in the enzymatic reaction was investigated by NMR spectroscopy, thermal unfolding, and theoretical modeling of the enzymatic hydrolysis of hexa-N-acetylchitohexaose, (GlcNAc)6. Although the binding of tri-N-acetylchitotriose, (GlcNAc)3, to OEL perturbed several backbone resonances in the 1H–15N HSQC spectrum, the chemical shift of the backbone resonance of His101 was not significantly affected. However, apparent pKa values of His101 and Lys102 determined from the pH titration curves of the backbone chemical shifts were markedly shifted by (GlcNAc)3 binding. Thermal unfolding experiments and modeling study of (GlcNAc)6 hydrolysis using a His101-mutated OEL (H101A-OEL) revealed that the His101 mutation affected not only sugar residue affinities at subsites −3 and −2 but also the rate constant for bond cleavage. His101 appears to play multiple roles in the substrate binding and the catalytic reaction.
Graphical abstract
His101 of a goose-type lysozyme from ostrich egg white (OEL) appears to play multiple roles in the substrate binding and the catalytic reaction.
Lysozyme (muramidase, EC 3.2.1.17) is the key enzyme in the innate immune response to bacterial infections.Citation1) Lysozyme catalyzes the hydrolysis of β-1,4-glycosidic linkages between the N-acetylmuramic acid (MurNAc) and N-acetyl-d-glucosamine (GlcNAc) of peptidoglycans in the bacterial cell wall, leading to the lysis of bacterial cells.Citation2–4) Lysozymes are widely distributed in various living organisms, and the amino acid sequences of lysozymes have been reported in various avians,Citation5–9) mammals,Citation10) fishes,Citation11) and insects.Citation12,13) Based on the similarities in amino acid sequences, these enzymes have been classified into three major types: chicken type (C-type),Citation14–16) phage type (T4-type),Citation17,18) and goose type (G-type).Citation19–21) C-type, G-type, and T4-type lysozymes correspond to family GH-22, family GH-23, and family GH-24, respectively, according to the CAZy database.Citation22) The structures and functions of C-type and T4-type lysozymes have been examined extensively, using hen egg white lysozyme (HEL) and T4 phage lysozyme (T4L) as model enzymes, respectively. However, information on the structures and functions of G-type lysozymes is limited.
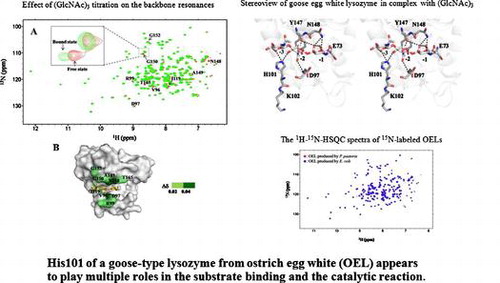
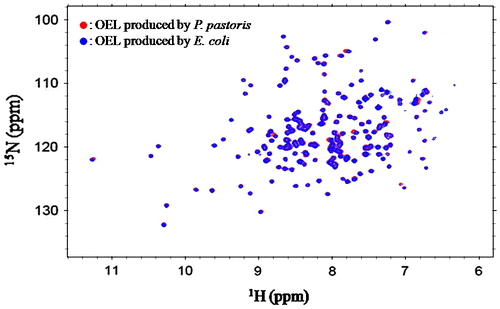
The X-ray crystal structure of goose egg white lysozyme (GEL) in complex with an N-acetylglucosamine trimer, (GlcNAc)3, was first reported by Weaver et al.Citation23) (PDB code, 154L). The refined structure revealed that the trisaccharide binds to negatively numbered subsites (−3, −2, and −1) of the six subsites from −3 to +3.Citation24) Further structural studies showed that, in the catalytic reaction, Glu73 donates a proton to the glycosidic oxygen to cleave the β-1,4-linkage and Asp97 withdraws a proton from the catalytic water molecule, which attacks the C1 carbon of the −1 sugar residue.Citation25,26) The most notable interaction between GEL and the bound (GlcNAc)3 was formed by the His101 side chain, which forms hydrogen bonds with the hydroxyl on C6 of the −3 sugar and the hydroxyl on C3 of the −2 sugar, as shown in Fig. . Analogous interactions were found in Trp63 (Trp64) of HEL (human lysozyme) belonging to the GH22 family, suggesting the importance of the His101 interaction in the substrate recognition of goose-type lysozyme. However, it currently remains unknown whether the side chain interaction of His101 occurs in solution.
Fig. 1. Stereoview of goose egg white lysozyme in complex with (GlcNAc)3 as revealed by X-ray crystallography (PDB code, 154L).
The lysozyme from ostrich egg white (OEL) is a G-type lysozyme and shares significant amino acid sequence similarity with GEL (83%).Citation27) Accordingly, the enzymatic properties of OEL were found to be similar to those of GEL.Citation28) Due to higher productivity in the expression system using Pichia pastoris,Citation28) OEL has been used as a model enzyme to study the structure and function of G-type lysozymes. Kawamura et al. investigated the role of the catalytic acid Glu73 and disulfide bonds in OEL.Citation29,30) Furthermore, OEL with a mutation at the catalytic residue (Glu73) was produced in the Pichia expression system and chitin oligosaccharide binding to the mutated OEL was examined using solution NMR spectroscopy by Shinya et al.Citation31)
In this study, stable isotope-labeled OEL was produced using the Escherichia coli expression system and applied to (GlcNAc)3 binding experiments using NMR spectroscopy. Furthermore, His101-mutated OEL (H101A-OEL) was produced and its chitin oligosaccharide binding and kinetic properties were analyzed by thermal unfolding experiments and modeling study of enzymatic hydrolysis of (GlcNAc)6, in order to evaluate the contribution of the imidazole side chain of His101 to the enzymatic reaction.
Materials and methods
Materials
The expression plasmid, pET22b, was purchased from Novagen (Madison, WI). E. coli strain Rosetta 2 was also purchased from Novagen and used for protein expression. 15N-ammonium chloride was the product of Cambridge Isotope Laboratories Inc. N-acetylglucosamine trisaccharide, (GlcNAc)3, was prepared by acid hydrolysis of chitinCitation32) followed by size-exclusion chromatography. Toyopearl CM-650 used for protein purification was from Tosoh (Tokyo). All other buffers and reagents were the highest grade commercially available.
Protein expression and purification
The wild type OEL geneCitation28) was ligated into the expression plasmid pET22b. The expression plasmid carrying the OEL gene (pET-22b-OEL) was introduced into E. coli Rosetta 2. The recombinant enzyme was produced in E. coli by IPTG induction and purified with a Toyopearl CM-650 column (1.5 × 5.5 cm). In the first step, stepwise elution was achieved with 0.05 M sodium phosphate buffer pH 7.0, containing 0.1, 0.3, and 0.5 M NaCl. Fractions exhibiting lysozyme activity were pooled and rechromatographed on the same column and then eluted with a linear gradient of NaCl from 0 to 0.5 M. Fractions with a single protein band on SDS–PAGE were dialyzed against distilled water and lyophilized for storage at 4 °C. Although the recombinant OEL (OEL) obtained had an extra N-terminal serine,Citation29) the addition of the N-terminal serine residue only had a weak effect on the secondary structure, structural stability, substrate-binding ability, and lytic activity.Citation29,30) Protein concentrations were determined by measuring absorbance at 280 nm using the molar absorption coefficient of OEL calculated from the equation proposed by Pace et al.Citation33) For 1H–15N HSQC measurements, 15N-labeled OEL was prepared by growing transformants in M9 minimal medium containing 15NH4Cl (0.5 g/L) as the sole 15N source and purified as described above. 15N-labled OEL was also prepared by the P. pastoris expression system as described previouslyCitation31) and was used for comparison.
NMR measurements
The assignment data for the backbone (1HN) resonances of wild type OEL were cited from a previous study.Citation31) NMR samples contained 0.2−0.5 mM OEL dissolved in 20 mM sodium acetate buffer pH 5.0 (90% H2O/10% D2O), and NMR experiments were conducted at 300 K using a Bruker AV500 spectrometer controlled with TopSpin 3.0 software and equipped with a triple-resonance pulsed-field gradient cryoprobe head. All NMR spectra were analyzed using Sparky software.Citation34)
NMR titration of a ligand
(GlcNAc)3 was used as the ligand for NMR titration experiments. The ligand was added in a stepwise manner to 0.1 mM 15N-labeled OEL in 20 mM sodium phosphate buffer pH 6.0 (90% H2O/10% D2O), and the spectral change observed with the OEL–ligand interaction was monitored using two-dimensional 1H–15N HSQC spectra. Chemical shift changes (∆δ) of individual amino acid residues, the 1HN resonances of which were significantly affected by ligand binding, were calculated by the equation:(1)
where ∆NH and ∆N are the observed shifts in the 1H- and 15N-dimensions, respectively. The amino acids exhibiting chemical shift changes of more than 0.02 upon addition of a saturated concentration of the ligand were highlighted on the surface of the crystal structure of GEL-(GlcNAc)3 complex (PDB code, 154L) in order to reveal the amino acid residues significantly affected by ligand binding.
pH titrations
The pH titration of OEL solution (0.1 mM) in distilled water (90% H2O/10% D2O) was performed at an ionic strength of 0.1 using NaCl in the absence or presence of 5 mM of (GlcNAc)3. 1H–15N HSQC spectra were recorded in the pH range of 2.5–9.5 at room temperature. 1H-NMR chemical shifts of individual resonances were plotted against pH, and the titration curves were fit to the equation listed below to estimate the apparent pKa values,(2)
where δi is the measured chemical shift at a given pH, δHA is the chemical shift of the 1HN resonance of the acidic region, δA− is that of the basic region, and pKa is the titration midpoint of the acid–base transition of the observed nuclei. The parameters δHA, δA−, and pKa were obtained by the Gauss–Newton nonlinear least squares fitting procedure on the basis of experimental titration data.
Production of the H101A-OEL mutant
The mutation of His101 to alanine was introduced into OEL (H101A-OEL) using a QuikChange site-directed mutagenesis kit (Stratagene, USA). The mutagenic primers used were 5′-GTTGATAGAAGATCAGCTAAACCAGTTGGAGAATGGAACGGA-3′ and 5′-TCCGTTCCATTCTCCAACTGGTTTAGCTGATCTTCTATCAAC-3′ (the mutation sites are underlined), and a plasmid harboring the wild type sequence (pET22b-OEL) was used as a template. The mutated gene was sequenced to verify the presence of the desired mutation. The expression and purification of H101A-OEL were performed in the same manner as for the wild type.
Circular dichroism (CD) spectroscopy
The CD spectra of wild type and mutant OEL were obtained at 25 °C with a Jasco J-720 spectropolarimeter (Jasco, Japan) to estimate the effect of mutation on the secondary structure of purified OEL. Experiments were performed with a final protein concentration of 10 μM in 10 mM sodium acetate buffer pH 5.0. A 1-cm path-length cell was used to obtain far-ultraviolet CD spectra (190−260 nm), and data were expressed in terms of mean residue ellipticity.
The thermal unfolding curves of OELs in the presence or absence of (GlcNAc)3 were also determined by monitoring CD values at 222 nm, while the solution temperature was raised from 25 to 85 °C at a rate of 1 °C/min using a temperature controller (PFD-425, Jasco). Protein samples were dialyzed against 50 mM sodium acetate buffer pH 5.0, and the final concentrations of proteins and (GlcNAc)3 were 5 and 5 mM, respectively. In order to facilitate comparisons between unfolding curves, experimental data were normalized as follows: the fraction of unfolded protein at each temperature was calculated from the CD value by linearly extrapolating the pre- and post-transition baselines into the transition zone, and plotted against the temperature.
Enzymatic activity of lysozyme
The lytic activities of lysozyme were assayed using the lyophilized cells of Micrococcus luteus as a substrate. The substrate suspension in 0.1 M sodium phosphate buffer, pH 7.0, was diluted and adjusted to 0.8–1.0 of an optical density (OD) at 540 nm. One hundred microliters of each enzyme solution (final concentration 0.15 mM) was added to 3 mL of the substrate suspension. The activity unit was evaluated from reductions in OD at 540 nm for 3 min. One enzyme unit was defined as the amount needed to cause a decrease of 0.1 OD unit at 540 nm for 1 min at 25 °C.
Lysozyme-catalyzed hydrolysis
The HPLC-based time-courses of OEL-catalyzed hydrolysis of the substrate (GlcNAc)6 were determined using a gel-filtration column of TSK-GEL G2000PW (7.5 × 600 mm; Tosoh) with a Hitachi L-7100 pump. The reaction mixture containing 0.15 mM lysozyme and 4.8 mM (GlcNAc)6 was incubated in 10 mM sodium acetate pH 4.0. After a given reaction time, an aliquot (20 μL) of the reaction mixture was withdrawn and mixed with 10 μL of cold 0.1 M NaOH to terminate the enzymatic reaction. Twenty microliters of the mixture solution was then applied onto a HPLC column, and elution was performed with distilled water at room temperature and a flow rate of 0.3 mL/min. Each chitooligosaccharide concentration was calculated from the peak area monitored by UV absorption at 220 nm, based on the standard curves obtained from authentic saccharide solutions.
Theoretical modeling of the enzymatic hydrolysis of (GlcNAc)6
A theoretical analysis of the reaction time-courses obtained by OEL and H101A-OEL was carried out using the reaction model reported for OEL.Citation24,28) Based on the splitting mode of (GlcNAc)6 (Fig. (A)), OEL was assumed to have a binding cleft consisting of six subsites, −3, −2, −1, +1, +2, and +3. All possible binding modes for the substrates were taken into consideration in the practical calculations. By assuming rapid equilibrium, the concentrations of the ES-complexes formed through the individual binding modes were calculated from the binding constants, which were obtained from the binding free energy values of individual subsites occupied with the sugar residues assuming additivity. Details of the calculation method were described by Honda and Fukamizo.Citation24)
In order to estimate the binding free energy values at individual subsites, an optimization technique based on the modified Powell methodCitation35) was employed using the cost function,(3)
where e and c represent the experimental and calculated values, respectively, n is the size of the oligosaccharides, and i is the reaction time. We initially estimated the rate constants for glycosidic bond cleavage (k+1) for OEL and H101A-OEL from the maximal velocity (Vmax) data. The reaction rates of (GlcNAc)6 degradation were determined at several points of the substrate concentration above 4.5 mM. Then, we confirmed that the reaction rates did not significantly changed with increase in the substrate concentration; that is, the enzyme was saturated by (GlcNAc)6 in this concentration range. The rate of degradation of (GlcNAc)6, under the condition that the enzyme is fully saturated by (GlcNAc)n, can be regarded as Vmax. The turnover numbers (kcat) obtained from the Vmax values were directly allocated to k+1 values for individual OELs. The rate constant k+1 was reported to be dependent upon the chain length of the substrate.Citation36) Thus, we similarly estimated the k+1 values for (GlcNAc)4. The rate constants for (GlcNAc)5 were not estimated, because (GlcNAc)5 was hardly detected in the HPLC-based time-course of (GlcNAc)6 degradation (Fig. ) and was not taken into consideration in the data-fitting. The k+1 values estimated for (GlcNAc)6 and (GlcNAc)4 are listed in Table . It is currently difficult to determine the value of k+2 (rate constant for hydration) with sufficient accuracy. Thus, the markedly higher value, 100.0 s−1, was tentatively allocated to k+2 because the bond cleavage process (k+1) is a rate-limiting step in the entire course of enzymatic hydrolysis. Optimization was conducted for OEL by changing the binding free energy values of the six subsites, while fixing the estimated k+1 value. Then, optimization was conducted for H101A-OEL by changing the binding free energy values of subsites −3, −2, and −1, while fixing the estimated k+1 values and the binding free energy values of subsites +1, +2, and +3. The binding affinities of subsites +1, +2, and +3 were assumed to be unaffected because these subsites were located far from the mutation site.
Table 1. Rate constants and binding free energy changes for OEL and H101A-OEL.
Results and discussion
Enzyme production and purification
In previous studies on OEL, the overexpression system of P. pastoris was used to produce the protein. However, as far as the NMR studies are concerned, the P. pastoris expression system is inconvenient for stable isotope labeling of the protein because a large amount of expensive 13C-labeled methanol should be added to the medium. Therefore, we herein attempted to produce OEL using an E. coli expression system with cultivation in M9 minimal medium. Although the yield (7 mg/L culture) of the recombinant protein from the E. coli system was lower than that from the P. pastoris system (10 mg/L culture), we successfully produced a sufficient amount of recombinant OEL. The procedure for OEL production in the E. coli system was markedly simpler than that in the P. pastoris system. Furthermore, the expensive 13C-labeled methanol was not required for protein production in E. coli system. Thus, for the production of 13C-labeled proteins used for NMR measurements, the E. coli expression system was found to be more convenient than the P. pastoris system. Unlabeled and 15N-labeled OEL were successfully purified by cation exchange column chromatography using CM-Toyopearl 650 M. SDS–PAGE of the purified proteins revealed that each enzyme exhibited a single band with a molecular mass of approximately 21 kDa (Supplementary Fig. 1).
Structural comparison between OEL produced by E. coli and that produced by P. pastoris
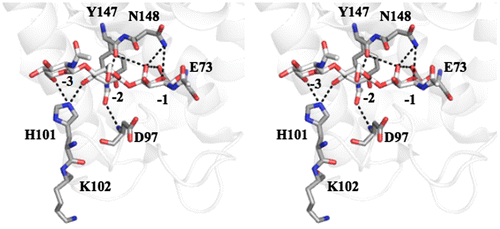
The 1H–15N HSQC spectrum of the recombinant OEL produced by the E. coli expression system was shown in Fig. (blue). Individual resonances were fully superimposed with those of the spectrum of the recombinant OEL produced by the P. pastoris expression system (red). This result indicated that the protein conformation of OEL produced from E. coli was identical to that produced from P. pastoris.
Fig. 2. Superimposition of the 1H–15N-HSQC spectra of 15N-labeled OELs produced by the E. coli expression system (blue) and P. pastoris system (red).
NMR chemical shift perturbations induced by (GlcNAc)3 binding to OEL
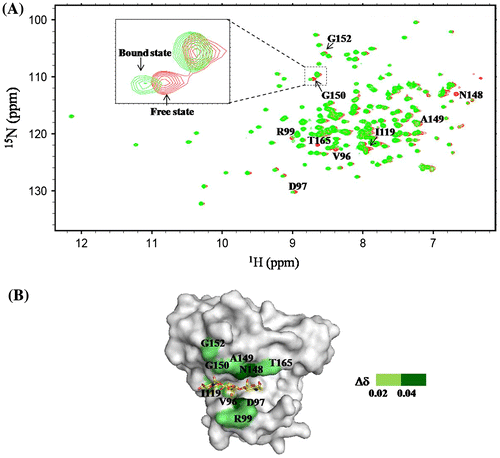
The interaction site of (GlcNAc)3 in OEL was estimated based on the chemical shift perturbation of 1H–15N HSQC spectra in the absence or presence of various concentrations of the ligand. Upon stepwise additions of the (GlcNAc)3 solution into the enzyme solution, several 1HN resonances shifted from a free state (colored red) to a bound state (colored green; molar ratio of ligand/OEL, 20), as shown in the inset of Fig. (A). At the molar ratio of 20 (ligand/OEL), the enzyme was almost saturated, because the additional titration of the ligand did not shift further the resonances. Amino acid residues, the 1HN resonances of which were affected by the titration (∆δ > 0.02 ppm at the molar ratio of ligand/OEL, 20), were visualized on the surface model of the crystal structure of GEL in a complex with (GlcNAc)3 (Fig. (B)). We regarded the values of Δδ lower than 0.02 ppm as the noise level. Most of resonances affected by the (GlcNAc)3 titration were concentrated around subsites −3, −2, and −1 of the binding cleft (Fig. (B)). Similar results were obtained by Shinya et al.Citation31), who conducted the NMR titration experiments with (GlcNAc)2 and (GlcNAc)4 using the recombinant OEL produced from P. pastoris. This indicated that the function of OEL produced from E. coli was almost identical to that produced from P. pastoris. However, Δδ of the 1HN resonance of His101 upon the addition of (GlcNAc)3 was only 0.02 (noise level). Therefore, the interaction of the His101 side chain with the sugar residues may have not significantly altered the main chain conformation of His101.
Fig. 3. Effect of (GlcNAc)3 titration on the backbone resonances of OEL.
Effects of (GlcNAc)3 binding on apparent pKa values determined from the NMR-based pH titration curves
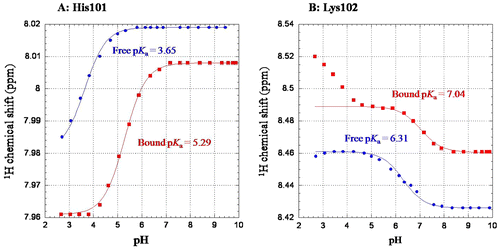
The 1H–15N HSQC spectra of OEL were obtained at various pH, and chemical shifts of individual resonances affected by changes in pH were plotted against pH to obtain pH titration curves. 1H-NMR chemical shifts of the 1HN resonances of the HSQC spectrum were markedly affected by changes in pH, in a manner that depended on the electrostatic environments of the individual amino acids. The values of the titration midpoint of the acid–base transition (pKa) were obtained by the nonlinear least squares fitting based on the pH titration curves of individual 1HN resonances. The monophasic titration curves were obtained for His101, and the pKa values were calculated as 3.65 for the free state, as shown in Fig. (A). Since the value for the free state was considerably deviated from the average pKa value for the histidine side chain (6.08), a positive charge may affect the ionization state of His101, resulting in such a lower pKa value. Since the titration curves for Lys102 were biphasic, we calculated apparent pKa values from the curves exhibiting full acid–base transitions (Fig. (B)). We then obtained apparent pKa of 6.31 for the free state. The value for free state was much lower than that of the average value for the lysine side chain (10.5). The lower pKa values for His101 and Lys102 may be derived from electrostatic repulsion between His101 and Lys102 side chains. Further evidences for the electrostatic interaction should be obtained to fully explain the lower pKa values. In this study, however, we focus our attention to the difference in pKa values between the free and (GlcNAc)3-bound states (∆pKa). Although a number of 1HN resonances were affected by changes in pH, amino acid residues, the apparent pKa values of which were shifted upon the addition of (GlcNAc)3, were restricted to the ligand-binding region. The values of ∆pKa were markedly larger in His101 (1.64) and Lys102 (0.73), as shown in Fig. (A) and (B). ∆pKa values for the other amino acid residues were less than 0.3 (Supplementary Table 1). The electrostatic environments of the amide protons of His101 and Lys102 appeared to be strongly affected by (GlcNAc)3 binding. The results obtained from the pH titration experiments using NMR spectroscopy supported the crystal structure showing the interaction between the imidazole side chain of His101 and the sugar residues (Fig. ). As described above, the pKa values of His101 and Lys102 in the free state were much lower than the average values of histidine and lysine, probably due to their repulsion. In fact, due to the close proximity of His101 and Lys102, pH dependence of the Lys102 resonance also exhibited a secondary pKa value around 3.5 (biphasic, Fig. (B)), which is very close to the observed pKa value of His101. Upon the addition of (GlcNAc)3, however, the His101 interaction with (GlcNAc)3 may partially affect the electrostatic behavior of the His101-Lys102 system, elevating the pKa values of His101 and Lys102 and subsequently eliminating the secondary pKa of Lys102 (monophasic, Fig. (B)). pKa value of the side chain NH of His101 could not be determined, because the resonance was broadened beyond recognition.
Fig. 4. pH titration curves obtained by monitoring 1H–15N HSQC resonances of His101 (A) and Lys102 (B) in the absence or presence of 5 mM of (GlcNAc)3.
Effects of the mutation of His101 to alanine on binding ability
In order to evaluate the contribution of the His101 side chain to the enzymatic reaction, His101 was mutated to alanine, and the mutant H101A-OEL was characterized. The far-UV CD spectra of OEL and H101A-OEL were similar to each other (Supplementary Fig. 2), indicating that the global conformation of the protein did not change with the mutation.
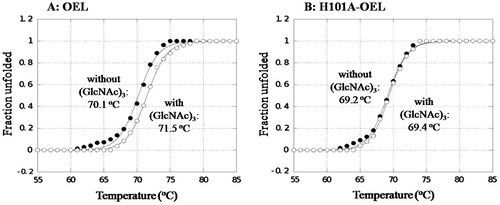
Thermal unfolding experiments were conducted to determine (GlcNAc)3 binding ability to OEL and H101A-OEL. The results obtained are shown in Fig. (A) and (B). The thermal unfolding curves showed that the transition temperature of the thermal unfolding (Tm) of OEL was 70.1 °C, while Tm value of 71.5 °C was observed in the presence of (GlcNAc)3, as shown in Fig. (A). The elevation in Tm (ΔTm) by (GlcNAc)3 binding was 1.4 °C. However, in H101A-OEL, the Tm value was 69.2 °C in the absence of (GlcNAc)3 and was not significantly elevated (ΔTm = 0.2 °C) upon the addition of (GlcNAc)3 (Fig. (B)). The elevation in Tm (ΔTm) by ligand binding was suppressed by the His101 mutation, indicating the interaction of His101 with (GlcNAc)3, as revealed by the crystal structure (Fig. ). A comparison of Tm values in the absence of (GlcNAc)3 between OEL (70.1 °C) and H101A-OEL (69.2 °C) revealed that the loss of stability caused by the H101A mutation was 0.9 °C, suggesting the small but significant contribution of His101 to structure stabilization. The electrostatic interaction of His101 with Glu97 may weakly stabilize the protein structure (Fig. ).
Fig. 5. Thermal unfolding curves of OEL (A) and H101A-OEL (B) in the absence or presence of 5 mM of (GlcNAc)3.
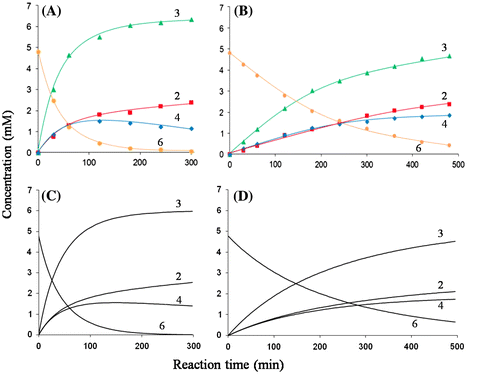
By monitoring the lysozyme-catalyzed lysis of M. luteus cells, the specific activities of OEL and H101A-OEL were determined to be 9.55 and 4.74 Units/mg, respectively. The H101A mutation in OEL reduced activity to approximately 50% that of the wild type. A chitin hexamer substrate, (GlcNAc)6, was also used as the substrate to evaluate mutation effects. Time-course of (GlcNAc)6 degradation catalyzed by OEL and H101A-OEL is shown in Fig. (A) and (B). Based on the rate of (GlcNAc)6 degradation, the activity toward (GlcNAc)6 was suppressed by the H101A mutation to approximately 15% that of the wild type previously reported.Citation28) Mutation effects were more intense in the oligosaccharide substrate. As previously reported, (GlcNAc)6 was hydrolyzed predominantly into (GlcNAc)3+(GlcNAc)3 and less frequently into (GlcNAc)2+(GlcNAc)4 by OEL.Citation28) The ratio of splitting into (GlcNAc)3+(GlcNAc)3 to that into (GlcNAc)2+(GlcNAc)4 was calculated as 64:36.Citation28) However, in H101A-OEL, the ratio of splitting into (GlcNAc)3+(GlcNAc)3 to that into (GlcNAc)2+(GlcNAc)4 was 56:44 (Fig. (B)). The frequency of (GlcNAc)6 cleavage into (GlcNAc)3+(GlcNAc)3 was slightly reduced, while that into (GlcNAc)2+(GlcNAc)4 was slightly enhanced by the H101A mutation. This result indicated that the H101A mutation reduced sugar residue affinities to negatively numbered subsites, and some fraction of the (GlcNAc)6 substrate was forced to bind to the binding region except subsite −3 in H101A-OEL. The results obtained for H101A-OEL clearly indicated that the His101 side chain interacts with the −3 and −2 sugars of the bound (GlcNAc)3 in solution.
Fig. 6. The experimental and modeled time-courses showing (GlcNAc)6 hydrolysis by OEL and H101A-OEL.
Theoretical modeling of reaction time-courses
In order to evaluate the contribution of the His101 side chain to the enzymatic reaction in more detail, we conducted the theoretical modeling of the reaction time-courses for OEL and H101A-OEL shown in Fig. (A) and (B), respectively. Based on the Vmax values, the k+1 values for (GlcNAc)6 and (GlcNAc)4 were determined to be 0.10 and 1.0 s−1 for OEL, and 0.03 and 0.25 s−1 for H101A-OEL, respectively, as listed in Table . Theoretical modeling for the time-course of OEL (Fig. (A)) was conducted by changing the values of free energy changes of sugar residue binding to the six subsites, while fixing the k+1 value. Binding free energy changes of the six subsites of OEL were optimized to be −0.30, −3.5, +5.1, −1.5, −2.6, and −2.8 kcal/mol, respectively (Table ). The calculated time-course obtained with these values fit sufficiently to the experimental time-course, as shown in Fig. (C). Then, we modeled the time-course for H101A-OEL (Fig. (B)). In this case, optimization was conducted only for the free energy values for subsites −3, −2, and −1 and provided −0.11, −3.3, and +5.1 kcal/mol, respectively (Table ). The calculated time-course obtained with these values fit well to the experimental time-course, as shown in Fig. (D). The values obtained by modeling studies were compared between OEL and H101A-OEL in order to evaluate the contributions of the His101 side chain to the reaction parameters. We found that, by H101A mutation, the sugar residue affinities of subsites −3 and −2 were reduced by 0.19 and 0.2 kcal/mol, respectively, while the rate constant k+1 decreased from 0.10 to 0.03 s−1 for (GlcNAc)6, and from 1.0 to 0.25 s−1 for (GlcNAc)4. The H101A mutation moderately affected sugar residue affinities at subsites −3 and −2, but markedly affected the rate constant k+1. The distance between the catalytic base Asp97 carboxylate and the His101 imidazole group was 7.8Å (Fig. ), which permitted a long-range electrostatic interaction. Thus, the imidazole side chain of His101 appeared to contribute to the catalytic efficiency of Asp97 carboxylate by stabilizing the negative charge of the catalytic base. The His101 mutation to alanine may have affected the interaction with −3 and −2 sugar residues, but more importantly, it affected the state of the electrostatic behavior of Asp97, reducing the proton-withdrawing capacity of the catalytic base. This situation in H101A-OEL may have resulted in the reduced specific activity and lower k+1 value.
Conclusion
Chemical shift perturbation experiments using NMR spectroscopy revealed that the 1HN resonance of His101 did not significantly respond to (GlcNAc)3 binding to OEL. The apparent pKa values obtained from the pH titration curves of the chemical shifts of 1HN resonances of His101 and Lys102 were greatly shifted following the addition of (GlcNAc)3. Thermal unfolding experiments and kinetic modeling of the time-courses of (GlcNAc)6 degradation catalyzed by H101A-OEL indicated that the H101A mutation affected not only sugar residue affinities at subsites −3 and −2, but also the rate constant for bond cleavage (k+1). His101 plays multiple roles in the enzymatic reaction; it forms hydrogen bonds with sugar residues and also forms a long-range electrostatic interaction with Asp97 in order to maintain catalytic efficiency. The long-range electrostatic interaction between the His101 and Asp97 side chains may be important for the catalytic action of Asp97 carboxylate and may have been disrupted by the H101A mutation. An amino acid sequence alignment of the GH23 lysozymes from avian egg white revealed that His101 was completely conserved in the lysozymes belonging to this family, including egg white lysozymes from goose, black swan, emu, and chicken. This also indicates the importance of His101 in the catalytic action of the GH23 lysozymes.
Authors contributions
Somboonpatarakun carried out the study and wrote the manuscript. Klaynongsruang and Fukamizo supervised the work and the manuscript. Shinya and Kawaguchi contributed to the manuscript corrections. Araki kindly donated the recombinant plasmid OEL. All authors read and approved the final manuscript.
Disclosure statement
No potential conflict of interest was reported by the authors.
Funding
This work was supported by the Royal Golden Jubilee (RGJ) Ph.D. Program of Thailand Research Fund [grant number PHD/0273/2551].
Supplemental materials
The supplemental material for this paper is available at http://dx.doi.org/10.1080/09168451.2015.1091716.
Supplementary_Table_1.docx
Download MS Word (24.4 KB)Supplementary_Fig_2.tif
Download TIFF Image (418.7 KB)Supplementary_Fig_1.tif
Download TIFF Image (488.1 KB)Acknowledgments
We would like to thank the Protein and Proteomics Research Center for Commercial and Industrial Purposes (ProCCI), Department of Biochemistry, Faculty of Science, Khon Kaen University for access to laboratory equipment.
References
- Jiménez-Cantizano RM, Infante C, Martin-Antonio B, et al. Molecular characterization, phylogeny, and expression of c-type and g-type lysozymes in brill (Scophthalmus rhombus). Fish Shellfish Immunol. 2008;25:57–65.
- Vanderkelen L, Van Herreweghe JM, Vanoirbeek KGA, et al. Identification of a bacterial inhibitor against g-type lysozyme. Cell. Mol. Life Sci. 2011;68:1053–1064.
- Jollès P, Jollès J. What’s new in lysozyme research? Always a model system, today as yesterday. Mol. Cell Biochem. 1984;63:165–189.
- Chipman DM, Pollock JJ, Sharon N. Lysozyme-catalyzed hydrolysis and transglycosylation reactions of bacterial cell wall oligosaccharides. J. Biol. chem. 1968;243:487–496.
- Araki T, Kudo K, Kuramoto M, et al. The amino acid sequence of Indian peafowl (Pavo cristatus) lysozyme and its comparison with lysozymes from phasianoid birds. Agric. Biol. Chem. 1989;53:2955–2962.
- Araki T, Kudo K, Kuramoto M, et al. The amino acid sequence of lysozyme from kalij pheasant (Lophura leucomelana) egg-white. Agric. Biol. Chem. 1991;55:1701–1706.
- Araki T, Kuramoto M, Torikata T. The amino acid sequences of lady amherest's pheasant (Chrysolophus amherstiae) and golden pheasant (Chrysolophus pictus) egg-white lysozymes. Agric. Biol. Chem. 1990;54:2299–2308.
- Araki T, Kuramoto M, Torikata T. The amino acid sequence of reeves' pheasant (Syrmaticus reevesii) lysozyme. Agric. Biol. Chem. 1991;55:1707–1713.
- Araki T, Kuramoto M, Torikata T. The amino acid sequence of copper pheasant lysozyme. Biosci. Biotechnol. Biochem. 1994;58:794–795.
- Canfield RE, Kammerman S, Sobel JH, et al. Primary structure of lysozymes from man and goose. Nature. 1971;232:16–17.
- Dautigny A, Prager EM, Pham-Dinh D, et al. cDNA and amino acid sequences of rainbow trout (Oncorhynchus mykiss) lysozymes and their implications for the evolution of lysozyme and lactalbumin. J. Mol. Evol. 1991;32:187–198.
- Daffre S, Kylsten P, Samakovlis C, et al. The lysozyme locus in Drosophila melanogaster: an expanded gene family adapted for expression in the digestive tract. Mol. Gen. Genet. 1994;242:152–162.
- Engström A, Xanthopoulos KG, Boman HG, et al. Amino acid and cDNA sequences of lysozyme from Hyalophora cecropia. EMBO J. 1985;4:2119–2122.
- BLAKE CCF, KOENIG DF, MAIR GA, et al. Structure of hen egg-white lysozyme: a three-dimensional fourier synthesis at 2 Å resolution. Nature. 1965;206:757–761.
- Canfield RE. The amino acid sequence of egg white lysozyme. J. Biol. Chem. 1963;238:2698–2707.
- Jollès J, Jauregui-Adell J, Bernier I, et al. La structure chimique du lysozyme de blanc d’oeuf de poule: étude détaillée [The chemical structure of hen's egg white lysozyme: the detailed study]. Biochim. Biophys. Acta. 1963;78:668–689.
- Inouye M, Okada Y, Tsugita K. The amino acid sequence of T4 phage lysozyme. J. Biol. Chem. 1970;245:3479–3484.
- Matthews BW, Remington SJ. The three dimensional structure of the lysozyme from bacteriophage T4. Proc. Natl. Acad. Sci. USA. 1974;71:4178–4182.
- Grütter MG, Weaver LH, Matthews BW. Goose lysozyme structure: an evolutionary link between hen and bacteriophage lysozymes? Nature. 1983;303:828–831.
- Isaacs NW, Machin KJ, Masakuni M. Three-dimensional structure of goose-type lysozyme from the egg white of the Austalian black swan, Cygnus atratus. Aust. J. Biol. Sci. 1985;38:13–22.
- Simpson RJ, Morgan FJ. Complete amino acid sequence of Embden goose (Anser anser) egg-white lysozyme. Biochim. Biophys. Acta. 1983;744:349–351.
- Henrissat B, Bairoch A. New families in the classification of glycosyl hydrolases based on amino acid sequence similarities. Biochem. J. 1993;293:781–788.
- Weaver LH, Grütter MG, Matthews BW. The refined structures of goose lysozyme and its complex with a bound trisaccharide show that the ‘‘goose-type’’ lysozymes lack a catalytic aspartate residue. J. Mol. Biol. 1995;245:54–68.
- Honda Y, Fukamizo T. Substrate binding subsites of chitinase from barley seeds and lysozyme from goose egg white. Biochim. Biophys. Acta. 1998;1388:53–65.
- Helland R, Larsen RL, Finstad S, et al. Crystal structures of g-type lysozyme from Atlantic cod shed new light on substrate binding and the catalytic mechanism. Cell. Mol. Life Sci. 2009;66:2585–2598.
- Hirakawa H, Ochi A, Kawahara Y, et al. Catalytic reaction mechanism of goose egg-white lysozyme by molecular modelling of enzyme-substrate complex. J. Biochem. 2008;144:753–761.
- Schoentgen F, Jollès J, Jollès P. Complete amino acid sequence of ostrich (Struthio camelus) egg-white lysozyme, a goose type lysozyme. Eur. J. Biochem. 1982;123:489–497.
- Kawamura S, Fukamizo T, Araki T, et al. Expression of a synthetic gene coding for ostrich egg-white lysozyme in Pichia Pastoris and its enzymatic activity. J. Biochem. 2003;133:123–131.
- Kawamura S, Ohno K, Ohkuma M, et al. Experimental verification of the crucial roles of Glu73 in the catalytic activity and structural stability of goose type Lysozyme. J. Biochem. 2006;140:75–85.
- Kawamura S, Ohkuma M, Chijiiwa Y, et al. Role of disulfide bonds in goose-type lysozyme. FEBS J. 2008;275:2818–2830.
- Shinya S, Ohnuma T, Kawamura S, et al. Interaction of a goose-type lysozyme with chitin oligosaccharides as determined by NMR spectroscopy. J. Biochem. 2011;150:569–577.
- Rupley JA. The hydrolysis of chitin by concentrated hydrochloric acid, and the preparation of low-molecular-weight substrates for lysozyme. Biochim. Biophys. Acta. 1964;83:245–255.
- Pace CN, Vajdos F, Fee L, et al. How to measure and predict the molar absorption coefficient of a protein. Protein Sci. 1995;4:2411–2423.
- Goddard TD, Kneller DG. Sparky: NMR assignment and integration software. Version 3.114. San Francisco CA: University of California; 2008.
- Kuhara S, Ezaki E, Fukamizo T, et al. Estimation of the free energy change of substrate binding in lysozyme-catalyzed reactions. J. Biochem. 1982;92:121–127.
- Fukamizo T, Minematsu T, Yanase Y, Hayashi K, Goto S. Substrate size dependence of lysozyme-catalyzed reaction. Arch. Biochem. Biophys. 1986;250:312–321.