
Abstract
A novel linker containing biotin, alkyne and benzophenone groups (1) was synthesized to identify target proteins using a small molecule probe. This small molecule probe contains an azide group (azide probe) that reacts with an alkyne in 1 via an azide–alkyne Huisgen cycloaddition. Cross-linking of benzophenone to the target protein formed a covalently bound complex consisting of the azide probe and the target protein via 1. The biotin was utilized via biotin–avidin binding to identify the cross-linked complex. To evaluate the effectiveness of 1, it was applied in a model system using an allene oxide synthase (AOS) from the model moss Physcomitrella patens (PpAOS1) and an AOS inhibitor that contained azide group (3). The cross-linked complex consisting of PpAOS1, 1 and 3 was resolved via SDS–PAGE and visualized using a chemiluminescent system. The method that was developed in this study enables the effective identification of target proteins.
Graphical abstract
A target protein can be identified using a linker with biotin, alkyne, and benzophenone groups, and a bioactive small molecule introducing only an azide group (azide probe).
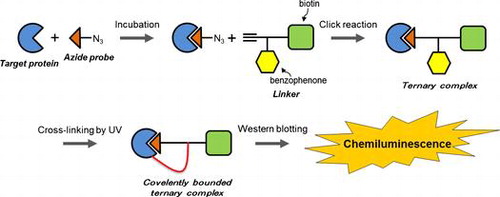
Photoaffinity probes have been utilized to identify target proteins in combination with small bioactive molecules with photophores and tags for detection.Citation1) Aryl azide, benzophenone and 3-aryldiazirine are well-known photophores that are photoactivated by UV irradiation and used to cross-link small molecules and target proteins.Citation1–3) Tags such as biotin or fluorescent groups are used to detect proteins that are cross-linked with photoaffinity probes.Citation4–6) Photoaffinity probes are useful for identifying proteins bound to small bioactive molecules. However, the introduction of photophores and tags into small molecules often decreases both their affinity for the target protein and the bioactivity of the small molecule, limiting the use of photoaffinity probes for protein identification. In contrast, Budin et al. used non-denaturing protein electrophoresis to determine that a complex containing a non-cross-linked target protein and an azide probe could be created through the Huisgen [3 + 2] cycloaddition known as click chemistry, which is an important bioorthogonal reaction.Citation7–10) However, separation of proteins by non-denaturing gel electrophoresis is less effective than separation by SDS–PAGE. To overcome the limitations of photoaffinity probes and the use of protein gel electrophoresis under non-denaturing conditions, this study provides a novel method to identify target proteins using an azide probe, which is a small bioactive molecule; this probe is created by introducing an azide group into a small molecule, which minimizes the loss of both affinity for the protein and the bioactivity of the original molecule. A linker containing alkyne, biotin, and photophore groups connects the azide probe with the target protein. The linker thus performs the function of binding the azide probe to the target protein and labeling the protein for detection, which are roles that conventional photoaffinity probes have fulfilled until recently. A summary of the method developed in this study is shown in Fig. : (1) the azide probe is incubated with the target protein; (2) the linker is added to a mixture of the azide probe and the target protein, and a conjugate between the linker and the azide probe is formed via Huisgen cycloaddition; (3) UV irradiation causes the complex to bind both the target protein and the conjugate of the azide probe through the linker’s benzophenone group; and (4) the ternary complex that is formed between the target protein, the azide probe and the linker is identified via Western blotting. Therefore, the azide probe does not require a photophore and a tag that could prevent access to the binding site of the target protein. Thus, the method proposed in this study can be used to effectively identify target proteins.
Fig. 1. Illustration of the method for identifying a target protein in this study.
Linker 1 that was used in this study is shown in Fig. . Biotin is commonly used as a tag for protein detection via Western blotting. Benzophenone was introduced into the linker. Polyether is commonly used as a hydrophilic spacer, and an alkyne is necessary for the Huisgen cycloaddition. To examine whether this strategy is effective for identifying proteins targeted with small molecules, an allene oxide synthase (AOS) was selected as the target protein, and AOS inhibitor 2 and azide probe 3 were chosen as the small molecules for use in this study (Fig. ).
Fig. 2. Structures of linker 1, AOS inhibitor 2, and azide probe 3.
AOS, which is an enzyme involved in the biosynthetic pathway of jasmonic acid (Fig. ), a plant hormone, converts 13(S)-hydroperoxylinolenic acid (13-HPOT) into (12,13S)-epoxy-(9Z,11E,15Z)-octadecatrienoic acid (12,13-EOT),Citation11) which is the first specific reaction in the biosynthesis of jasmonic acid (Fig. ). AOS is classified as cytochrome P450 CYP74A and contains a heme iron in its active center. The inhibitory mechanism of cytochrome P450s has been studied.Citation12) Imidazole derivatives inhibit cytochrome P450s, apparently due to the affinity of the electron pair on the nitrogen in heterocyclic molecules for the heme iron in the active center.Citation13,14) Oh and Murofushi synthesized imidazole derivatives with alkylcarboxylate moieties as AOS inhibitors and introduced the alkylcarboxylate moieties into the AOS inhibitors to mimic the partial structure of 13-HPOT.Citation15)
Fig. 3. Biosynthesis of jasmonic acid.
Fig. 4. Structure of conjugate of linker 1 and azide probe 3 (11).
Fig. 5. Identification of the PpAOS1–azide probe–linker complex by Western blotting.
Fig. 6. Dose-dependent increase in chemiluminescence with both PpAOS1 and azide probe 3.
Fig. 7. Examination of the effectiveness of azide probe 3 for detecting the chemiluminescence of the PpAOS1–azide probe–linker complex.

Fig. 8. Detection of PpAOS1 in lysates of E. coli overexpressing PpAOS1.
This study shows that the method described above enables the identification of target proteins using a model system of PpAOS1 and an AOS inhibitor introducing only an azide group (azide probe).
Experimental
General
1H NMR spectra were recorded on a JEOL EX-270 FT NMR (270 MHz) spectrometer (JEOL Ltd., Tokyo, Japan), and CDCl3 (7.24 ppm) or CD3OD (3.30 ppm) was used as an internal standard. Mass spectra were collected on a JEOL JMS-T100GCV mass spectrometer (JEOL Ltd., Tokyo, Japan). Specific rotation values were measured on a JASCO DIP-310 polarimeter (JASCO Corporation, Tokyo, Japan). Chemical reagents were purchased from Wako Pure Chemical Industries, Ltd. (Osaka, Japan), unless otherwise noted.
tert-Butyl {2-[2-(2-hydroxyethoxy)ethoxy]ethyl}carbamate (5).
2-[2-(2-Chloroethoxy)ethoxy]ethanol (4, 6.3 g, 37 mmol), NaI (1.8 g, 12 mmol), and NaN3 (3.9 g, 60 mmol) were dissolved in 30 mL of deionized water and then stirred at 60 °C for 16 h. The reaction mixture was filtered to remove insoluble matter. The filtered solution was extracted with 60 mL of EtOAc. The organic layer was dried over Na2SO4 and evaporated to yield the azide (6.5 g). The azide (6.5 g) was dissolved in MeOH containing 0.5 g of 5% Pd–C and was stirred under a hydrogen atmosphere at room temperature for 12 h. The reaction mixture was filtered using Celite and was evaporated to yield the corresponding amine (6.2 g). The amine was dissolved in 150 mL of CH3CN. This was followed by the addition of 30 mL of deionized water, 30 mL of 1 M NaOH, and (Boc)2O (8.1 g, 37 mmol) at room temperature for 16 h. The reaction mixture was evaporated and the resultant residue was added to 100 mL of water and then extracted with an equal volume of EtOAc. The organic layer was dried over Na2SO4. After evaporation of the organic layer, the residue that was obtained was purified by silica gel column chromatography (200 g, MeOH-CHCl3 1/50) to yield 5 (6.2 g, 25 mmol) as a colorless oil. The yield from the three steps was 68%. 1H NMR (270 MHz, CDCl3): 5.21 (1H, br. s), 3.68 (2H, t, J = 7.1 Hz), 3.61–3.52 (6H, m), 3.50 (2H, t, J = 7.1 Hz), 3.24 (2H, t, J = 6.9 Hz), 2.88 (1H, br. s), 1.37 (9H, s); 13C NMR (67.8 MHz, CDCl3): 155.9, 79.1, 72.5, 72.4, 70.2, 70.1, 61.5, 40.3, 28.2; FD-MS m/z (rel.int.): 250 (100, [M + H]+), 249 (13.0, [M]+), 57.0 (25.1), 31.0 (16.1); FD-HR-MS m/z: calcd. for C11H24NO5, 250.16545, found 250.16572.
tert-Butyl {2-[2-(2-bromoethoxy)ethoxy]ethyl}carbamate (6).
Compound 5 (713 mg, 2.85 mmol), CBr4 (1.23 g, 3.70 mmol), and K2CO3 (510 mg, 3.70 mmol) were dissolved in 5 mL of CH2Cl2. Ten mL of CH2Cl2 containing PPh3 (1.2 g, 4.56 mmol) was added by syringe to the solution and stirred at room temperature for 24 h. After evaporation of the reaction mixture, the resultant residue was added to n-hexane, and the insoluble material was filtered. The resultant material, which was obtained by evaporation of the filtrate, was purified by silica gel column chromatography (40 g, n-hexane-EtOAc, 1/1) to yield 6 (745 mg, 2.40 mmol, 84%) as a colorless oil. 1H NMR (270 MHz, CDCl3): 4.98 (1H, br.s), 3.76 (2H, t, J = 7.0 Hz), 3.63–3.55 (4H, m), 3.50 (2H, t, J = 7.1 Hz), 3.43 (2H, t, J = 7.3 Hz), 3.25 (2H, t, J = 7.1 Hz), 1.39 (9H, s); 13C NMR (67.8 MHz, CDCl3): 155.8, 79.1, 71.0, 70.3, 70.1, 70.0, 40.2, 30.1, 28.3; FI-MS m/z (rel.int.): 314 (52.5), 313 (100), 312 (58.3, [M + H]+), 311 (94.8, [M]+), 57.0 (84.6); FI-HR-MS m/z: calcd. for C11H22BrNO4, 311.07322, found 311.07016.
tert-Butyl {2-[2-(2-prop-2-ylethoxy)ethoxy]ethyl}carbamate (7).
10 mL of dry THF was added to a flask containing 2-propyn-1-ol (560 mg, 10 mmol) and NaH (480 mg, 20 mmol) and was stirred on ice for 20 min. After the addition of 6 (488 mg, 1.6 mmol) to the solution, it was stirred for an additional 2 h. An aqueous solution of NH4Cl was added to the reaction mixture to terminate the reaction, and the solution was then extracted with 60 mL of EtOAc. The organic layer was dried over Na2SO4. The resultant matter was purified by silica gel column chromatography (40 g, n-hexane-EtOAc 3/2) to yield 7 (90 mg, 0.31 mmol, 20%) as a yellow oil. 1H NMR (270 MHz, CDCl3): 5.00 (1H, br), 4.18 (2H, d, J = 3.3 Hz), 3.70–3.66 (4H, m), 3.64–3.56 (4H, m), 3.50 (2H, t, J = 7.3 Hz), 3.28 (2H, t, J = 7.2 Hz), 2.40 (1H, t, J = 3.3 Hz), 1.41 (s, 9H); 13C NMR (67.8 MHz, CDCl3): 155.9, 79.5, 79.1, 74.5, 70.4, 70.3, 70.19, 70.17, 69.0, 58.3, 40.3, 28.3; FD-MS m/z (rel.int.): 288 (100, [M + H]+), 287 (19.0, [M]+), 69.0 (95.7), 57.0 (91.3); FD-HR-MS m/z: calcd. for C14H26NO5, 288.18110, found 288.18038.
2-[2-(2-Prop-2-ynyloxyethoxy)ethoxy]ethylamine (8).
Compound 7 (90 mg, 0.31 mmol) was dissolved in 50% TFA-CH2Cl2 (2 ml) and stirred at 0 °C for 2 h. The reaction mixture was evaporated to yield 8 (58 mg, 0.31 mmol, 99%) as a yellow oil. 1H NMR (270 MHz, CD3OD): 4.80 (2H, s), 4.20 (2H, d, J = 3.1 Hz), 3.68–3.56 (8H, m), 3.30 (2H, t, J = 7.2 Hz), 2.95 (2H, t, J = 7.4 Hz), 2.85 (1H, t, J = 3.1 Hz); 13C NMR (67.8 MHz, CD3OD): 80.5, 76.0, 71.4, 71.25, 71.23, 70.5, 70.0, 59.0, 41.3; FD-MS m/z (rel.int.): 188 (100, [M + H]+); FD-HR-MS m/z: calcd. for C9H18NO3, 188.12867, found 188.12836.
(+)-5-(2-Oxohexahydrothieno[3,4-d]imidazol-4-yl)-pentanoic acid (2-(4-benzoylphenyl)-1-{2-[2-(2-prop-2-ynyloxyethoxy)ethoxy]ethylcarbamoyl}ethyl)amide (1).
(+)-Biotin (9, 24.4 mg, 0.10 mmol), HOBT (13.5 mg, 0.10 mmol), and EDC (19.1 mg, 0.10 mmol) were dissolved in DMF (5 mL) and then stirred at room temperature for 1 h. 2-Amino-3-(4-benzoylphenyl)propanoic acid (10, 20.0 mg, 0.090 mmol) was added to the reaction mixture, and the mixture was stirred for 16 h. Then, EDC (19.1 mg, 0.10 mmol) and 8 (15.0 mg, 0.08 mmol) were added to the reaction mixture, which was then stirred for an additional 16 h. The reaction solution was added to EtOAc (20 ml) and was then washed with 30 mL of 1 M HCl, followed by deionized water. The organic layer was dried over Na2SO4 and was concentrated in vacuo. The resultant residue was purified by silica gel column chromatography (20 g, CHCl3-MeOH 9/1) to give 1 (11 mg, 0.017 mmol, 21%) as a yellow oil. 1H NMR (270 MHz, CDCl3): 7.83 (2H, d, J = 8.0 Hz), 7.72 (2H, m), 7.60 (1H, m), 7.44 (2H, m), 7.21 (2H, m), 4.35 (1H, m), 4.15 (2H, m), 3.99 (2H, m), 3.63–3.46 (10H, m), 3.42 (2H, t, J = 7.3 Hz), 3.16 (1H, m), 2.87 (2H, m), 2.68 (2H, m), 2.14 (1H, m), 2.05 (2H, m), 1.72 (2H, m), 1.50 (2H, m), 1.16 (2H, t, J = 7.2 Hz); 13C NMR (67.8 MHz, CDCl3): 196.4, 179.9, 171.4, 142.2, 138.3, 133.8, 132.6, 130.8, 130.3, 130.1, 129.9, 129.6, 128.6, 128.3, 127.9, 81.8, 77.2, 76.2, 72.7, 72.1, 71.4, 70.7, 70.3, 64.8, 57.9, 57.5, 56.8, 55.2, 51.5, 44.6, 42.7, 33.6, 28.3, 27.9, 24.7; FD-MS m/z (rel.int.): 665 (100, [M+H]+), 664 (52.1, [M]+); FD-HR-MS m/z: calcd. for C35H45N4O7S, 665.30089, found 665.29875; [α]D25 + 21.0° (c 0.40, MeOH)
Synthesis of 2 and 3
The synthesis of 2 and 3 is described in the Supplementary data.
AOS inhibitory assay
Recombinant PpAOS1 was obtained according to the method of Bandara (2009).Citation17) An AOS inhibitory assay was performed according to the method of Oh and Murofushi with minor modifications.Citation15) The reaction mixture containing PpAOS1 (0.5 μM), 13-HPOT (10 μM), and each concentration of AOS inhibitor in 100 μL of 50 mM phosphate buffer at pH 7.0 was incubated at 25 °C for 30 min. A portion of the reaction solution (10 μL) was loaded onto an HPLC (column: Capcelpak C18 UG120, 4.6 mm i.d. × 150 mm, Shiseido, Japan; solvent: 50% CH3CN aq. with 0.1% phosphoric acid; flow: 1.0 ml/min; detection: UV, 235 nm). AOS inhibitory activity was calculated from the decrease in the peak area of 13-HPOT as a substrate.
Detection of PpAOS1 by Western blotting
Azide probe 3 (30 μM) and recombinant PpAOS1 (10 μM) were pre-incubated in 60 μL of 50 mM sodium phosphate buffer at pH 7.8 for 1 h on ice prior to bioorthogonal coupling. Azide alkyne Huisgen cycloaddition was initiated by the addition of linker 1 (30 μM) and CuI (0.5 μM) and was incubated for 1 h. After the cycloaddition, the mixture was irradiated with UV (365 nm) on ice for an additional 1 h. For control experiments, PpAOC2 (10 μM)Citation18) was added to the reaction mixture instead of PpAOS1.
The sample solution was centrifuged to remove insoluble CuI from the reaction mixture and was then analyzed by SDS–PAGE. The gel was equilibrated with a blotting buffer (25 mM Tris-HCl, pH 8.3, 192 mM glycine, 10% MeOH) for 5 min. A PVDF membrane (Millipore, USA), which was treated with MeOH and water, was also equilibrated with the blotting buffer. The protein was transferred from the gel onto the PVDF membrane for 1 h using a Trans-blot semi dry SD cell (Bio-Rad, USA). The electric current was set at 0.8 mA/cm2. For blocking, the membrane was incubated in 5% non-fat dry milk in PBS-T buffer (80 mM Na2HPO4, 20 mM NaH2PO4, 100 mM NaCl and 0.1% Tween 20) overnight at 4 °C, and the membrane was then washed twice using PBS–T buffer. The membrane after blocking was incubated in PBS–T buffer containing streptavidin horseradish peroxidase conjugate (50 ng/mL, Pierce, USA). After washing the membrane, it was soaked in Amersham ECL Western blotting detection reagents (GE Healthcare, USA) at room temperature for 5 min. The chemiluminescence derived from the ternary complex was detected using a LumiVisionPro 400EX fluorescence imager (AISIN, Japan).
To examine the inefficiency of the bioorthogonal coupling of linker 1 and azide probe 3 before incubation of 1 with PpAOS1 for PpAOS1 detection, linker 1 (1 mM), azide probe 3 (1 mM) and CuI (5 μM) were mixed in 5 mL of MeOH, and the solution was incubated at room temperature for 1 h. Two microliters of the reaction mixture containing the Huisgen cycloaddition and 56 μL of PpAOS1 (10 μM) were incubated in 50 mM sodium phosphate buffer, pH 7.8, on ice for 1 h. Then, UV irradiation of the reaction mixture was performed as described above.
For competition assays, AOS inhibitor 2 (300 μM) was added to 60 μL of 50 mM sodium phosphate buffer, pH 7.8, containing azide probe 3 (30 μM) and the recombinant PpAOS1 (10 μM). Other procedures were performed as described above.
Evaluation of the dose-dependent PpAOS1 signal increase by PpAOS1 and 3
To evaluate the concentration dependence of PpAOS1 on chemiluminescence, the PpAOS1 concentration was varied from 1.25 to 10 μM. Similarly, variable amounts of azide probe 3 from 3 to 3000 nM were added to the reaction mixture. The other procedure for PpAOS1 detection was performed as described above.
Detection of PpAOS1 in lysates of E. coli overexpressing PpAOS1
A single colony of E. coli transformed with pET23a containing PpAOS1 was incubated in 5 mL of LB medium containing 100 μg/mL of ampicillin at 37 °C. After the culture had grown to a cell density of OD600 = 0.6, PpAOS1 synthesis was induced by the addition of IPTG at 0.2 mM. After further incubation at 37 °C for 3 h, the cells were collected by centrifugation at 5000 g for 5 min and then resuspended with 50 mM sodium phosphate buffer at pH 7.8 and disrupted by ultrasonication. The cell debris was removed by centrifugation at 15,000 g for 30 min. 56 μL of the resultant supernatant (protein concentration; 500 μg/mL) was used for Western blotting. For control experiment, the lysate of the E. coli strain was prepared as described above except for IPTG treatment.
Results and discussion
Synthesis of 1, 2, and 3
To synthesize linker 1, alcohol 5 was prepared from 2-[2-(2-chloroethoxy)ethoxy]ethanol 4 via three reactions: introduction of the azide group, reduction of the azide to an amine, and protection of the amino group using a tert-butoxycarbonyl (Boc) group. Alcohol 5 was then converted to bromide 6. The reaction of bromide 6 with 2-propyn-1-ol produced alkyne 7, and deprotection of the Boc group formed polyether amine 8 (Scheme ). The conjugation of biotin 9 and 2-amino-2-[4-(phenylcarbonyl)phenyl]acetic acid 10Citation16) followed by amidation with biotin polyether amine 8 yielded the desired linker containing biotin, alkyne, and benzophenone group 1 (Scheme ).
Scheme 1. (a) (1) NaN3, NaI, H2O, 60 °C, 16 h. (2) Pd/C, H2, CH3OH, r.t., 12 h. (3) (Boc)2O, NaOH, CH3CN, r.t., 12 h, 68% (3 steps); (b) CBr4, K2CO3, PPh3, CH2Cl2, r.t., 12 h, 84%; (c) 2-propyn-1-ol, NaH, THF, 0 °C, 2 h, 20%; (d) 50% TEA-CH2Cl2, 0 °C, 2 h, 99%.
Scheme 2. (a) (1) EDC, HOBT, DMF, r.t., 18 h; (2) 8, EDC, DMF, r.t., 16 h, 21% (2 steps).
The AOS inhibitor 2 and azide probe 3, which was the azide group introduced into the structure of AOS inhibitor 2, were synthesized as model compounds according to the method of Oh and Murofushi with some modifications (Supplementary data).Citation15) The AOS inhibitory activities of 2 and 3 were examined. The AOS reaction was conducted by incubating purified recombinant PpAOS1Citation17) from the model moss Physcomitrella patens with 13-HPOT as a substrate and various concentrations of 2 or 3 at 25 °C for 30 min. The activities of 2 and 3 were estimated by measuring the decreased peak areas of 13-HPOT by HPLC analysis,Citation15) showing that the AOS inhibitory activity of an azide probe 3 was higher than that of AOS inhibitor 2 (Fig. S1). The azide group, which was attached to the terminal alkyl group in 3, increased AOS inhibitory activity. The data indicated that azide probe 3 also interacts with AOS and provides access to the AOS for chemical labeling. Therefore, azide probe 3 was used in the next step.
Detection of a recombinant PpAOS1 as a model system
Detection of PpAOS1 was attempted using azide probe 3 and linker 1. Azide probe 3 was incubated with PpAOS1 in 50 mM phosphate buffer at pH 7.8. Linker 1 was conjugated with 3 via the click reaction using Cu (I) as a catalyst (Fig. ). The PpAOS1 and the conjugate 11 (Fig. ) were cross-linked by UV irradiation to a benzophenone group. The ternary complex containing PpAOS1, 1 and 3 was analyzed by SDS–PAGE. To detect the biotinylated components, the ternary complex was electrophoretically transferred onto a membrane surface and the blot was visualized via chemiluminescence using streptavidin and horseradish peroxidase. Chemiluminescence arising from the ternary complex was observed (Fig. ).
Azide probe 3 was a derivative of 2 with the azide group bound to the terminal alkyl group. To determine if 3 binds to the same PpAOS1 site as 2, a 10-fold excess of AOS inhibitor 2 as a competitor was incubated with 3 in a PpAOS1 solution. The results indicated that the addition of 2 caused the PpAOS1 chemiluminescent signal to disappear (Fig. ). A competition assay was performed with an excess of 2 to confirm that labeling was the result of a specific interaction. Accordingly, AOS inhibitor 2 and azide probe 3 bound to the same binding site of PpAOS1, as expected.
To examine whether azide probe 3 specifically binds PpAOS1, PpAOS1 was replaced with PpAOC2, which is another JA biosynthetic enzyme.Citation18) As a result, no signal corresponding to PpAOC2 was detected, confirming the specific binding of 3 with PpAOS1. Therefore, the method could specifically detect a target protein bound to an azide probe.
Dose dependence of azide probe 3 and PpAOS1 for PpAOS1 chemiluminescent signal intensity
To investigate whether the intensity of the chemiluminescent signal varied with the PpAOS1 concentration, the concentration of PpAOS1 was varied from 1.25 to 10 μM. The results indicated that the intensity of the chemiluminescent signal increased dose dependently from 1.25 to 10 μM PpAOS1 (Fig. (A)). The concentration dependence of the chemiluminescent signal intensity on azide probe 3 was also examined. The concentration of 3 ranged from 3 to 3000 nM, and a dose-dependent increase in the chemiluminescent signal of azide probe 3 was also observed (Fig. (B)). These data confirm that the developed method for identifying target proteins bound to small molecules yielded dose-dependent increases in the chemiluminescent signal intensity with the target protein and the azide probe.
Efficacy of the developed method using linker 1 and azide probe 3
In the previously described experiments to detect PpAOS1 as a target protein, a Huisgen cycloaddition was performed after incubating 3 with PpAOS1. Azide probe 3 detected PpAOS1 without requiring a photophore in the structure of 3. To test the efficacy of the azide probe for detecting a target protein, the conjugate 11 was formed via Huisgen cycloaddition and was then incubated with PpAOS1. As a result, no chemiluminescent signal was detected via Western blotting (Fig. ). Although the detailed structure of PpAOS1 and 3 as a complex has not been examined, previous studies on cytochrome P450 inhibitors indicated that the benzene and imidazole moieties are located near the active site.Citation13,14) The azide group in 3 appear to reside on the surface of PpAOS1. Linker 1 could provide access to the azide group of 3 on the surface of PpAOS1, and the resultant conjugate 11 still provides a stable interaction with PpAOS1. On the other hand, the bulky moiety in conjugate 11, which is preliminarily formed before incubating 3 with PpAOS1, should inhibit its approach to the binding site of PpAOS1. Therefore, these data showed the efficacy of the method for identifying the binding protein using an azide probe that was minimally modified by an azide group.
Detection of PpAOS1 in a crude protein extract
As described above, the developed method to identify a target protein with small bioactive compounds was shown to work in a model system using recombinant PpAOS1 and azide probe 3. However, it is possible that the method in this study detects non-specific protein signals in a crude protein solution, which can obscure a signal derived from a target protein. To examine whether the method in this study can effectively detect the target protein of a small bioactive compound in a protein mixture, linker 1 and azide probe 3 were incubated in a lysate of E. coli transformed with an overexpressing vector containing PpAOS1; then, detection of PpAOS1 was attempted by Western blotting (Fig. ). A chemiluminescent signal derived from PpAOS1 in a lysate of the E. coli strain, whose protein expression was induced by isopropyl-β-d-thiogalactopyranoside (IPTG), was clearly observed. Conversely, a PpAOS1-derived signal was not detected in a lysate of the E. coli strain without IPTG treatment. These data show that the method developed in this study can be applied to the detection of a target protein of a bioactive small molecule in a crude protein extract.
Conclusions
This study demonstrated that a minimally modified azide probe, produced by the introduction of an azide group, can effectively detect target proteins. Linker 1 effectively binds the azide probe to the protein, allowing for chemiluminescent detection. These data indicate that the method developed here demonstrates the superiority of small functional groups for detecting target proteins and that the detection was specific for the target protein. The method in this study was developed using a model system and may be applicable for the detection of target proteins in a mixture. This strategy facilitates the detection of proteins bound to small bioactive molecules.
Authors contributions
Study concept and design: Kosaku Takahashi. Acquisition of data: Tomoaki Anabuki, Miu Tsukahara, and Kosaku Takahashi. Analysis and interpretation of data: Tomoaki Anabuki, Miu Tsukahara, Hideyuki Matsuura, Kosaku Takahashi. Drafting of the manuscript: Hideyuki Matsuura and Kosaku Takahashi. All authors reviewed and approved the final manuscript.
Disclosure statement
No potential conflict of interest was reported by the authors.
Supplemental material
Supplemental material for this article can be accessed at http://dx.doi.org/10.1080/09168451.2015.1104240.
Anabuki_BBB_sup_1.docx
Download MS Word (78.1 KB)Acknowledgments
We thank Dr. Eri Fukushi and Mr. Yusuke Takata for collecting the mass spectral data.
Notes
Abbreviations: AOS, allene oxide synthase; AOC, allene oxide cyclase; 12,13-EOT, (12,13S)-epoxy-(9Z,11E,15Z)-octadecatrienoic acid; 13-HPOT, 13(S)-hydroperoxylinolenic acid; IPTG, isopropyl-β-d-thiogalactopyranoside; OPDA, 12-oxo-phytodienoic acid.
References
- Hashimoto M, Hatanaka Y. Recent progress in diazirine-based photoaffinity labeling. Eur. J. Org. Chem. 2008;2008:2513–2523
- Platz MS. Comparison of phenylcarbene and phenylnitrene. Acc. Chem. Res. 1995;28:487–492.
- Galardy RE, Craig LC, Printz MP. Benzophenone triplet: a new photochemical probe of biological ligand-receptor interactions. Nat. New Biol. 1973;242:127–128.
- Wallrabe H, Periasamy A. Imaging protein molecules using FRET and FLIM microscopy. Curr. Opin. Biotechnol. 2005;16:19–27.
- Bayer EA, Wilchek M. Application of avidin-biotin technology to affinity-based separations. J. Chromatogr. 1990;510:3–11.
- Bayer EA, Ben-Hur H, Wilchek M. Isolation and properties of streptavidin. Methods Enzymol. 1990;184:80–89.
- Budin G, Dimala MM, Lamour V, et al. A chemical labeling strategy for proteomics under nondenaturing conditions. ChemBioChem. 2010;11:79–82.
- Rostovtsev VV, Green LG, Fokin VV, et al. A stepwise huisgen cycloaddition process: copper(I)-catalyzed regioselective “Ligation” of azides and terminal alkynes. Angew. Chem. Int. Ed. 2002;41:2596–2599.
- Tornøe CW, Christensen C, Meldal M. Peptidotriazoles on solid phase: [1,2,3]-triazoles by regiospecific copper(I)-catalyzed 1,3-dipolar cycloadditions of terminal alkynes to azides. J. Org. Chem. 2002;67:3057–3064.
- Wang Q, Chan TR, Hilgraf R, et al. Bioconjugation by copper(I)-catalyzed azide-alkyne [3 + 2] cycloaddition. J. Am. Chem. Soc. 2003;125:3192–3193.
- Wasternack C, Hause B. Jasmonates: biosynthesis, perception, signal transduction and action in plant stress response, growth and development. An update to the 2007 review in Annals of Botany. Ann. Bot. 2013;111:1021–1058.
- Testa B, Jenner P. Inhibitors of cytochrome P-450s and their mechanism of action. Drug Metab. Rev. 1981;12:1–117.
- Murray M. Mechanisms and significance of inhibitory drug interactions involving cytochrome P450 enzymes (review). Int. J. Mol. Med. 1999;3:227–238.
- Rogerson TD, Wilkinson CF, Hetarski K. Steric factors in the inhibitory interaction of imidazoles with microsomal enzymes. Biochem. Pharmacol. 1977;26:1039–1042.
- Oh K, Murofushi N. Design and synthesis of novel imidazole derivatives as potent inhibitors of allene oxide synthase(CYP74). Bioorg. Med. Chem. 2002;10:3707–3711.
- Murai Y, Wang L, Muto Y, et al. Simple and stereocontrolled preparation of benzoylated phenylalanine using Friedel-Crafts reaction in trifluoromethanesulfonic acid for photoaffinity labeling. Heterocycles. 2013;87:2119–2126.
- Bandara PKGSS, Takahashi K, Sato M, et al. Cloning and functional analysis of an allene oxide synthase in Physcomitrella patens.Biosci. Biotechnol. Biochem. 2009;73:2356–2359
- Kajiwara A, Abe T, Hashimoto T, et al. Efficient synthesis of (+)-cis-12-oxo-phytodienoic acid by an in Vitro enzymatic reaction. Biosci. Biotechnol. Biochem. 2012;76:2325–2328..