
Abstract
We investigated whether fatty liver preceded insulin resistance or vice versa using a long-term orotic acid (OA)-induced nonalcoholic fatty liver disease (NAFLD) model without the confounding effects of obesity and hyperlipidemia and explored the role of the liver in insulin resistance. Male Wistar rats were fed with or without OA supplementation for 30, 60, and 90 days. The NAFLD group showed increased liver lipid at 30, 60, and 90 days; glucose intolerance was noted at 60 and 90 days. Furthermore, partial liver proteins and gene expressions related to upstream signaling of insulin were decreased. However, the liver glycogen content was elevated, and gluconeogenesis genes expressions were obviously decreased at 90 days. The occurrence of fatty liver preceded insulin resistance in OA-induced NAFLD without the interference of obesity and hyperlipidemia, and hepatic insulin resistance may not play a conclusive role in insulin resistance in this model.
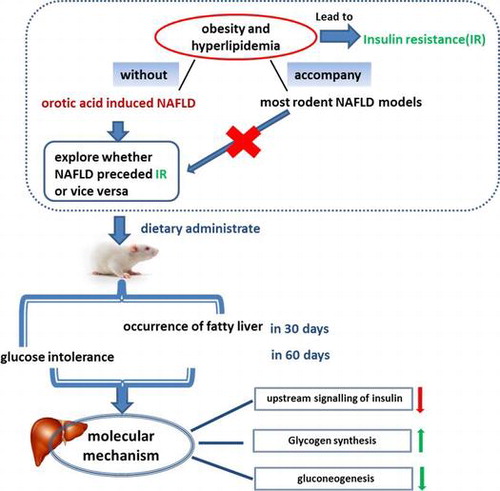
Graphical abstract
Whether fatty liver preceded insulin resistance (IR) or vice versa in a long-term orotic acid-induced NAFLD model without the confounding effects of obesity and hyperlipidemia.
Nonalcoholic fatty liver disease (NAFLD) is the most common liver disease in Western countries Citation1–3) and is increasingly being diagnosed in adults and children in developed countries.Citation4) As is known, NAFLD is strongly interrelated insulin resistance, and numerous studies have focused on exploring the relationship between fatty liver and insulin resistance, particularly NAFLD; nevertheless, this topic remains controversial. Faidon M. et al.Citation5) and Naoki K. et al.Citation6) have declared that the increasing hepatic diacylglycerol content leads to the activation of novel protein kinase C and hepatic insulin resistance. However, most of these studies were conducted on obese humans and various rodent models of obesity in NAFLD. As is known, obesity and hyperlipidemia occupy an important position in the accumulation of diacylglycerol. Besides, it has been proposed that obesity may cause insulin resistance via stimulating an inflammatory response. WAT associated with obesity contains an increasing number of macrophages, producing more proinflammatory molecules and leading to decreased insulin sensitivity and increased insulin resistance.Citation7) It has been reported that FFA has been shown to play an important contributing role in the pathogenesis of insulin resistance,Citation8) and experimental hyperlipidemia was shown to induce insulin resistance in healthy cats.Citation9) Both obesity and hyperlipidemia can lead to insulin resistance. NAFLD tends to accompanied by other diseases, including of obesity, dyslipidemia, and hypertension, all of which are characters of metabolic syndrome.Citation10–14) It is difficult to figure out that it is the fatty liver or the obesity leads to the insulin resistance. Thus, it is still necessary to explore the relationship between fatty liver and insulin resistance in an NAFLD model without the interference of obesity and hyperlipidemia. Insulin resistance usually accompanies obesity and hyperlipidemia in most rodent NAFLD models. Therefore, a suitable study model is needed to investigate the relationship between insulin resistance and NAFLD.
Fatty liver induced by OA in rats was first observed by Standerfer and Handler and was confirmed in many subsequent studies.Citation15) In addition, Zhang et al.Citation16) showed that rats fed an OA diet developed severe NAFLD without obesity and hyperlipidemia, and the model was suitable to explore the role of insulin resistance in NAFLD. Most previous studies have demonstrated that lipid accumulation within hepatocytes induced by OA in rats resulted from the stimulation of lipogenesis, inhibiting fatty acid β-oxidation and reducing lipoprotein secretion in the liver.Citation17,18) Although the mechanism of OA inducing fatty liver is becoming increasing clear, how insulin resistance acts as a crucial character in NAFLD in this model remains unclear.
Here, we investigated whether NAFLD preceded insulin resistance or vice versa in a long-term OA-induced NAFLD model without the confounding effects of obesity and hyperlipidemia. To this end, we determined the hepatic lipid changes, serum lipid levels, liver function indexes, and glucose tolerance in long-term OA-induced NAFLD in rats. Whether hepatic insulin resistance plays an important part in the pathology of NAFLD is controversial, and several new reports have arrived at different conclusions.Citation19–21) We explored whether hepatic insulin resistance induced glucose intolerance in OA-induced NAFLD and compared the difference in the insulin signaling pathway between rats with severe insulin resistance and those at the pre-insulin resistance stage. The expression of genes involved in lipogenesis, insulin signaling, gluconeogenesis, and glycogen synthesis, as well as the expression of the major proteins of insulin signaling, gluconeogenesis and glycogen synthesis, was measured to elucidate the molecular mechanisms.
Materials and methods
Animals and diets
All of the animal procedures were approved and performed in accordance with the guidelines provided by the ethical committee of experimental animal care at Ocean University of China (Qingdao, China). Male Wistar rats 8 weeks of age were purchased from Vital River (Beijing, China). The rats were housed individually throughout the feeding experiment in a room maintained at a 12-h light/dark cycle and a constant temperature of 22 ± 2 °C. After a 5-day adaptation, the rats were divided into three groups (fourteen rats each), and each group was subdivided into two groups, including a normal control (Con) and OA-induced NAFLD group (OA-FLD). Rats of the six groups had the same mean body weight, and each group comprised seven rats. Basal diets were purchased from Vital River (Beijing, China). The OA diets were prepared by supplementation with 1.0% OA in the basal diet. All of the rats had free access to tap water and food (ad libitum), and the rats were killed by bleeding from the abdominal aorta after overnight fasting for 30, 60, and 90 days. The serum was separated from whole blood by centrifugation at 4000 g for 15 min at 4 °C. Livers and adipose tissue were weighed and stored at −80 °C until analysis.
Intraperitoneal glucose tolerance tests
The rats which were killed in 30, 60, and 90 days were subjected to the intraperitoneal glucose tolerance test (IPGTT) on Day 24, Day 54, and Day 84, respectively, according to the method described by Padiya et al.Citation22). Briefly, glucose (2.0 g/kg body weight) was administered after a 10-h fast. Blood was collected from the tail tip at 0, 30, 60, and 120 min after the glucose administration. The serum was separated from whole blood by centrifugation at 4000 g for 15 min at 4 °C. Serum glucose and insulin levels were determined using a diagnostic kit (Biosino, Beijing, China) and commercial rat enzyme-linked immunosorbent assay kits (Merck Millipore, Billerica, USA), respectively.
Analysis of hepatic lipids, liver glycogen, and serum parameters
Hepatic lipids were extracted using the modified method of Folch et al.Citation23) and hepatic phospholipid levels were measured according to the method of Bartlett.Citation24) The concentrations of triglyceride (TG) and total cholesterol (TC) in the liver and serum (Biosino, Beijing, China), serum aspartate aminotransferase (AST), and alanine aminotransferase (ALT) levels (Jiancheng Bioengineering Institute, Nanjing, China) were determined using enzymatic reagent kits. The hepatic glycogen content was measured by chemical methods according to the protocol supplied (Jiancheng Bioengineering Institute, Nanjing, China).
RNA isolation and quantitative real-time PCR
RNA isolation was performed using Trizol Reagent (Invitrogen, USA). cDNA were reverse transcribed from RNA using random primer (TOYOBO, Japan) and M-MLV (Promega, USA). The cDNA was analyzed using the iQ5 Multicolor Real-Time PCR Detection System (Biorad, USA) and the SYBR Green I Master Mix (Roche); each sample was normalized to the 18S ribosomal RNA to determine the relative expression levels. The mRNA expression levels of the insulin signaling pathway components were measured, including insulin receptor substrate1 (IRS1), IRS2, phosphatidylinositol 3-hydroxy kinase (PI3 K), protein kinase B (AKT2), fork head transcription factor (FOXO1), peroxisome proliferator-activated receptor γ coactivator-1α(PGC1-α),glucose transporter2 (GLUT2),phosphoenolpyruvate carboxylinase (PEPCK), glucose-6-phosphatase (G6Pase), fructose-1,6-bisphosphatase (FBPase), pyruvate carboxylase (PC), glycogen synthase2 (GSY2), and glycogen synthase kinase 3β(GSK-3β), as well as lipogenesis sterol regulatory element binding protein 1c (SREBP1-c), fatty acid synthase (FAS), and acetyl-coA carboxylase (ACC) in the liver. The sequences for the primer pairs used in this study are listed in Table .
Table 1. Growth parameters, serum lipids, liver lipids, and liver function indexes in Wistar rats with regular chow and orotic acid feeding.
Western blotting
Frozen livers were homogenized on ice in RIPA buffer, and the homogenates were centrifuged. The proteins were subjected to SDS--PAGE transferred to polyvinylidene fluoride membranes (Merck Millipore, Billerica, USA), and the membranes were incubated with the antibodies against IRβ, IRS1, AKT, phosphor-Akt at Ser473 (p-Akt Ser473), PI3 K-p85, FOXO1, GSK3α/β, phosphor-GSK3α/β, anti-rabbit, or GlUT2, followed by anti-rabbit IgG HRP-linked antibody (all from Cell Signaling Technology) or goat anti-mouse IgG HRP-linked antibody (Santa Cruz Biotechnology). Normalization of protein expression was carried out. Bands were visualized using a chemiluminescence detection system and a traditional X-ray film imaging system.
Statistical analyses
All values are expressed as the mean ± SEM. The means of the two groups were compared by Student’s t test for each experiment, and p < 0.05 was considered to be statistically significant.
Results
OA fatty liver is not involved in hyperlipidemia and obesity
The NAFLD group showed a significant increase in the liver mass during the experiment (Table ). However, the body weight changed little in the two groups and the serum TG and TC levels in the NAFLD group showed downward trends compared with the normal control (Table ). As shown in Table , after 30, 60, and 90 days, the hepatic triglyceride content in the NAFLD group was elevated to 3.0, 5.4, and 12.5-fold, respectively, compared with control animals. In addition, there was an up-regulation in the hepatic cholesterol content, particularly after 90 days of feeding (Table ). However, there was no difference in the hepatic phospholipid content between the two groups (Table ). No change was observed in the serum AST and ALT concentrations (Table ).
Long-term fatty liver leads to severe glucose intolerance and an abnormal serum insulin level
To investigate whether the rats would show an initial abnormal glucose metabolism and when they would exhibit impairment, we examined glucose tolerance and the serum insulin level. Compared with the normal control rats, the rats with NAFLD still showed a normal response to glucose tolerance in 30 days (Fig. (A)), but showed impaired glucose tolerance at 60 and 90 days, and the latter time point was associated with more severe impairment, particularly at 120 min (Fig. (A) and (B)). From the area under the curve results, as shown in Fig. (D), we observed that the NAFLD group showed a significant increase compared with the normal control at 90 days (p = 0.020), but a slight increase at 60 days (p = 0.051).
Fig. 1. The rats developed severe glucose intolerance and an abnormal serum insulin level at 60 days and a more serious impairment at 90 days. IPGTT at 30 days (A), 60 days (B), and 90 days (C). (D) The area under the curve involved in the IPGTT. The blood insulin curves in the IPGTT at 30 days (E), 60 days (F), and 90 days (G).
Fig. 2. The expressions of fatty acid synthesis gene products, including (A) SREBP1-c, (B) FAS, and (C) ACC, showed an up-regulation tendency after the OA diet and was analyzed by qRT-PCR. β-Actin served as the loading control.
Fig. 3. The molecular expressions related to insulin signaling exhibited a more substantial decrease at 90 days than that at 30 days in the NAFLD group. The protein expressions of (A) IRβ, (B) IRS1, (C) PI3 K-p85, and (D) AKT and the phosphorylation level of AKT involved in the liver insulin signaling pathway were analyzed by Western blotting. The corresponding gene expression levels of (E) IRS1, (F) IRS2, (G) PI3 K, and (H) AKT2 were measured by qRT-PCR.
Fig. 4. The glucose uptake and glycogen concentration in the liver showed different changes at 30 and 90 days, respectively. (A) The liver glycogen content at 30 and 90 days. The protein levels of (B) GLUT2 and (D) GSK3 and the (F) phosphorylation level of GSK3 were measured by Western blotting. The gene expression levels of (C) GLUT2, (E) GSY2, and (G) GSK3β were measured by qRT-PCR.
Fig. 5. Liver gluconeogenesis was inhibited at 90 days and showed no significant difference at 30 days in the NAFLD group. The protein and gene expressions involved in liver gluconeogenesis were measured by qRT-PCR and Western blotting, respectively. (A) The protein expression of FOXO1 and (B) gene expressions of FOXO1, (C) PGC1-α, (D) PEPCK, G6Pase, FBPase and PC.
We determined the insulin levels during IPGTT. The two groups displayed no difference in the serum insulin level at 30 days (Fig. (E)), but the rats with NAFLD showed a significantly higher serum insulin level at the 0 and 30 min node at both 60 and 90 days as well as at the 90-min node at 90 days (Fig. (F) and (G)).
Up-regulation of hepatic fatty acid synthesis gene expression in OA-induced NAFLD
Compared with the normal control, the gene expression of FAS and ACC, the key enzymes involved in the fatty acid synthesis, increased by 103 and 71.4% respectively, at 30 days and exhibited significantly greater increases at 90 days with a percentage of 366 and 95.7%, respectively (Fig. (B) and (C)). Moreover, the SREBP-1c mRNA was up-regulated by 152% at 30 days and 150% at 90 days (Fig. (A)). The significant increase in fatty acid synthesis at both 30 and 90 days indicated the exaggerated fat synthesis responses in the liver during fatty liver development.
The molecular expression related to hepatic insulin signaling was decreased
As the data shown in Fig. (A) and (B), the obvious suppression of IRβ protein expression and down-regulation tendency of IRS1 protein expression were observed in the NAFLD group at both 30 and 90 days. Additionally, the protein expression of IRβ showed a more significant decrease at 90 days (p < 0.001) than at 30 days (p < 0.05). Although the protein level of PI3 K and its downstream effector AKT showed no significant differences, both were mildly increased in the NAFLD group compared with the normal control at 30 days and showed a downward trend at 90 days (Fig. (C) and (D)). Insulin-stimulated Ser473-AKT phosphorylation was greatly increased at 30 days and showed no significant differences between the two groups after 90 days (Fig. (D)). The rats showed no obvious differences in the gene expression levels of IRS1, IRS2, and AKT2 after feeding for 30 days, and all of the genes were down-regulated remarkably in the NAFLD group at 90 days (Fig. (E), (F) and (H)). However, the PI3 K gene expression increased remarkably at both 30 and 90 days (Fig. (G)). Together, the protein and gene expression related to insulin signaling showed a more substantial decrease overall at 90 days compared with that at 30 days, explaining the disorder glycometabolism on the molecular level to some extent.
Hepatic glycogen is accumulated significantly at 90 days in the NAFLD group
Glucose uptake and the phosphorylation and activation states of related enzymes are the two steps involved in insulin regulation of the synthesis of glycogen in the liver.Citation25) Particularly, as shown in Fig. (B), the Western blot analysis results showed an increase in GLUT2 in the NAFLD group after 30 days (p < 0.05), with an increasing effect after another 60 days (p < 0.001). The gene expression level of GLUT2 also showed an up-regulation trend despite no significant change after feeding for 30 and 90 days (Fig. (C)).
In contrast to the normal control, the glycogen content was elevated by 2-fold in the NAFLD group at 90 days (p < 0.001), and no obvious change was noted after 30 days (Fig. (A)). GSK3 phosphorylation inactivates itself, preventing the inhibition of glycogen synthase and increasing glycogen synthesis in the liver.Citation26) Despite the remarkable accumulation in the liver glycogen content, no statistically significant difference was observed in protein level of GSK3 and phosphorylation level of P-GSK3 (Fig. (D) and (F)) during the experiment. At the genetic level, the mRNA levels of GYS2 (Fig. (E)) and GSK3β (Fig. (G)) were not changed remarkably, results that were in accordance with the protein expression. The glucose uptake was accelerated at 30 days with continuous enhancement in the subsequent 60 days. Additionally, the OA supplementation failed to alter glycogen synthesis at 30 days and elevated the glycogen content mainly at 90 days.
Liver gluconeogenesis is inhibited significantly at 90 days in the NAFLD group
The protein expression of FOXO1, a substrate of Akt kinase, was measured to investigate the change in gluconeogenesis. The protein expression of FOXO1 was partly reduced after feeding for 30 days and 90 days, with lower level at 90 days, only half of the normal control level (Fig. (A)). Additionally, the FOXO1 and PGC-1α, the transcriptional coactivator of FOXO1 involved in gluconeogenesis, and the downstream signaling genes, including of PEPCK, G6Pase, FBPase, and PC, had an analogous change in gene expressions with a conspicuously decrease at 90 days, but no difference at 30 days (Fig. (B–D)). Gluconeogenesis was unchanged after starting the experiment for 30 days; with another 60 days of feeding, the rats developed reduced gluconeogenesis.
Discussion
There is increased focus on studying whether NAFLD is strongly associated with hepatic insulin resistance in the most frequent chronic liver disease NAFLD in Western countries.Citation10,27–29) Nevertheless, this topic remains controversial. We explored the development of insulin resistance in fatty liver in classical NAFLD model without obesity and hyperlipidemia induced by OA administration, trying to further investigate the mechanism of insulin resistance in a simplified model. Previous studies have demonstrated that the rats developed significantly fatty liver in 10 days in the model of OA-induced NAFLD.Citation16,18 As expected, the rats developed fatty liver in 30 days (Table ), and the effect was increasing continuously during the experiment. However, the rats showed a normal response to glucose at 30 days (Fig. (A)), but conspicuous impairment in glucose tolerance at 60 days and more severe impairment at 90 days (Fig. (B) and (C)), demonstrating that insulin resistance was not generated during the primary stages of fatty liver without interference from obesity and hyperlipidemia. This result suggests that fatty liver leads to insulin resistance in the model of OA-induced NAFLD.
As to this model, there have been several studies about the mechanism involved in the liver lipid accumulation, whereas mechanism of liver insulin resistance is rarely reported. Additionally, the liver is an important target organ for insulin. Thus, this study explored the possible mechanism of liver insulin resistance in the model of OA-induced NAFLD. As is shown from the data, the protein and gene expression related to insulin signaling showed a substantial decrease overall at 90 days compared with that at 30 days, explaining the disorder glycometabolism on the molecular level to some extent. In consideration of the impaired upstream signaling of insulin in the liver, we speculated that insulin resistance may be concerned with the liver and determined the proteins and gene expression that were involved in the downstream signaling pathway.
Glycogen synthesis and gluconeogenesis are the main responses of insulin in the liver to regulate glucose metabolism.Citation30) The glucose uptake was accelerated at 30 days with continuous enhancement in the subsequent 60 days. Additionally, the OA supplementation failed to alter glycogen synthesis at 30 days and elevated the glycogen content mainly at 90 days. In summary, the liver glucose uptake was promoted, and liver gluconeogenesis was suppressed to decrease the blood sugar with the contrast before and after severe insulin resistance. Considering the decrease in upstream insulin signaling, the promotion of liver glycogen synthesis and suppression of liver gluconeogenesis in this model showed a paradox involved in the regulatory effect on blood sugar in the liver. Numerous lines of evidence have confirmed that the activation of the AMP-activated protein kinase (AMPK) signaling pathway, which may act in an insulin-independent manner,Citation31) can inhibit liver gluconeogenesis through the repression the PEPCK and G6Pase gene expression.Citation31–33) In this model, the decreasing of PEPCK and G6Pase gene expression at 90 days (Fig. (D)) in the NAFLD group explaining the paradox in the insulin signaling pathway to some extent.
In summary, the rats developed severe glucose intolerance and abnormal insulin levels, but not severe hepatic insulin resistance in OA-induced NAFLD. The results implicated that there may be something important as the missing link involved in insulin resistance in the model of OA-induced NAFLD. Akihiro Asai et al.Citation34) showed that peripheral rather than hepatic insulin resistance plays a dominant factor in the pathophysiology of NAFLD in high-fat and high-carbohydrate diet-induced NAFLD. Ken-ichiro Kato et al.Citation19) declared that liver steatosis is associated with insulin resistance in skeletal muscle rather than in the liver in patients with nonalcoholic fatty liver disease. However, the liver, skeletal muscle, and adipose tissue involved in insulin resistance is a network, and these components interact with each other. Both Ko KotaniCitation35) and Birkenfeld et al.Citation36) mentioned that the loss of insulin-stimulated muscle glucose uptake induced hepatic insulin resistance. The impairment of glucose transport in muscle leads to the compensatory hyperinsulinemia, a finding that corresponds to our data (Fig. ), resulting in the rerouting of substrates toward the liver. The long-term overload of hepatic glucose, which was shown in Fig. (B) may lead to the impairment of insulin sensitivity and damage of the insulin signaling pathway. In general, in parallel with the hypothesis of Birkenfeld,Citation36) we speculate that muscle insulin resistance appears before liver insulin resistance and that the former promotes the latter to some extent in OA-induced NAFLD.
In conclusion, fatty liver occurred prior to insulin resistance during the development of OA-induced NAFLD without obesity and hyperlipidemia. Although upstream insulin signaling in the liver is decreased partly after the occurrence of insulin resistance, liver glycogen accumulated significantly despite no significant difference in the relative protein and gene expressions, and liver gluconeogenesis was inhibited with the down-regulation of the corresponding proteins and genes indicate that hepatic insulin resistance may not play a conclusive role in insulin resistance of OA-induced NAFLD. A further study is required to define the complicated mechanism involved in insulin resistance in OA-induced NAFLD.
Author contribution
Yuming Wang designed and supervised the research with the assistance of Changhu Xue and Teruyoshi Yanagita. Xiuqing Han and Chunhua Liu performed the experiments and analyzed the data. Xiuqing Han wrote the manuscript. Yong Xue and Jingfeng Wang contributed special experiment site and part essential material.
Disclosure statement
No potential conflict of interest was reported by the authors.
Funding
This work was supported by the National Natural Science Foundation of China(NSFC)-Shandong Joint Fund for Marine Science Research Centers [grant number U1406402]; the State Key Program of National Natural Science of China [grant number 31330060]; National Natural Science Foundation of China [grant number 31371757].
Supplemental material
The supplemental material for this paper is available at http://dx.doi.org/10.1080/09168451.2015.1123608.
Supplementary_Table_S1.docx
Download MS Word (19.7 KB)Related Research Data
References
- Schaffner F, Thaler H. Nonalcoholic fatty liver disease. Prog. Liver Dis. 1986;8:283–298.
- Kotronen A, Yki-Järvinen H. Fatty Liver: A novel component of the metabolic syndrome. Arterioscler. Thromb. Vasc. Biol. 2007;28:27–38.10.1161/ATVBAHA.107.147538
- Bedogni G, Miglioli L, Masutti F, et al. Prevalence of and risk factors for nonalcoholic fatty liver disease: The dionysos nutrition and liver study. Hepatology. 2005;42:44–52.10.1002/(ISSN)1527-3350
- Cohen JC, Horton JD, Hobbs HH. Human fatty liver disease: old questions and new insights. Science. 2011;332:1519–1523.10.1126/science.1204265
- Faidon M, Xiong S, David B, et al. Intrahepatic diacylglycerol content is associated with hepatic insulin resistance in obese subjects. Gastroenterology. 2012;142:1444–1446.
- Naoki K, Derek ME, Dongyan Z. Cellular mechanism of insulin resistance in nonalcoholic fatty liver disease. Proc. Natl. Acad. Sci. USA. 2011;108:16381–16385.
- Fantuzzi G. Adipose tissue, adipokines, and inflammation. J. Allergy Clin. Immunol. 2005;115:911–919.10.1016/j.jaci.2005.02.023
- Boden G. Free fatty acids-the link between obesity and insulin resistance. Endocr. Pract. 2001;7:44–51.10.4158/EP.7.1.44
- Nishii N, Maeda H, Murahata Y, et al. Experimental hyperlipemia induces insulin resistance in cats. J. Vet. Med. Sci. 2012;74:267–269.10.1292/jvms.11-0266
- Després Jean-Pierre, Lemieux Isabelle. Abdominal obesity and metabolic syndrome. Nature. 2006;444:881–887.10.1038/nature05488
- Chen W, Yu M, Zhu M, et al. Clinical analysis on metabolic syndrome in the elderly cadres. J. Shanghai Med. 2004;31:199–201.
- Wilson PW, D’Agostino RB, Parise H, et al. Metabolic syndrome as a precursor of cardiovascular disease and type 2 diabetes mellitus. Circulation. 2005;112:3066–3072.10.1161/CIRCULATIONAHA.105.539528
- Elena VK, Natalia ET, Alla VR. Gender differences in lipid metabolism of the young patients with metabolic syndrome longtime living in the North. Life Sci J. 2014;11:270–274.
- Mohamed A, François RJ. Metabolic syndrome and nonalcoholic fatty liver disease: Is insulin resistance the link? Mol. Cell. Endocrinol. 2015;S0303–7207:00094–00095.
- Standerfer SB, Handler P. Fatty liver induced by orotic acid feeding. Exp. Biol. Med. 1955;90:270–271.10.3181/00379727-90-22005
- Zhang B, Xue C, Hu X, et al. Dietary sea cucumber cerebroside alleviates orotic acid-induced excess hepatic adipopexisin rats. Lipids Health Dis. 2012;8:11–48.
- Cha JY, Mameda Y, Yamamoto K, et al. Association between hepatic triacylglycerol accumulation induced by administering orotic acid and enhanced phosphatidate phosphohydrolase activity in rats. Biosci. Biotechnol. Biochem. 1998;62:508–513.10.1271/bbb.62.508
- Wang Y, Hu X, Xue Y, et al. Study on possible mechanism of orotic acid–induced fatty liver in rats. Nutrition. 2011;27:571–575.10.1016/j.nut.2010.03.005
- Ken-ichiro K, Yumie T, Hirofumi M, et al. Liver steatosis is associated with insulin resistance in skeletal muscle rather than in the liver in Japanese patients with non-alcoholic fatty liver disease. J. Diabetes Investig. 2015;6:158–163.
- Asai A, Chou PM, Bu HF, et al. Dissociation of hepatic insulin resistance from susceptibility of nonalcoholic fatty liver disease induced by a high-fat and high-carbohydrate diet in mice. Am. J. Physiol. Gastrointest. Liver Physiol. 2014;306:G496–G504.10.1152/ajpgi.00291.2013
- Samuel VT1, Liu ZX, Qu. X, et al. Mechanism of hepatic insulin resistance in non-alcoholic fatty liver disease. J. Biol. Chem. 2004;279:32345-32353.10.1074/jbc.M313478200
- Padiya R, Khatua TN, Bagul PK, et al. Banerjee garlic improves insulin sensitivity and associated metabolic syndromes in fructose fed rats nutrition and metabolism. Nutr. Metab. (Lond). 2011;27:8–53.
- Folch J, Lees M, Sloane Stanley GH. A simple method for the isolation purification of total lipids from animal tissues. J. Biol. Chem. 1957;226:497–509.
- Bartlett GR. Phosphorous assay in column chromatography. J. Biol. Chem. 1959;234:466–468.
- Cohen P. Control of Enzyme Activity. New York, NY: Chapman and Hall; 1983.10.1007/978-94-009-5981-1
- Cohen P, Frame S. The renaissance of GSK3. Nat. Rev. Mol. Cell Biol. 2001;2:769–776.10.1038/35096075
- Angulo P. Nonalcoholic fatty liver disease. N. Engl. J. Med. 2002;346:1221–1231.10.1056/NEJMra011775
- Fabbrini E, Sullivan S, Klein S. Obesity and nonalcoholic fatty liver disease: biochemical, metabolic, and clinical implications. Hepatology. 2010;51:679–689.10.1002/hep.23280
- Shulman GI. Cellular mechanisms of insulin resistance. J. Clin. Invest. 2000;106:171–176.10.1172/JCI10583
- Srivastava AK, Pandey SK. Potential mechanism(s) involved in the regulation of glycogen synthesis by insulin. Mol. Cell. Biochem. 1998;182:135–141.10.1023/A:1006857527588
- Lochhead PA, Salt IP, Walker KS, et al. 5-aminoimidazole-4-carboxamide riboside mimics the effects of insulin on the expression of the 2 key gluconeogenic genes PEPCK and glucose-6-phosphatase. Diabetes. 2000;49:896–903.10.2337/diabetes.49.6.896
- Lee JM, Seo WY, Song KH. AMPK-dependent repression of hepatic gluconeogenesis via disruption of CREB CRTC2 complex by orphan nuclear receptor small heterodimer partner. J. Biol. Chem. 2010;285:32182–32191.10.1074/jbc.M110.134890
- Barthel A, Schmoll D. Novel concepts in insulin regulation of hepatic gluconeogenesis. Am. J. Physiol. Endocrinol. Metab. 2003;285:E685–E692.10.1152/ajpendo.00253.2003
- Asai A, Chou PM, Bu HF. Dissociation of hepatic insulin resistance from susceptibility of nonalcoholic fatty liver disease induced by a high-fat and high-carbohydrate diet in mice. Am. J. Physiol. Gastrointest. Liver Physiol. 2014;306:G496–G504.10.1152/ajpgi.00291.2013
- Kotani K, Peroni OD, Minokoshi Y, et al. GLUT4 glucose transporter deficiency increases hepatic lipid production and peripheral lipid utilization. J. Clin. Invest. 2004;114:1666–1675.10.1172/JCI200421341
- Birkenfeld AL, Shulman GI. Nonalcoholic fatty liver disease, hepatic insulin resistance, and type 2 diabetes. Hepatology. 2014;59:713–723.10.1002/hep.v59.2