Abstract
Two metallothionein genes (HsMT1 and HsMT2) were first identified and described from Hyriopsis schlegelii. The open reading frame of HsMT1 and HsMT2 were 216 and 222 bp, encoding a protein of 71 and 73 amino acid residues. The deduced amino acid sequences showed they contained parts of typical MT characteristics, apart from HsMT2 lacked Cys–Cys motifs. The phylogenetic tree showed HsMT1 shared a high similarity with that of other molluscs, but HsMT2 was split into a distinct group separated from known molluscan MTs. HsMT1 exhibited constitutive expression in all examined tissues and the highest expression occurred in hepatopancreas, however, nearly all HsMT2 was just detected in gonad. After Cd exposure, their mRNA levels presented similar expression patterns. The transgenic bacteria of HsMT1 showed higher tolerance than HsMT2 in Cd environment. It was implied that HsMT1 and HsMT2 were involved in metal response but HsMT2 might have other physiological functions.
Graphical Abstract
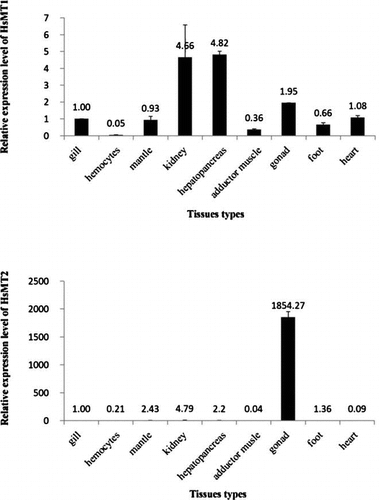
HsMT1 exhibited constitutive expression in all examined tissues and the highest expression occurred in hepatopancreas, however, nearly all HsMT2 was just detected in gonad.
Metallothioneins (MTs) are cysteine-rich, low molecular weight, inducible proteins in which cysteine confers substantial metal binding capabilitiesCitation1) and possess multiple forms. Distinct MT isoforms are widely distributed and have been identified in marine invertebrate animals, as in the snail Helix pomatiaCitation2); Mytilus edulisCitation3); Crassostrea virginicaCitation4); Laternula ellipticaCitation5); and Argopecten irradians.Citation6) The existence of different MT subfamilies in molluscs or different isoforms within subfamilies may exhibit different regulatory specificities in their promoter regions and a divergence in cellular function.Citation7) Increased MT synthesis is associated with increased capacity for binding metals and increased resistance to metal toxicity.Citation3)
Cadmium (Cd) is one sort of toxic heavy metals and a non-essential element distributed wildly and ubiquitously in the aquatic systems.Citation8) Even low dosage of Cd acts as potentially highly toxic substance to plants, animals, and humans. Excessive Cd accumulation in tissues stimulates the formation of reactive oxygen species causing lipid peroxidation, protein denaturation, and DNA damage.Citation9) Some researches had dedicated to the diversity of Cd-inducibility and expression in different MT isoforms in bivalves.Citation7,10,11) To further understand this multiplicity of molluscan MT functions, more genes sequence data as well as the knowledge of their expression patterns about freshwater pearl mussel are required.
Hyriopsis schlegelii, which was introduced into China from the Lake Biwa of Japan, is a commercially important aquaculture species of freshwater mussel used for pearl production. Due to their filter feeding habits, bivalves are directly and unavoidably threatened by heavy metals.Citation12) The levels of heavy metals in the environment can be assessed by analyzing water, sediments, and organisms.Citation6) Molluscs are the most reliable tools for identifying sources of biologically available heavy metal contamination.Citation6) In this study, we used H.schlegelii as a model animal to clone MT genes and explore their distribution profiles when it was exposed to Cd. Study of the structural characteristics and expression patterns of MT genes is essential for a better understanding of the functional multiplicity and the utilization of these MTs if they could serve as bioindicators of exposure to contaminants. The main objective of our study was (1) identification of MT gene coding sequence; (2) assess its expression pattern in adult tissues, as well as its distribution profile in mantle, gonad, and kidney under Cd exposure; (3) metal tolerance conferred of MT in vitro.
Materials and methods
Samples and heavy metal exposure
Healthy individuals of the H. Schlegelii with averaging 150.0 ± 10.4 mm in shell length were collected from Fuzhou Hongmen Reservoir Exploitation Corporation of Jiangxi Province in China. Permission to use H. schlegelii and conduct recombinant DNA experiments were authorized by the committee of College of Life Science, Nanchang University, Jiangxi, China. They were acclimatized at 23 ± 2 °Cin aerated freshwater for one week before the exposure. Eighteen shells as experimental group were exposed to water containing Cd (CdCl2·2.5H2O, 5 ppm). In the control group (n = 18), ultrapure distilled water was added in the same volume as the treatment group. The Cd concentration was based on the previous report of MT induction in response to Cd exposure in fish.Citation13, 14, 27) The experimental shells were sampled at 0, 6, 12, 24, 48, and 96 h (n = 3 at each time point) and three tissues (mantle, gonad, and kidney) were dissected for MT mRNA quantification.
Total RNA extraction and cDNA synthesis
The total RNA extraction was performed after grinding the tissue under the liquid nitrogen, using Trizol Reagent (Invitrogen) according to the manufacturer’s protocol, and then it was dissolved in 50–l00 μL RNase-Free Water. The preliminary quantity and purity of the extracted RNA were measured at 260 and 280 nm by Micro-spectrophotometer (Thermo) and RNA integrity was checked using 1% agarose gel electrophoresis. The RNA preparation was submitted to RNase-free DNaseI and RNAase inhibitor (Promega) treatment to remove remnant genomic DNA and the isolated RNA was stored at -80 °C for cDNA synthesis.
EST analysis and cloning of the full-length cDNA of HsMT
Two gonad transcriptomes were constructed from H. schlegelii by our laboratory. BLAST (NCBI) analysis of all the EST sequences revealed that two of them were homologous to previously identified MTs, and these two EST sequences were selected for further HsMT gene cloning.
Primers were designed based on the two EST sequences to clone the full-length cDNA of HsMT. The first cDNA strand for getting 5′ end sequence was synthesized using SuperScript Reverse Transcriptase (Invitrogen) and 5′CDS and SMART Oligo (Table ) with 3 μg of total RNA as template. Thus, using reverse transcriptase and 3′CDS (Table ) obtained the first cDNA strand for 3′ end sequence.
Table 1. Primers used in this study.
PCR reaction to get 5′ end of HsMT cDNA was performed in a Thermal Controller Cycler (Ependoff) using forward primer (MT1-5′-GSP for MT1 5′-UTR (Untranslated Region);MT2-5′-GSP for MT2 5′-UTR) and reverse primer (mixture of UPM-long and UPM-short primers, ratio 1:4) (Table ) in a 50 μL reaction volume containing 5.0 μL of 10 × PCR Ex taq buffer (25 mM Mg2+ plus), 2.0 μL dNTP (2.5 mM), 2.0 μL of each primer (10 μM), 33.6 μL of double-distilled water, 0.4 μL (2.0 U) of Ex taq (Takara), and 2 μL of cDNA. The PCR profile was as follows: initial denaturation at 95 °C for 5 min, followed by 35 cycles of 95 °C for 30 s, 65 °C for 30 s, and 72 °C for 30 s, then a final extension step at 72 °C for 10 min.
While the 3′ end of the HsMT cDNA was obtained using forward primer (MT1-3′-GSP for MT1 3′-UTR;MT2-3′-GSP for MT2 3′-UTR) and reverse primer (mixture of UPM-long and UPM-short primers, ratio 1:4) (Table ). PCR conditions: initial denaturation at 95 °C for 5 min, followed by 35 cycles of 95 °C for 30 s, 65 °C for 30 s, and 72 °C for 30 s, then a final extension step at 72 °C for 10 min. The PCR products were gel-purified, cloned into the pMD-19T simple vector (Takara), then transformed into E. coli DH5α competent cells and sequenced in both directions. Cluster analysis was performed to overlap the 5′ and 3′ end with EST to get the cDNA sequence. The sequence was subjected to the homology analysis.
Sequence analysis
Searches for nucleotide and protein sequence similarities were conducted with BLAST algorithm at the National Center for Biotechnology Information (http://www.ncbi.nlm.nih.gov/BLAST/). The protein domain was predicted with the simple modular architecture research tool (SMART) version 4.0 program (http://wwwsmart.emblheidelberg.de/). Multiple alignment of HsMT was performed with the ClustalW Multiple Alignment program (http://www.ebi.ac.uk/clustalw/). Phylogenetic tree was constructed with MEGA program version 3.1 based on amino acids alignment.
Cloning of HsMT into pET32a
The coding region of HsMT was amplified by PCR with a pair of specific primers (MT1-orf-forward and MT1-orf-reverse for MT1;MT2-orf-forward and MT2-orf-reverse for MT2) (Table ). PCR reaction was performed in a 50 μL of reaction volume, containing 5.0 μL of 10 × PCR Ex taq buffer (25 mM Mg2+ plus), 2.0 μL dNTP (2.5 mM), 2.0 μL of each primer (10 μM), 33.6 μL of double-distilled water, 0.4 μL (2.0 U) of Ex taq (Takara), and 2 μL of template. The amplification reaction was performed as follows: 95 °C for 5 min and 35 cycles of 95 °C for 30 s, 65 °C for 30 s, and 72 °C for 30 s, then a final extension step at 72 °C for 10 min. The PCR products were separated by agarose gel (1%) electrophoresis, and the bands were excised and purified using a DNA Gel Etraction Kit (Sangon Biotech). Then the purified DNA fragments were digested with BamH I and Xho I and inserted into the pET32a vector cleaved with the same restriction enzymes. Orientation and correct amino acid sequences of the recombinant plasmids were confirmed by sequencing. Then, the recombinant plasmids were transformed into E.coli BL21 (DE3) competent cells for further metal resistance analysis.
Metal tolerance analysis of genetically modified E. coli BL21 (DE3) with HsMT1 or HsMT2
To investigate metal tolerance of transformed E. coli, bacterial growth of E. coli BL21 (DE3) transformed with pET32a/HsMT1 or pET32a/HsMT2 was compared with the same strain bearing the control plasmid pET32a vector alone. An overnight culture of E. coli cells was diluted 100-fold in fresh LB medium containing 100 μg/mL of ampicillin. Meanwhile, 1 mM isopropgl-1-thio-β-D-galactopyranoside was added into culture containing 500 μM and 1000 μM Cd when optical density (OD) at 600 nm reached about 0.5–1.0. Bacterial growth was monitored by OD600 measurements at 2 h intervals for 10 h. Each sample was analyzed in duplicate.
Expression pattern of HsMT in different tissues
For the tissue distribution analysis, total RNA was extracted from gill, hemocytes, mantle, kidney, hepatopancreas, adductor muscle, gonad, foot, and heart. The first-strand cDNA synthesis was carried out according to the manufacture’s instruction of SuperScript Reverse Transcriptase kit (Invitrogen) using 3′CDS (Table ) as primer and the DNaseI (Promega)-treated total RNA as template. cDNA mixture was diluted to 1:5 and stored at -20 °C for subsequent Real-time RT-PCR.
Two pairs of HsMT1 and HsMT2 specific primers, MT1-forward/reverse and MT2-forward/reverse (Table ), were used to amplify a product of 240 and 244 bp from cDNA, and the PCR product was sequenced to verify the specificity of RT-PCR. Two β-actin primers, β-actin-forward and β-actin-reverse, were used to amplify corresponding PCR products as an internal control to verify the successful transcription and to calibrate the cDNA template for correspond samples.
The real-time quantitative PCR was performed in triplicate for a total volume of 20 μL containing 10 μL of SYBR Green PCR Master Mix (Life Technologies corporation), 0.7 μL of cDNA, 0.4 μL of each primer, and 8.5 μL of double-distilled water. The real-time quantitative PCR program consisted of denaturation step at 95 °C for 5 min, followed by 40 cycles of 25 s denaturation at 95 °C, 25 s annealing at 55 °C (HsMT1) / 54 °C (HsMT2), and 25 s extension at 72 °C. Dissociation curve analysis of amplification products was carried out at the end of each PCR reaction to confirm that only one PCR product was amplified and detected. Data were analyzed with the Realplex2 software (Eppendorf). To maintain consistency, the baseline was set automatically by the software. The comparative CT method (2−△△CT method) was used to analyze the expression level of HsMT. The CT for the target amplified HsMT and the CT for the internal control β-actin were determined for each sample. Differences in the CT for the target and the internal control, called △CT, were calculated to normalize the differences in the amount of total nucleic acid added to each reaction and the efficiency of the RT-PCR. The group of gills was used as the reference sample, called the calibrator. The △CT for each sample was subtracted from the △CT of the calibrator; the difference was called △△CT. The expression levels of HsMT could be calculated by 2−△△CT, and the value stood for an n-fold difference relative to the calibrator.
The temporal expression of HsMT under Cd exposure
The procedures with Cd treatment to the H. schlegelii were carried out as described in “Samples and heavy metal exposure”. Three tissues (gonad, mantle, kidney) were collected at different time point after exposure for the RNA extraction. There were three replicates for each time point. The methods of RNA extraction, cDNA synthesis, and Real-time PCR analysis were performed as described above. In the process of data analysis, the blank group was selected as the calibrator.
Statistics
One-way ANOVA and unpaired Student’s t test were applied to compare the differences between the control and the exposed groups. All data were expressed as means±SD. Differences were considered as being significant at p < 0.05 (*) and extremely significant at p < 0.01 (**).
Results
Characterization of MT cDNA sequence and phylogenetic analysis of H. schlegelii
The full-length cDNAs of HsMT1 and HsMT2 were of 589 and 667 bp (Fig. (A) and (B). The open reading frame (ORF) sequences of HsMT1 have 216 bp in length, encoding a hypothetical protein of 71 amino acids with a predicted molecular mass about 7.14 kDa and isoelectric point (pI) of 7.24. The deduced HsMT1 amino acid sequences contained 21 Cys residues which were calculated as 29.6% of the total amino acids, and lacked histidines and aromatic residues (phenylalanine and tyrosine). It contained nine characteristic Cys-X-Cys,one Cys-X-X-Cys, six Cys-X-X-X-Cys, and one Cys-Cys motif arrangements and a conserved structural pattern Cys-x-Cys-x(3)-Cys-Thr-Gly-Cys-x(3)-Cys-x-Cys-x(3)-Cys-x-Cys-Arg at the C-terminus (Fig. (A) and (B).
Fig. 1. cDNA and deduced amino acid sequences of HsMT1 (A) and HsMT2 (B). Asterisk indicates the stop codon.
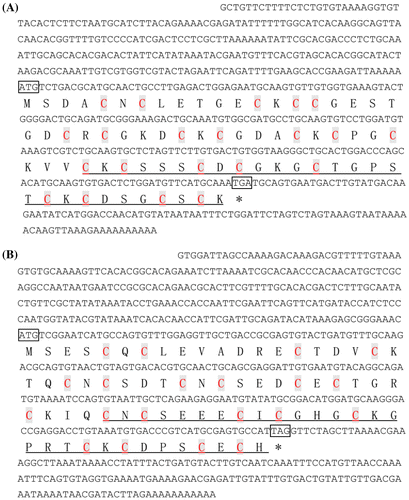
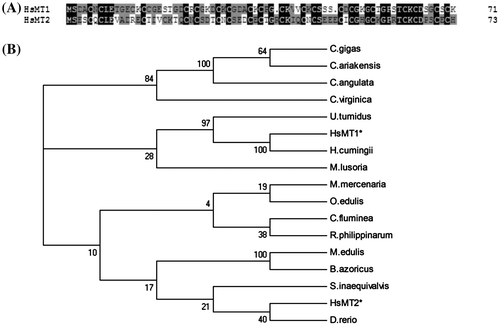
Fig. 2. ClustalW-aligned HsMT1 & HsMT2 sequences (A) and phylogenetic analysis of MT homologues based upon the protein sequences using the MEGA program (B). The zebrafish (D. rerio) MT sequence was used as the out-group.
The full length cDNA of HsMT2 consisted of an ORF 222 bp encoding a protein of 73 amino acids, which had a calculated molecular weight of 7.99 kDa and the theoretical pI of 4.58. The sequence of HsMT2 contained the characteristic eight Cys-X-Cys and seven Cys-X-X-X-Cys motifs, with cysteine contents (27.4%), but lacked Cys–Cys motifs and aromatic acids (phenylalanine and tyrosine). The structure of C-terminus was Cys-x-Cys-x(3)-Cys-Lys-Gly-x(3)-Cys-x-Cys-x(3)-Cys-x-Cys-His (Fig. (B). Both complete sequences of HsMT1 and HsMT2 were submitted to GenBank under accession Nos. KJ019820 and KJ019821.
The deduced amino acid sequences of HsMT1 and HsMT2 revealed strong homologies on positions of the abundant cysteine residues (Fig. (A). These two sequences shared an identity of 46.5%. Sequences of the two MTs were compared to 15 molluscs’ MTs for evolutionary divergence analysis using the NJ tree methods (Fig. (B). The HsMT1 was clustered with that of H. cumingii and a sister group to U. tumidus. Interestingly, the HsMT2 gathered with zebrafish separated from freshwater and marine molluscs.
The metal tolerance of BL21 (DE3) transformed with HsMT1 and HsMT2
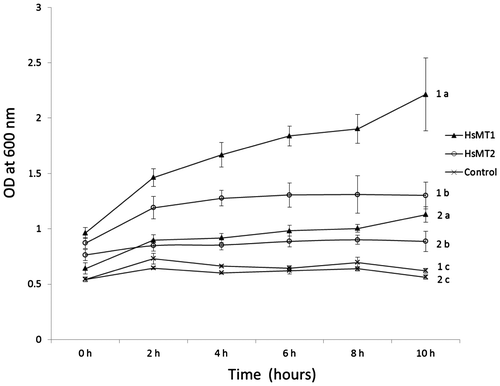
To further explore the biological functions of HsMT, the survival rate of recombinant E.coli cells was measured in cultures containing 500 μM or 1000 μM Cd. The number of cells was measured at OD600 nm. As shown in Fig. , an obvious inhibition of growth of the BL21 (DE3) containing the plasmid of pET32a/HsMT2 and pET32a was observed,but the growth inhibition was reduced in the same strain containing pET32a/HsMT1. The number of E.coli cells containing pET32a/HsMT2 increased in the first 2 h, then plateaued, and ultimately decreased slightly at 10 h. However, the density of E.coli cells containing pET32a/HsMT1 kept increasing in the duration. Growth curves, in short, revealed that bacteria containing pET32a/HsMT1 had higher tolerance to Cd than the same strain containing pET32a/HsMT2 and pET32a.
Fig. 3. Growth curve of E.coli strain of BL21 (DE3) cells in 500 μM and 1000 μM Cd.
Expression of HsMT1 and HsMT2 in different tissues
The HsMT1 transcript was ubiquitously expressed in various tissues with relatively high abundance in hepatopancreas and kidney, followed by gonad, heart, gill, mantle, foot, adductor muscle, but showing particular low expression in hemocytes (Fig. ).
Fig. 4. HsMT1 and HsMT2 mRNA expression patterns in various tissues.
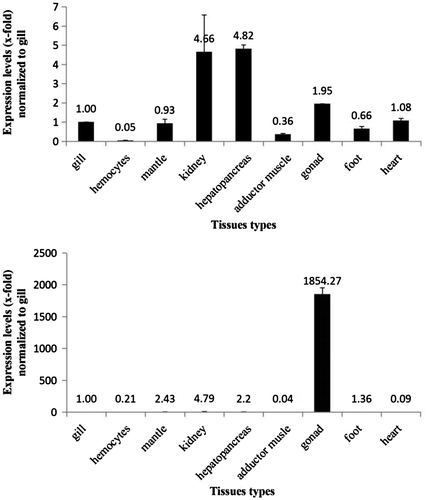
Analysis by real-time quantitative RT-PCR found that HsMT2 expression was the highest in gonad, approximately 1854 times that of gill, with very low but detectable expression levels in kidney, mantle, hepatopancreas, foot, heart, hemocytes, and adductor muscle (Fig. ).
The temporal expression of HsMT under Cd exposure
Temporal effects of the transcriptional activities on HsMT in three tissues (gonad, mantle, kidney) were investigated after the H. schlegelii was exposed to Cd (5 ppm) over a 96-h period (Fig. ). Considering the high mRNA level of HsMT2 in gonad, we just detected its expression profiles in gonad.
Fig. 5. Fold inductions of HSMT1 mRNA levels in gonad, mantle, kidney, and Fold inductions of HSMT2 mRNA levels in gonad with different time-courses (0, 6, 12, 24, 48, and 96 h) after Cd exposure (5 ppm).
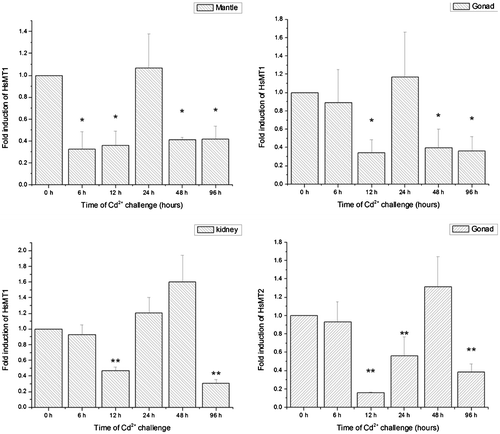
To some extent, the gonad, mantle, and kidney presented similar expression profiles for HsMT1. They all exhibited decreased trends and then returned to baseline level at one time point before they significantly or extremely significantly decreased again. For the HsMT1 mRNA levels of mantle and gonad, both were downregulated at 12 h, and then recovered to the original levels at 24 h, followed by a decrease at 48 h and 96 h. Concerning the kidney, the expression levels of HsMT1 mRNA decreased compared to the control over a 12-h period posttreatment and the baseline level appeared at 24 h and 48 h followed by a decrease 96 h. For the HsMT2 mRNA levels in the gonad, it was significantly downregulated at 12 h and 24 h, then recovered to the original level at 48 h, and finally decreased significantly (p < 0.01) at 96 h.
Discussion
The deduced amino acid sequences of the two MT cDNAs from H. schlegelii show some typical characteristics of MT proteins in other molluscsCitation15): in particular cysteines arranging boxes and the conserved C-terminus motifs: Cys-X-Cys-X(3)-Cys-Tyr-Gly-X(3)-Cys-X-Cys-X(3)-Cys-X-Cys-Lys. The cysteine concentration in the range of 23%–33% of the HsMT1 and HsMT2 is consistent with MTs from other species i.e. 25.5% in A. irradians, 28.8% in M. edulis, and 28% in C. gigas.Citation16, 17) Phylogenetic analysis for the predicted HsMT1 and HsMT2 proteins suggested they were different isoforms based on a moderate homology (46.5%), which is similar to other bivalves, such as C. gigas,Citation18) C. virginica,Citation7) M. galloprovincialis,Citation19) and A. irradians Citation6) The existence of different MT subfamilies in molluscs or different isoforms within subfamilies may be related with various cellular functions.Citation7)
However, there are some distinct structural characteristics and amino acid contents in both proteins. Firstly, HsMT1 lacks aromatic residues and histidines which are generally found in other bivalve MT proteins. But HsMT2 contains histidines in its sequences, in line with C. virginicaCitation7) and H. pomatia.Citation20) Secondly, the lysine residue content in HsMT1 is 12.7%, not only higher than that in HsMT2 (5.4%) but also higher than MTs in M. lusoria (11.84%), L. elliptica MT (11%), R. decussatus (8.33%), and C. glaucum (8.33%).Citation5, 21) In addition, HsMT2 lacks Cys–Cys motifs.
The Cys–Cys dipeptide segments are essential for the formation of α-domain,Citation22) which could enclose four divalent metal ions in the form of a metal4Cys11 clusters.Citation23) The lysine residues and Cys–Cys motifs were thought to be related to the detoxication of bivalent metals and stability on metal binding clusters.Citation21) The higher contents of lysines and cysteines and the Cys–Cys motifs in HsMT1 may explain its higher efficiency about chelating metals and higher level of resistance to metals ions in the transformed E.coli cells. Results obtained from in vitro transgenic experiments clearly showed a higher growth rates for BL21 (DE3) conferred of HsMT1 than HsMT2 in the presence of Cd (Fig. ).
Different expression levels of MT in tissues could provide clues on relative functions. Our results showed that the organ of the highest expression level of HsMT1 was hepatopancreas, similar with H. americanus.Citation24) These supported the hepatopancreas as the main multifunctional organ for regulating heavy metal contents in bivalves and the most important tissue for heavy metal accumulation and the central location for MT synthesis in the shells. On the other hand, the abundant expression of HsMT2 in gonad (Fig. ) might be linked to metabolic need for essential metals, for the roles of MT including transportation of essential metabolic elements during development and reproductive cycle in gonad.Citation25) It could be speculated that HsMT1 and HsMT2 proteins are isozymes and have different physiological functions.
Previous and ongoing studies have mostly been concentrated on the development of warning bioindicators for the risks from pollution.Citation26) For fishes, several researchers revealed a positive relationship between heavy metal exposure and MT mRNA expression when they were treated with 5 ppm or 10 ppm Cd, such as yellow catfish,Citation27) Japanese medaka,Citation28) and river pufferfish.Citation29) However, 5 ppm of Cd may lower the metabolic capacity of freshwater bivalves further causing physiological dysfunction. In this study, when the shell was exposed to 5 ppm Cd for 96 h, the mRNA expression level of HsMT1 and HsMT2 mRNA returned to the basic level at 24 h (48 h for HsMT2) and both expression levels decreased at 12 h and 96 h (Fig. ). It was suggested that HsMT1 and HsMT2 should be involved in response of Cd and execute barrier functions. There were some evidences that the expression levels of MT mRNA were lower than the control group after long-term or high-dosage exposure to Cd.Citation30, 31) The MT mRNA expression level was not related to Cd accumulation in cases in which treatment dosage of Cd was over 1000 μg/L (1 ppm) or the exposure time for over 5 days in the hard clam (M. lusoria).Citation32) MT gene transcription and protein translation appeared to progressively be reduced at acute dosage of beyond 200 μg Cd /kg in turbot (S. maximus).Citation33) It was thought that the positive relationship between time and MT expression occurred only with dosage of heavy metals that did not cause detrimental effects on the physiological functions.Citation32) Certainly, more data about the relationship between the concentration of heavy metals and MT expression levels were needed in further researches.
Conclusions
We have obtained two sequences of HsMT from H. schlegelii and have elucidated their molecular characterization. The complete amino acid sequences shared a moderate homology (46.5%) between HsMT1 and HsMT2, and showed different amino acid residues contents of histidines, lysines, and the number of Cys–Cys motifs. The phylogenetic relationship showed that HsMT1 gathered with related species’ MTs, but was clearly distinct from HsMT2. Moreover, HsMT1 could contribute to higher metal tolerance than HsMT1 when they were over-expressed in E.coli. The results of RT-PCR showed that HsMT1 transcripts were presented constitutively in the shell, however, nearly all HsMT2 transcripts were just detected in gonad. Meanwhile, their mRNA levels presented similar expression patterns under Cd exposure. Taken together, these data supported the hypothesis that HsMT1 and HsMT2 were involved in process of metal response but HsMT2 might have other physiological functions in H. Schlegelii.
Funding
This work was supported by the Key Scientific and Technological Program of Jiangxi Province, China [grant numbers 20152ACF60013], [KJLD12001], [2009BNA07400]; National Natural Science Foundation of China [grant number 31160534]; the Natural Science Foundation of Jiangxi Province [grant number 20122BAB204016].
Disclosure statement
No potential conflict of interest was reported by the authors.
References
- Langston WJ, Bebianno MJ, Burt GR. Metal handling strategies in molluscs. In: Langston WJ, Bebianno MJ, editors. Metal metabolism in aquatic environments. London: Chapman and Hall; 1998. p. 219–283.
- Dallinger R, Berger B, Hunziger P, et al. Metallothionein in snail Cd and Cu metabolism. Nature. 1997;388:237–238.10.1038/40785
- Lemoine S, Bigot Y, Sellos D, et al. Metallothionein isoforms in Mytilus edulis (Mollusca, Bivalvia): complementary DNA characterization and quantification of expression in different organs after exposure to cadmium, zinc, and copper. Mar. Biotechnol. 2000;2:195–203.
- Jenny MJ, Ringwood AH, Schey K, et al. Diversity of metallothioneins in the American oyster, Crassostrea virginica, revealed by transcriptomic and proteomic approaches. Eur. J. Biochem. 2004;271:1702–1712.10.1111/ejb.2004.271.issue-9
- Park H, Ahn IY, Choi HJ, et al. Cloning, expression and characterization of metallothionein from the Antarctic clam Laternula elliptica. Protein Expres. Purif. 2007;52:82–88.10.1016/j.pep.2006.08.008
- Wang L, Song L, Ni D, et al. Alteration of metallothionein mRNA in bay scallop Argopecten irradians under cadmium exposure and bacteria challenge. Comp. Biochem. Phys. C: Toxicol. Pharm. 2009;149:50–57.
- Jenny MJ, Warr GW, Ringwood AH, et al. Regulation of metallothionein genes in the American oyster (Crassostrea virginica): Ontogeny and differential expression in response to different stressors. Gene. 2006;379:156–165.10.1016/j.gene.2006.05.004
- Novelli Filho JLVB, Novelli ELB, Manzano MA, et al. Effect of alpha-tocopherol on superoxide radical and toxicity of cadmium exposure. Int. J. Environ. Heal. R. 2000;10:125–134.10.1080/09603120050021128
- Géret F, Jouan A, Turpin V, et al. Influence of metal exposure on metallothionein synthesis and lipid peroxidation in two bivalve mollusks: the oyster (Crassostrea gigas) and the mussel (Mytilus edulis). Aquat. Living Resour. 2002;15:61–66.10.1016/S0990-7440(01)01147-0
- Lecoeur S, Videmann B, Berny P. Evaluation of metallothionein as a biomarker of single and combined Cd/Cu exposure in Dreissena polymorpha. Environ. Res. 2004;94:184–191.10.1016/S0013-9351(03)00069-0
- Hardivillier Y, Denis F, Demattei MV, et al. Metal influence on metallothionein synthesis in the hydrothermal vent mussel Bathymodiolus thermophilus. Comp. Biochem. Phys. C: Toxicol. Pharm. 2006;143:321–332.
- Duquesne SJ, Coll JC. Metal accumulation in the clam Tridacna crocea under natural and experimental conditions. Aquat. Toxicol. 1995;32:239–253.10.1016/0166-445X(94)00089-9
- Wu SM, Lin HC, Yang WL. The effects of maternal Cd on the metallothionein expression in tilapia (Oreochromis mossambicus) embryos and larvae. Aquat. Toxicol. 2008;87:296–302.10.1016/j.aquatox.2008.02.012
- Hermesz E, Abraham M, Nemcsok JA. Tissue-specific expression of two metallothionein genes in common carp during cadmium exposure and temperature shock. Comp. Biochem. Physiol. C. 2001;128:457–465.
- Binz PA, Kägi JHR. Metallothionein: molecular evolution and classification. In Klaassen CD, editor. Metallothionein IV. Basel, Switzerland: BirkhauserVerlag; 1999. p. 7–13.
- Liang SH, Jeng YP, Chiu YW, et al. Cloning, expression, and characterization of cadmium-induced metallothionein-2 from the earthworms Metaphire posthuma and Polypheretima elongata. Comp. Biochem. Phys. C: Toxicol. Pharm. 2009;149:349–357.
- Wang Q, Wang X, Wang X, et al. Analysis of metallotionein expression and antioxidant enzyme activities in Meretrix meretrix larvae under sublethal cadmium exposure. Aquat. Toxicol. 2010;100:321–328.10.1016/j.aquatox.2010.08.012
- Tanguy A, Mura C, Moraga D. Cloning of a metallothionein gene and characterization of two other cDNA sequences in the Pacific oyster Crassostrea gigas (CgMT1). Aquat. Toxicol. 2001;55:35–47.10.1016/S0166-445X(01)00160-6
- Zorita I, Bilbao E, Schad A, et al. Tissue- and cell-specific expression of metallothionein genes in cadmium- and copper-exposed mussels analyzed by in situ hybridization and RT–PCR. Toxicol. Appl. Pharm. 2007;220:186–196.10.1016/j.taap.2007.01.003
- Chabicovsky M, Niederstätter H, Thaler R, et al. Localization and quantification of Cd- and Cu-specific metallothionein isoform mRNA in cells and organs of the terrestrial gastropod Helix pomatia. Toxicol. Appl. Pharm. 2003;190:25–36.10.1016/S0041-008X(03)00148-0
- Ladhar-Chaabouni R, Mokdad-Gargouri R, Denis F, et al. Cloning and characterization of cDNA probes for the analysis of metallothionein gene expression in the Mediterranean bivalves: Ruditapes decussatus and Cerastoderma glaucum. Mol. Biol. Rep. 2009;36:1007–1014.10.1007/s11033-008-9274-8
- Riek R, Prêcheur B, Wang Y, et al. NMR structure of the sea urchin (Strongylocentrotus purpuratus) metallothionein MTA. J. Mol. Biol. 1999;291:417–428.10.1006/jmbi.1999.2967
- Sauge-Merle S, Lecomte-Pradines C, Carrier P, et al. Heavy metal accumulation by recombinant mammalian metallothionein within Escherichia coli protects against elevated metal exposure. Chemosphere. 2012;88:918–924.10.1016/j.chemosphere.2012.04.015
- Chavez-Crooker P, Pozo P, Castro H, et al. Cellular localization of calcium, heavy metals, and metallothionein in lobster (Homarus americanus) hepatopancreas. Comp. Biochem. Phys. C: Toxicol. Pharm. 2003;136:213–224.
- Ren F, Jiang H, Sun J, et al. Cloning, characterization, expression, and copper sensitivity of the metallothionein-1 gene in the Chinese mitten crab, Eriocheir sinensis. Mol. Biol. Rep. 2011;38:2383–2393.10.1007/s11033-010-0372-z
- Sarkar A, Ray D, Shrivastava AN, et al. Molecular biomarkers: their significance and application in marine pollution monitoring. Ecotoxicology. 2006;15:333–340.10.1007/s10646-006-0069-1
- Kim JH, Rhee JS, Dahms HU, et al. The yellow catfish, Pelteobagrus fulvidraco (Siluriformes) metallothionein cDNA: molecular cloning and transcript expression level in response to exposure to the heavy metals Cd, Cu, and Zn. Fish Physiol. Biochem. 2012;38:1331–1342.10.1007/s10695-012-9621-5
- Woo S, Yum S, Jung JH, et al. Heavy metal-induced differential gene expression of metallothionein in Javanese medaka, Oryzias javanicus. Mar. Biotechnol. 2006;8:654–662.10.1007/s10126-006-6046-0
- Kim JH, Wang SY, Kim IC, et al. Cloning of a river pufferfish (Takifugu obscurus) metallothionein cDNA and study of its induction profile in cadmium-exposed fish. Chemosphere. 2008;71:1251–1259.10.1016/j.chemosphere.2007.11.067
- Wu SM, Hwang PP. Copper or cadmium pretreatment increases the protection against cadmium toxicity in tilapia larvae (Oreochromis mossambicus). Zool. Stud. 2003;42:179–185.
- Guan R, Wang WX. Cd and Zn uptake kinetics in Daphnia magna in relation to Cd exposure history. Environ. Sci. Technol. 2004;38:6051–6058.
- Chang YT, Jong KJ, Liao BK, et al. Cloning and expression of metallothionein cDNA in the hard clam (Meretrix lusoria) upon cadmium exposure. Aquaculture. 2007;262:504–513.10.1016/j.aquaculture.2006.11.010
- George SG, Hodgson PA, Tytler P, et al. Inducibility of metallothionein mRNA expression and cadmium tolerance in larvae of a marine teleost, the turbot (Scophthalmus maximus). Toxicol. Sci. 1996;33:91–99.10.1093/toxsci/33.1.91
