
Abstract
Disuse leads to severe muscle atrophy and a slow-to-fast myofiber-type transition. PGC-1α (Peroxisome proliferator-activated receptor γ coactivator 1α) is documented to play an important role in muscle atrophy and slow-twitch myofiber determination. Transcription of atrophy-related Atrogin-1 by FoxO3 can be reduced by PGC-1α. While Smad3 augments FoxO3-induced Atrogin-1 and MuRF1 promoter activity. So PGC-1α, as a transcription co-activator, may regulate hindlimb unloading (HU)-induced myofiber-type transition and muscle atrophy through Smad3. Our results showed that transgenic PGC-1α mice resisted HU-induced muscle loss, atrophy-related genes expression, and slow-to-fast myofiber-type transition. Furthermore, over-expression of PGC-1α resisted the increase in pSmad3 during muscle atrophy in vivo and in vitro. And, PGC-1α over-expression inhibited the expression of atrogenes via suppressing the phosphorylation of Smad3 in vitro. Thus, PGC-1α is effective in regulating myofiber-type transition during HU, and it alleviates skeletal muscle atrophy partially through suppressing the activation of Smad3.
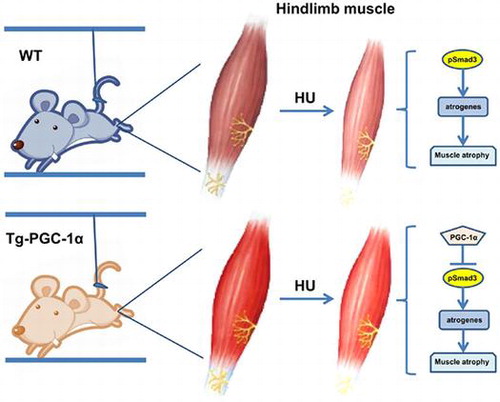
Graphical abstract
PGC-1α overexpression alleviates HU-induced myofiber-type transition and may attenuate muscle atrophy partially via suppressing pSmad3.
Disuse muscle atrophy, induced by prolonged space flight, bed rest, or immobilization, is a common pathophysiological condition with a variety of adaptations in skeletal muscle, which are characterized by the loss of protein and fiber-type transition.Citation1,2) It is widely recognized that disuse muscle atrophy impairs the ability to perform daily tasks, increases the incidence of injuries and prolongs the period of rehabilitation. Therefore, understanding the mechanisms of disuse muscle atrophy and developing therapeutic strategies are of great importance.
In all types of atrophying muscle, the ubiquitin–proteasome system is activated, and it catalyzes the degradation of the bulk of muscle proteins.Citation3) FoxO family transcription factors play a critical role in this loss of muscle proteins, and when activated, FoxO3 causes expression of the atrophy-related ubiquitin ligases Atrogin-1 and MuRF-1 and profound loss of muscle mass.Citation4) PGC-1α was originally identified as a coactivator of PPAR (peroxisome proliferator-activated receptors) γ in brown adipose tissue,Citation5) and it is enriched in certain tissues which are active in oxidative metabolism, such as heartCitation6) and skeletal muscle. PGC-1α has been reported to play an important role in skeletal muscle atrophyCitation7–12) and slow-twitch myofiber development.Citation7) It has been reported that PGC-1α reduces the capacity of FoxO3 to bind to and transcribe from the Atrogin-1 promoter.Citation7) Cannavino et al. showed that transgenic PGC-1α mice were resistant to HU-induced muscle atrophy and redox imbalance through the inhibition of proteasomal degradation and autophagy.Citation13,14) However, the mechanism by which PGC-1α regulates HU-induced skeletal muscle atrophy and myofiber-type transition has not yet been sufficiently elucidated.
The HU model has been widely used to study the effects of disuse on skeletal muscle in rodents.Citation1,15–16) It was reported that HU could result in a significant weight lossCitation18) and slow to fast fiber-type transition in skeletal muscle.Citation19,20) Furthermore, the extent of muscle atrophy induced by HU is related to muscle type. Studies showed that the loss of protein were more dramatic in slow-twitch fibers than in fast-twitch fibers during HU.Citation18,21–24) TGF-β/Smad3 pathway plays a negative role in regulating muscle mass. The activation of Smad3 promotes the expression of FoxO1 and FoxO3, which led to the expression of Atrogin-1.Citation25) On the other hand, the inactivation of Smad3 prevents the increase of FoxO1 and Atrogin-1 expression in myostatin-induced skeletal muscle wasting.Citation26) Given all this, we hypothesized that PGC-1α could inhibit disuse-induced muscle atrophy partially through Smad3.
In the present study, we demonstrate that elevated levels of PGC-1α through transgenic expression retarded soleus muscle atrophy in the medium phase of disuse. Moreover, we show that transgenic PGC-1α mice suppressed the muscle fiber-type transition during HU for the first time. Furthermore, we demonstrate that PGC-1α attenuates skeletal muscle atrophy partially through the inhibition of Smad3 activation.
Materials and methods
Animals and hindlimb unloading
All wild-type (WT) and muscle-specific PGC-1α transgenic mice used in the experiments were bred and maintained at the SPF Animal Research Building of China Astronaut Research and Training Center (12-h light, 12-h dark cycles and free access to food and water). The muscle-specific PGC-1α transgenic mice under the control of MCK (muscle creatine kinase) promoter were generated by J. Lin et al.Citation27) In brief, PGC-1α complementary DNA was placed downstream of MCK promoter sequence.Citation28) The transgenic PGC-1α mice were then generated by standard DNA microinjection. The genotype identification was performed as described below. The animals were bred by adult PGC-1α transgenic C57BL/6 mice with WT C57BL/6 mice. The offspring of transgenic PGC-1α and wild-type littermates was used.
To induce muscle atrophy by disuse, these mice were elevated sufficiently so as to prevent their hindlimbs from touching the cage floor or sides, as described previously.Citation29,30) eight-week-old male C57BL/6 mice with similar body mass (22 ± 2 g) were assigned randomly into weight-bearing control (Con/HU 0d) and 3, 7, and 14 days (HU 3, 7, 14 d) hindlimb-unloaded groups (4 groups, HU 3d and 7d, n = 8 per group. HU 0d and 14d, n = 24 per group). Transgenic PGC-1α mice (PGC-1α) and their wild-type littermates (WT) (8 week-old, 22 ± 3 g) were assigned to weight-bearing control (Con) or 14 days of hindlimb-unloaded (HU 14d) groups, respectively (4 groups: WT Con, WT HU 14d, PGC-1α Con, PGC-1α HU 14d, n = 24 per group). Animals were sampled at the same day (HU 14d) with different start time for HU. All animal procedures were approved by the Institutional Animal Care and Use Committee of China Astronaut Research and Training Center.
Muscle preparation and analysis
At the end of the experimental treatments, the Con and HU mice were weighted and treated with pentobarbital sodium (80 mg/kg) by intraperitoneal injection. Gastrocnemius (Gast), soleus (Sol), and plantaris (Pl) muscles from both legs were collected and weighted. Photos were taken immediately after the excess fat and connective tissue were cleaned using standardized dissection methods. The muscle mass was presented as muscle mass/bodyweight (BW) ratio. The values of the muscle/BW ratio were normalized using ratio from day 0. For C57BL/6 mice, soleus muscles from eight animals of HU 0, 3, 7, 14d group were used for the mRNA level examination. Soleus muscles from other 16 animals in the HU 0d and HU 14d group were used for detecting protein expression levels and immuno-histochemical analysis with eight animals for each experiment. Transgenic PGC-1α mice and littermates (n = 24 /group) were equally split for three kinds of experiments (gene detecting, protein detecting, and immuno-histochemical analysis).
Muscles for RNA isolation and protein extraction were lysed in TRIzol or RIPA lysis buffer (see below). The muscles for immuno-histochemical analysis were embedded in OCT matrix and frozen in isopentane cooled in liquid nitrogen for sectioning and subsequent morphological and immuno-histochemical analysis.
Skeletal muscle cells culture and transfection
C2C12 myoblasts were cultured in growth medium (GM): DMEM (Gibco) containing 10% fetal bovine serum (Biochrom), 100 IU/mL penicillin and 100 μg/mL streptomycin (Euroclone). When the confluency reached 70–80%, myoblasts were differentiated into myotubes by replacing the GM with differentiation medium (DM): DMEM (Gibco) containing 2% horse serum, 100 IU/mL penicillin and 100 μg/mL streptomycin (Euroclone). The medium was replaced with DM every 24 h for four days to induce myotube according to previous studies.Citation31)
Transfections of plasmids were performed using Lipofectamine 3000 Transfection Kit (Invitrogen) according to the manufacturer’s instructions. Briefly, 7.5-μL Lipofectamine 3000 reagent was diluted into 125-μL Opti-MEM medium. Then, the master mix of plasmids DNA was prepared by diluting DNA in 125 μl Opti-MEM medium and 10-μL P3000 reagent (2 μL/μg DNA). The diluted DNA was added to the diluted Lipofectamine 3000 reagent. Lipo–DNA complex was incubated for 5 min at room temperature, and then added to myotubes. Plasmids of PGC-1α (wild-type PGC-1α inserts, NM_008904, were cloned into the pcDNA3.1 vector),Citation32) C.A. Smad3 (constitutive activated Smad3)Citation33) and their control plasmids (pcDNA3.1 and pCMV, separately) were transfected into the myotubes as described below. Myotubes were divided to two groups (Unstarved group and Starved group), each group was divided to four sub-groups as “Empty” group (transfected with plasmids of pcDNA3.1 and pCMV), “PGC-1α” group (transfected with plasmids of pcDNA3.1-PGC-1α and pCMV), “Smad3” group (transfected with plasmids of pcDNA3.1 and pCMV-C.A.Smad3), and “PGC-1α + Smad3” group (transfected with plasmids of pcDNA3.1-PGC-1α and pCMV-C.A.Smad3). Each sub-group was transfected with two kinds of plasmids, 2.5 μg of each plasmids was used and mixed to 5 μg of a total plasmids per well in a six-well plate. After 24 hof transfection, the DM of starved group was replaced with PBS for 6 h to induce atrophy.Citation4)
Myotubes were photographed under a phase contrast microscope at 200× magnification before and after starvation. Myotubes diameter was quantified by measuring more than 100 myotubes from 10 random fields at 100× magnification using Image Pro Plus 6.0 as described previously.Citation34)
Luciferase Reporter Assays
Myoblasts were transfected using Lipofectamine 3000 Reagent (Invitrogen) with a Renilla luciferase plasmid (pRL-TK, Promega) and with the vector containing three copies of a Smad-binding element (SBE) (pGL4.48, Promega). In addition, the myoblasts were divided into three groups and transfected with “pcDNA3.1 + pCMV”, “pcDNA3.1 + pCMV-C.A. Smad3”, and “pcDNA3.1-PGC-1α + pCMV-C.A. Smad3” plasmids, respectively. Except pRL-TK, plasmids used in transfection was 0.08 μg/well (1/10 of reporter plasmids), other three kinds of plasmids (pGL4.48, pcDNA3.1/pcDNA3.1-PGC-1α, pCMV/pCMV-C.A. Smad3) used was 0.8 μg/well, and mixed to 2.48 μg of a total plasmids per well in a 12-well plate. The volume of reagents used in each well of 12-well plate was half of which used in 6-well plate. After 48 h, myoblasts were lysed in 1 × passive lysis buffer and analyzed using the Dual-Luciferase Reporter Assay System (Promega). The Renilla luciferase vector (pRL-TK) was used to normalize transfection efficiency.
Genotyping
Transgenic MCK-PGC-1α mice were identified by isolating genomic DNA from tail tissue and screening for the presence of transgene by PCR. To detect PGC-1α alleles, primers used were as follows: (PGC-1α: Forward: 5′ – GCAGGATCACATAGGCAGGATGTGGCC – 3′; Reverse: 5′ – GGAAGATCTGGGCAAAGAGGCTGGTC C – 3′). Conditions were as follows: 95 °C 5 min, 28 cycles of 95 °C 45 s, 65 °C 1 min, and 72 °C 1 min, and 72 °C 10 min.
RNA isolation and real-time PCR
Total RNA of hindlimb muscles or cells was extracted with TRIzol reagent (Invitrogen) according to the manufacturer’s instructions. A cDNA synthesis kit (Thermo, 00271135) was used to reverse transcribe the total RNA (2 μg) into complementary DNA following the manufacturer’s instructions. Real-time PCR was performed using the Power SYBR Green PCR Master Mix according to the manufacturer’s protocol (Life, 1506496). Primer sets are provided in Supplemental Table 1. The ΔΔCt method was used to calculate the expression levels of target genes relative to GAPDH.
Protein extraction and Western blot analysis
Whole cell or skeletal muscle tissue extracts was prepared and homogenized using the RIPA lysis buffer (Applygen, C1053) containing the protease and phosphatase inhibitors (Commplete, Protease Inhibitor Cocktail Tablets, Roche, 04893116001; PhosSTOP, Phosphatase Inhibitor Cocktail Tablets, Roche, 04906845001). Then, the homogenate obtained was centrifuged at 18000 g for 10 min at 4 °C. Protein concentration was determined using Bradford protein assay reagent (Bio-Rad). The supernatant was stored at –80 °C. Equal amount of protein samples (30 μg) was loaded onto 10% Tris/glycine gels, electrophoresed, and then proteins were electro-transferred to polyvinylidene fluoride (PVDF) membranes (Millipore). Blots were blocked in the 5% non-fat dry milk dissolved in Tris-buffered saline (TBS, pH 7.4) containing 0.1% Tween-20 (TBST) for 1 h, probed overnight with primary antibodies against PGC-1α (Abcam, ab54481), Atrogin-1 (ECM Biosciences, MP2041), Troponin I-SS (Santa Cruz, sc-8119), Troponin I-FS (Santa Cruz, sc-8120), Smad3 (abcam, ab28379), phospho-Smad3 (abcam, ab52903). Anti-GAPDH antibody (Santa cruz, sc-365062) was used to verify equal loading. Thereafter, the membranes were washed in TBST, followed by incubation with HRP-conjugated secondary antibodies, and detection with ECL kit (Thermo scientific, Prod34080). Signals were captured on radiographic film, and bands were quantified using Image-Pro Plus 6.0. Protein expression levels were normalized to GAPDH and expressed as percentage relative to the control group unless otherwise stated.
Immunohistochemical analysis
Serial cryosections of hindlimb muscles were incubated for 30 min with 0.3% Triton X-100 in PBS, then blocked for 1 h with 5% goat serum in PBS. Fiber cross-sectional areas (CSAs) of hindlimb muscles were immunostained with anti-laminin (Abcam, ab11575), and fiber typing of soleus muscles was determined by immunofluorescence using the antibodies: BA-D5 for type- I MHC isoform; SC-71 for type-IIa MHC isoform; and BF-F3 for IIb MHC isoform (Hybridoma Bank, Iowa). Primary antibodies were detected by Alexa Fluor-594 (Invitrogen Corp, A11012) fluorescent dye conjugated to an anti-rabbit secondary antibody or Alexa Fluor 488 (Invitrogen Corp, A11001) fluorescent dye conjugated to an anti-mouse secondary antibody for visualization. Fiber CSAs and the numbers of slow or fast fibers were calculated using Image-Pro Plus 6.0. Total fibers in each muscle cross section were measured. For the fiber size distribution of muscle, data were collected from soleus muscles of at least three animals.
Statistical analysis
Data were presented as mean ± standard error (SEM). One way ANOVA was used for the comparison between two groups. Two-way ANOVA was used for the comparison of the magnitude of changes between two different groups in mice of two different genotypes. Statistical significance was determined using the Student’s t test. A p value less than 0.05 was considered statistically significant. A p value less than 0.01 was considered as very significant. Experiments were undertaken on separate occasions. Eight individual experiments were performed for each mouse group. All analyses were performed using SPSS software (version 19.0).
Results
Skeletal muscle atrophy induced by hindlimb unloading
To examine the effects of HU on muscle mass, the weights of the gastrocnemius, soleus, and plantaris muscles were determined at different times during HU. The relative muscle mass (muscle mass/Bodyweight) decreased significantly after HU (Fig. (A)). From a gross morphological perspective, the skeletal muscles of the HU14 group (HU for 14 days) were smaller in size, as well as paler in color than those of the control mice (Fig. (B)). Moreover, muscle sections from Con and HU14 group were immunostained with anti-laminin antibody to measure fiber CSAs (Fig. (C)). The mean fiber CSAs of the gastrocnemius, soleus, and plantaris were 86.4, 67.3, and 103.9% of the control group, respectively, after 14 days of HU (Fig. (D)). The frequency distribution of the fiber size in soleus muscles was shown in Fig. (E). Fibers of HU14 showed an obvious increase in the percentage of smaller fibers compared with Con. These results indicated that 14 days of HU lead to skeletal muscle atrophy and the most serious atrophy happened in soleus muscles.
Fig. 1. Skeletal muscle atrophy induced by HU.
Fiber-type switching from slow to fast in soleus muscle following HU
The above results have shown that HU-induced skeletal muscle atrophy was predominantly occurred in soleus muscles. Our subsequent study then focused on the changes especially in soleus muscle during HU. To determine the fiber-type compositions of the soleus muscles during 14 days of HU (0, 3, 7, 14 day), MHC isoform mRNA expression was detected and showed in Fig. (A), the mRNA levels of MHC-I and MHC-IIa continually decreased and reached minimum at 14 days of HU, while the mRNA levels of MHC-IIb and MHC-IIx dramatically increased after day 3. The mRNA levels of MHC-IIb peaked at day 14 of HU, while the mRNA levels of MHC-IIx declined after the third of HU and remained at a relative high expression level at day 14 of HU. Western blot analysis of Troponin I-SS (slow) and Troponin I-FS (fast) in soleus muscles indicated that 14 days of HU induced a 22.0% reduction in Troponin I-SS (**p < 0.01) and a 113.7% (**p < 0.01) increase in Troponin I-FS compared with the control group (Fig. (B)).
Fig. 2. Fiber-type switching from oxidative to more glycolytic fibers in soleus muscle following HU.
To confirm fiber-type transition, muscle cryosections were stained with monoclonal antibodies specific for MHC-I, IIa, and IIb (Fig. (C)). Quantitative analysis showed that the percentage of MHC-I and MHC-IIa fibers was reduced to 10.67 and 11.34% respectively, compared with Con. The percentage of MHC-IIb fibers increased by 167.52% compared with Con (Fig. (D)). Thus, the results confirmed that 14 days of HU caused slow-to-fast phenotype changes in soleus muscles.
To verify whether muscle fiber atrophy differs among various fiber types, the mean CSAs of different myofiber types were measured and the data were shown in Fig. (E). Mean CSAs showed a reduction of 32.49, 41.35, 19.42% for MHC-I, IIa, and IIb MHC fibers, respectively, after 14 days of HU. These results demonstrated that 14 days of HU induced a marked atrophy of soleus muscle fibers, and the most significant reduction of content and CSAs was observed in MHC-IIa fibers. Namely, 14 days of HU could result in the loss of muscle mass and slow-to-fast fiber-type transition in slow-twitch soleus muscles.
The expression levels of Atrogin-1, MuRF1, and PGC-1α during HU
As shown in Fig. (A), both Atrogin-1 and MuRF1 mRNA in the soleus muscle increased after 3 and 7 days of HU, and they remained above control levels after 14 days of HU. Consistent with the mRNA levels, Atrogin-1 protein levels increased significantly in the soleus muscles after 14 days of HU (Fig. (B)). The level of PGC-1α mRNA decreased significantly during HU in gastrocnemius, soleus, and plantaris muscles (Fig. (C)). A similar rapid fall in protein levels of PGC-1α was observed after 14 days of HU (Fig. (D)). This rapid suppression of PGC-1α expression in HU-induced muscle atrophy suggested that the decrease in PGC-1α might contribute to HU-induced muscle atrophy.
Fig. 3. The changes in PGC-1α and Atrogin-1, MuRF1 expression in the GAST, SOL, and PL during 14 days of HU.
Transgenic PGC-1α mice suppressed HU-induced muscle atrophy
Gene identification tests were performed to identify the transgenic PGC-1α mice and their WT littermates. A band between 250 and 500 bp was detected specifically in transgenic PGC-1α mice (Fig. (A)). Morphological observation showed that most of the muscles in the transgenic mice exhibited the distinct red color characteristic of oxidative muscle, whereas the muscles of WT littermates were paler in appearance (Fig. (B)). After 14 days of HU, the color difference between transgenic and WT mice was still distinct, and the loss of hindlimb muscles was considerably reduced in transgenic PGC-1α mice compared with WT (Fig. (C) and S1).
Fig. 4. Transgenic PGC-1α mice protected from HU-induced muscle atrophy.
Soleus sections from WT and transgenic PGC-1α mice were stained with anti-laminin antibody (Fig. (D)) to measure the fiber CSAs. The mean CSAs of the unloaded WT soleus muscles declined 34.37% compared with WT Con. By contrast, the atrophy of soleus fiber was partially inhibited in the transgenic mice, with only 11.13% decrease in CSAs (Fig. (E)) and a minor shift in fiber size distribution (Fig. (F) and (G)). Furthermore, the increase Atrogin-1 mRNA and protein levels was significantly reduced in soleus muscles of transgenic PGC-1α mice after 14 days of HU (Fig. (H) and (I)). At the same time, the decrease in PGC-1α mRNA and protein levels was suppressed in soleus muscles of transgenic PGC-1α mice after 14 days of HU (Fig. (J) and (K)).
Together, the results indicated that the loss of muscles mass and reduction in CSAs induced by HU can be alleviated by the over-expression of PGC-1α.
Transgenic PGC-1α mice partially alleviated fiber-type switch following HU
To determine whether the resistance to muscle atrophy observed in transgenic PGC-1α mice was due to differences in fiber-type composition, fiber-type analyses of soleus muscles were performed before and after 14 days after HU (Fig. (A)). In WT mice, the MHC-I and MHC-IIa fibers were significantly decreased after 14 days of HU (Fig. (B)). However, the rate of MHC-I and MHC-IIa reduction was significantly less in transgenic PGC-1α mice compared with WT mice (Fig. (C)). The fibers of MHC-IIb were significantly increased in the soleus muscle of WT mice after HU. Transgenic PGC-1α mice showed little difference between Con and HU (Fig. (B) and (C)). Real-time PCR analysis confirmed the effects of PGC-1α on alleviating the changes of MHC-I and MHC-IIb mRNA during HU (Fig. (G)). Western blot analysis showed that PGC-1α over-expression retarded the decrease in Troponin I SS and increase is Troponin I FS after 14 days of HU (Fig. (F)). These results indicated that the slow-to-fast transition of fiber-type induced by HU was retarded in soleus muscles of transgenic PGC-1α mice.
Fig. 5. Transgenic PGC-1α mice partially alleviated myofiber-type switch from slow to fast following HU.
Moreover, the CSAs of MHC-I and MHC-IIa fibers after 14 days of HU were significantly larger in transgenic mice than in WT. This results indicated that the alleviated effect of PGC-1α on HU-induced muscle atrophy was mainly in slow-twitch muscles (Fig. (D) and (E)).
PGC-1α suppressed pSmad3 in vivo and in vitro
The pSmad3 level was lower in transgenic PGC-1α mice compared with WT mice. Furthermore, HU-induced increase in pSmad3 level was significantly suppressed in transgenic mice (Fig. (A)). In vitro, after transfected with PGC-1α, the myotubes showed lower pSmad3 level. And over-expression of PGC-1α in myotubes suppressed starvation-induced activation of Smad3 (Fig. (B)). These results indicated that PGC-1α might alleviate muscle atrophy by affecting the activation of Smad3.
Fig. 6. PGC-1α repressed the phosphorylation of Smad3 in vivo and suppressed starvation induced C2C12 cells atrophy via the repression of pSmad3.
In order to identify the role of Smad3 in the PGC-1α-mediated suppression of myotube atrophy, we co-transfected C.A. Smad3 (constitutively activated Smad3) along with PGC-1α plasmids into C2C12 myoblasts. Results showed that activation of Smad3 retarded the effect of PGC-1α on alleviating myotube atrophy (Fig. (C) and (D)). To confirm this phenomenon, real-time PCR was applied to measure atrogenes levels. PGC-1α over-expression effectively ameliorated starvation-induced atrogenes, including Atrogin-1 (Fig. (E)) and MuRF1 (Fig. (F)). C.A. Smad3 aggravated atrogenes expression (Fig. (E) and (F)). After co-transfection of PGC-1α and C.A. Smad3, the increase in Atrogin-1 and MuRF1 following starvation was remarkably reduced (Fig. (E) and (F)). These results indicated that PGC-1α might alleviate muscle atrophy by the suppression of pSmad3. Furthermore, C.A. Smad3 caused a dramatic (~70-fold) induction of Smad3-dependent transcription. However, PGC-1α strongly suppressed Smad3-dependent transcription (Fig. (G)). C.A. Smad3 also induced the gene expression of FoxO1 and FoxO3 (Fig. (H) and (I)). Taken together, these results demonstrated that PGC-1α suppressed starvation-induced myotube atrophy via the suppression of pSmad3.
Discussion
It is now clear that several specific signaling pathways and genes play key roles in muscle atrophy, including denervation and disuse to fasting and systemic diseases.Citation35,36) The present study showed that PGC-1α is important in regulating the expression of atrogenes and the extent of fiber atrophy.
Firstly, accompanied by the most significant atrophy in soleus muscles (Fig. ), PGC-1α mRNA expression rapidly decreased in the mouse hindlimb muscles after 3 days of unloading, and it remained significantly lower than the controls when the HU time was prolonged to 14 days (Fig. (C)). At the same time, PGC-1α protein expression levels were greatly reduced after 14 days of HU in the mouse hindlimb muscles (Fig. (D)). Thus, PGC-1α probably played role in prolonged HU-induced muscle atrophy. Cannavino et al. have found that PGC-1α mRNA and protein expression in mouse soleus muscles was decreased in the early phases of HU (3 and 7 days).Citation13) The present study prolongated the time of HU to 14 days and makes it closer to disuse atrophy in real life. And our data detected for the first time that the increase in atrogenes in soleus muscle induced by 14 days of HU was accompanied by the decrease in PGC-1α mRNA and protein. Other types of muscle atrophy, such as atrophy induced by denervation, as well as by diabetes, renal failure, and cancer cachexia in rats, also showed suppressed muscle expression levels of PGC-1α,Citation7) while implanting Yoshida AH-130 ascites hepatoma into rats resulted in decreased muscle weight and increased PGC-1α mRNA levels. These differences may be associated with the increase in the expression of several genes involved in fatty acid transport, activation, and oxidation.Citation37)
The atrophy-specific genes Atrogin-1 and MuRF1, two muscle-specific ubiquitin ligases, so-called “atrogenes,” are upregulated in different models of muscle atrophy and are responsible for the increased protein degradation through the ubiquitin–proteasome system.Citation3,38) Previous studies have shown that immobilization/HU-induced atrogenes expression occurs early and returns to lower levels afterward in gastrocnemius,Citation39) although the activation of proteasome remains elevated.Citation40–42) Consistent with these findings, we found that mRNA levels of Atrogin-1 and MuRF1 in soleus muscle maximally increased 5.6-fold and 6.3-fold by day 3 and 7 of HU, respectively, followed by a progressive decline until day 14 (Fig. (A)) accompanied by the maximal decrease in muscle weight/BW (Fig. (A)) and a significant decrease in PGC-1α protein level (Fig. (D)). The extended and longer lasting time of atrophy in our study may be due to the muscle concerned was soleus muscle, which is slow-twitch muscle and more sensitive to HU than the fast-twitch gastrocnemius and quadriceps studied in previous researches. After 14 days of HU, specifically overexpressing PGC-1α in muscles significantly mitigated the increased mRNA and protein expression of Atrogin-1 in the soleus (Fig. (H) and (I)). In addition, the rate of change in the muscle/BW ratio was reduced (Fig. (C)), and the CSAs of the soleus and the fiber-size distribution were preserved (Fig. (D)–(G)). Emerging evidence suggests that PGC-1α could inhibit denervation-, fasting- and forced-FoxO3-expression-induced muscle atrophy by suppressing FoxO3 action and inhibiting atrophy-specific gene transcription.Citation7) It was found that PGC-1α transgenic animals preserve soleus and gastrocnemius muscle size during 3 and 7 days of HU by inhibiting the gene expression of atrogenes and p62, and by mitigating decrease in protein synthesis.Citation13,14) However, skeletal muscle-specific over-expression of PGC-1α in another animal model caused skeletal muscle atrophy via the depletion of ATP.Citation11) Our findings further confirmed the role of PGC-1α in inhibiting the muscle atrophy induced by prolonged HU.
Except for its inhibitory effect on muscle atrophy, the present study indicated that over-expressing PGC-1α in muscle provided significant protection against fiber-type switching following HU. Cannavino et al. reported that transgenic PGC-1α mice preserved the CSAs of the fibers of types I and IIa. However, their studies shown that the MHC isoform composition of soleus muscle, which were determined by SDS-PAGE and densitometric analysis of MHC bands, was unchanged in the early phases (after 3 and 7 days) of HU.Citation13) Additionally, the authors did not examine the effect of PGC-1α on muscle fiber composition in the same study. By contrast, the present study found that the gene expression of MHC isoforms was altered from early stages of HU, resulting in an increased expression of fast fiber isoforms (MHC-IIx, MHC-IIb), and a decreased expression of slow fibers (MHC-I, MHC-IIa) (Fig. (A)). When HU was prolonged to 14 days, the protein expression of TnI-SS was decreased while the expression of TnI-FS increased significantly (Fig. (B)), immunofluorescence performed on soleus sections confirmed a decrease in type I and IIa isoform expression and a significant increase in the percentage of type IIb in the soleus (Fig. (C) and (D)). Generally, type I and IIa myofibers were considered as slow-twitch muscle fibers,Citation43) while type IIx and IIb myofibers were fast-twitch muscle fibers. Fast-to-slow and slow-to-fast transitions in MHC isoforms appear to follow the orderly sequence MHC-I↔MHC-IIa ↔ MHC-IIx ↔ MHC-IIb. Type I fibers are the pure and slowest muscle fibers, type MHC-IIb fibers are the pure and fastest muscle fibers, while type IIa and IIx fibers were intermediates between slow and fast fibers.Citation44) Since the MHC-IIx fibers were not stained in immunofluorescence, and MHC-I, IIa, and IIb were not stained in one cryosections of muscle, the percentage of MHC-IIx cannot be determined from the captured pictures of the stained muscle cryosections. Thus, the percentage of MHC-IIx cannot be determined by counting the stained myofibers directly or by calculating the unstained myofibers indirectly. Calculating the value of MHC-IIx by subtracting the sum percentage of MHC-I, IIa, and IIb from 100% seems inaccurate since a number of myofibers are hybrid and atypical MHC isoform combinations have been reported.Citation44–46) In addition, the changes in pure fast muscle fiber, MHC-IIb fibers, can be convincing enough to show the final result of muscle fibers transition.Citation47) So the percentage of MHC-IIx was not shown in our result of immunofluorescence for subfiber types. Still, the results indicated a transition of muscle fiber type switch from oxidative to glycolytic. Early works on PGC-1α have focused on its roles in determining fiber type.Citation27) PGC-1α transcriptional activity drove the formation of slow-twitch muscle fibers in transgenic mice during development,Citation27) and the skeletal muscle-specific PGC-1α knockout mice exhibited a transition from oxidative type I and IIa towards type IIx and IIb muscle fibers with a reduced endurance capacity and showed more severe damage following treadmill running.Citation43) PGC-1α overexpression in myotubes showed its similar effects on promoting oxidative muscle fibers in vitro, it was reported that PGC-1α overexpression quickened the maturation of myotubes and induced a more oxidative muscle fiber type.Citation12) However, the role of PGC-1α in fiber-type switching in mature muscle has not been clearly elucidated. A lower percentage of typeIIa fibers was occasionally observed in the muscles of the patients suffering from obesity and diabetes, with decreased PGC-1α gene expression in type I fibers.Citation48) In another chronic disease, chronic obstructive pulmonary disease (COPD), PGC-1α gene expression also decreased in the skeletal muscle, as did expression of MHC-Iand MHC-IIa.Citation8) The present study showed that mature transgenic PGC-1α mice were resistant to the muscle fiber switch from slow to fast following 14 days of HU (Fig. (A)–(C), (F), and (G)). The gene expressions of MHC-IIa and IIx (Fig. (G)) did not entirely match the myofiber-type composition which are shown in Fig. (B) and (C). This happened because the changes in gene expression are ahead of protein, and the fibers of MHC-IIa and IIx are intermediate myofibers which are always in a state of dynamic change. The effects of PGC-1α on the regulation of fiber-type composition during unloading may be similar to those on the development of fiber types during embryonic development.
Aforementioned results have shown that the decrease in muscle weight/BW and reduction in CSA were most obviously in hindlimb unloaded slow-twitch soleus muscle (Fig. ). Furthermore, the CSA of myofibers of type I and IIa decreased to a larger degree than it did in type IIb myofibers (Fig. (E), and (D)). These results indicated a greater degree of atrophy occurred in oxidative slow muscle fibers than in glycolytic fast muscle fibers. This is consistent with previous studies, which indicated unweighting preferentially affected slow-twitch muscles compared with fast-twitch musclesCitation21) and the decrease in protein was more dramatic in slow-twitch fibers than in fast-twitch fibers.Citation18) It has been reported that PGC-1α protected soleus muscle from atrophy in the early phases of disuse (3 and 7 days following HU).Citation38) The present results shown PGC-1α ove-rexpression in muscle that significantly reduced the decrease in CSA of type I and IIa muscle fibers after 14 days of HU other than type IIb muscle fibers (Fig. (D)), which further demonstrated the protective effect of PGC-1α in slow-twitch oxidative fibers.
Finally, we found the expression of pSmad3, a negative transcription factor in muscle growth was lower in the unloaded soleus muscles of transgenic PGC-1α mice than unloaded WT mice (Fig. (A)). The repressed activity of Smad3 in soleus of transgenic PGC-1α mice was consistent with the reduced muscle atrophy, indicating that PGC-1α over-expression mitigated myotube atrophy probably by suppressing pSmad3. The expression of atrogenes detected in starved myotubes also supported that activation of Smad3 played an important role in PGC-1α alleviating muscle atrophy (Fig. (D), and (E)). In fact, Sartori et al. found that Smad3 signaling is required for the upregulation of the Atrogin-1 promoter.Citation25) Other researchers also found that activated Smad transcription factors induce FoxO1 and FoxO3 expression, leading to the expression of the muscle-specific E3 ligases. It has been reported that Smad3 directly induces gene transcription of FoxO1Citation49) and increases transcription of MuRF1 by increasing FoxO3 protein content and transcriptional activity.Citation50) Selective inhibition or genetic inactivation of Smad3 prevents myostatin-mediated increase in FoxO1 and corresponding Atrogin-1 expression.Citation26) Thus, Smad3 is an indispensable link that tethers upstream signal transduction to Atrogin-1 expression during skeletal muscle wasting. Consistent with previous studies, the gene expression of FoxO1 and FoxO3 in present study was increased by C.A. Smad3 (Fig. (H) and (I)). Importantly, PGC-1α has been confirmed to suppress the FoxO-dependent transcription of critical atrophy-related genes in denervated muscles.Citation7) Given that PGC-1α is a well-established coactivator of transcription, we can hypothesize that PGC-1α indirectly inhibits atrophy. Thus, PGC-1α may protect against muscle atrophy by suppressing the Smad3-dependent, FoxO1-mediated, activation of Atrogin-1 and the ubiquitin–proteasome pathway. Although PGC-1α was observed to suppress pSmad3 in mitigating muscle atrophy here, the exact mechanism by which PGC-1α decreases Smad3 phosphorylation has yet to be determined. Further studies are therefore needed to explore the associated regulatory pathways. Since the changes in pSmad3 were also accompanied by the changes in myofiber composition in present study, no studies has mentioned the relationship between them; another potential mechanism was therefore needed to explore the role of pSmad3 in regulating muscle fiber types during muscle atrophy.
In conclusion, the present study showed that specific overexpression of PGC-1α in skeletal muscle significantly mitigated soleus atrophy, muscle fiber transition, and Smad3 phosphorylation induced by HU. In addition, the suppressive effect of PGC-1α on muscle atrophy was probably achieved through suppression of pSmad3. This study may facilitate the development of therapeutic strategies to maintain muscle mass and fiber-type composition in disused muscle atrophies, such as weightlessness- or immobilization-induced muscle atrophy.
Authors’ contributions
MF, XC, and JW concepted and designed the experiments; MF, XC, CZ, and JW interpreted the data and prepared the manuscript; JW, PZ,and FW conducted the experiments; JW and JH performed animal study; JW and HL perfomed cell study; JW and FW analysed the data; JW, FW, PZ, HL, and JH contributed to reagents/materials/analysis tools.
All of the authors read and approved the final manuscript.
Funding
This work was supported by the Natural Sciences Foundation of China [grant number 81501625], [grant number 81272177], [grant number 81401765]; the State Key Laboratory Grant of Space Medicine Fundamentals and Application [grant number SMFA13A01]; the State Key Laboratory Grant of Human Factors Engineering [grant number SYFD150051802], [grant number SYFD140051801].
Supplemental material
The supplemental material for this paper is available at http://dx.doi.org/10.1080/09168451.2016.1254531.
TBBB_1254531_Supplementary_Material.zip
Download Zip (114.9 KB)Disclosure statement
No potential conflict of interest was reported by the authors.
Notes
Abbreviations: BW, Body weight; C.A. Smad3, Constitutive activated Smad3; COPD, Chronic obstructive pulmonary disease; CSAs, Cross-sectional areas; Con, Control; DM, Differentiation medium; DMEM, Dulbecco’s modified Eagle’s Medium; Gast, Gastrocnemius; GM, Growth medium; HU, Hindlimb unloadingl MHC, Myosin heavy chain; MCK, Muscle creatine kinase; PBS, Phosphate-buffered saline; Plant, Plantaris; pSmad3, Phosphorylation of Smad3; PVDF, Polyvinylidene fluoride; PPAR, Peroxisome proliferator-activated receptors; PGC-1α, Peroxisome proliferator-activated Receptor γ coactivator 1α; Sol, Soleus; SEM, Standard error of the mean; TBS, Tris-buffered saline; TBST, Tris-buffered saline containing 0.1% Tween-20; Tn I-SS, Troponin I-SS; Tn I-FS, Troponin I-FS; MCK-PGC-1α mice, Transgenic mice with muscle-specific PGC-1α expression under the control of the muscle creatine kinase (MCK) promoter; WTild-type.
Related Research Data
References
- Desplanches D. Structural and functional adaptations of skeletal muscle to weightlessness. Int J Sports Med. 1997;18:S259–S264.10.1055/s-2007-972722
- Fitts RH, Riley DR, Widrick JJ. Physiology of a microgravity environment invited review: microgravity and skeletal muscle. J Appl Physiol. 1985;2000:823–839.
- Bodine SC, Latres E, Baumhueter S, et al. Identification of ubiquitin ligases required for skeletal muscle atrophy. Science. 2001;294:1704–1708.10.1126/science.1065874
- Sandri M, Sandri C, Gilbert A, et al. Foxo transcription factors induce the atrophy-related ubiquitin ligase Atrogin-1 and cause skeletal muscle atrophy. Cell. 2004;117:399–412.10.1016/S0092-8674(04)00400-3
- Puigserver P, Wu Z, Park CW, et al. A cold-inducible coactivator of nuclear receptors linked to adaptive thermogenesis. Cell. 1998;92:829–839.10.1016/S0092-8674(00)81410-5
- Lehman JJ, Barger PM, Kovacs A, et al. Peroxisome proliferator-activated receptor gamma coactivator-1 promotes cardiac mitochondrial biogenesis. J Clin Invest. 2000;106:847–856.10.1172/JCI10268
- Sandri M, Lin J, Handschin C, et al. PGC-1alpha protects skeletal muscle from atrophy by suppressing FoxO3 action and atrophy-specific gene transcription. Proc Nat Acad Sci USA. 2006;103:16260–16265.10.1073/pnas.0607795103
- Remels AH, Schrauwen P, Broekhuizen R, et al. Peroxisome proliferator-activated receptor expression is reduced in skeletal muscle in COPD. Eur Respir J. 2007;30:245–252.10.1183/09031936.00144106
- Patti ME, Butte AJ, Crunkhorn S, et al. Coordinated reduction of genes of oxidative metabolism in humans with insulin resistance and diabetes: potential role of PGC1 and NRF1. Proc Nat Acad Sci USA. 2003;100:8466–8471.10.1073/pnas.1032913100
- Brault JJ, Jespersen JG, Goldberg AL. Peroxisome proliferator-activated receptor gamma coactivator 1alpha or 1beta overexpression inhibits muscle protein degradation, induction of ubiquitin ligases, and disuse atrophy. J Biol Chem. 2010;285:19460–19471.10.1074/jbc.M110.113092
- Miura S, Tomitsuka E, Kamei Y, et al. Overexpression of peroxisome proliferator-activated receptor gamma co-activator-1alpha leads to muscle atrophy with depletion of ATP. Am J Pathol. 2006;169:1129–1139.10.2353/ajpath.2006.060034
- Mortensen OH, Frandsen L, Schjerling P, et al. PGC-1alpha and PGC-1beta have both similar and distinct effects on myofiber switching toward an oxidative phenotype. Am J Physiol Endocrinol Metab. 2006;291:E807–E816.10.1152/ajpendo.00591.2005
- Cannavino J, Brocca L, Sandri M, et al. PGC1-alpha over-expression prevents metabolic alterations and soleus muscle atrophy in hindlimb unloaded mice. J Physiol. 2014;592:4575–4589.10.1113/jphysiol.2014.275545
- Cannavino J, Brocca L, Sandri M, et al. The role of alterations in mitochondrial dynamics and PGC-1alpha over-expression in fast muscle atrophy following hindlimb unloading. J Physiol. 2015;593:1981–1995.10.1113/jphysiol.2014.286740
- Morey-Holton ER, Globus RK. Hindlimb unloading rodent model: technical aspects. J Appl Physiol. 1985;2002:1367–1377.
- Lawler JM, Song W, Demaree SR. Hindlimb unloading increases oxidative stress and disrupts antioxidant capacity in skeletal muscle. Free Radical Biol Med. 2003;35:9–16.10.1016/S0891-5849(03)00186-2
- Wronski TJ, Morey-Holton ER. Skeletal response to simulated weightlessness: a comparison of suspension techniques. Aviat Space Environ Med. 1987;58:63–68.
- Bederman IR, Lai N, Shuster J, et al. Chronic hindlimb suspension unloading markedly decreases turnover rates of skeletal and cardiac muscle proteins and adipose tissue triglycerides. J Appl Physiol. 1985;2015:16–26.
- Bigard AX, Boehm E, Veksler V, et al. Muscle unloading induces slow to fast transitions in myofibrillar but not mitochondrial properties. Relevance to skeletal muscle abnormalities in heart failure. J Mol Cell Cardiol. 1998;30:2391–2401.10.1006/jmcc.1998.0798
- Grichko VP, Heywood-Cooksey A, Kidd KR, et al. Substrate profile in rat soleus muscle fibers after hindlimb unloading and fatigue. J Appl Physiol. 1985;2000:473–478.
- Thomason DB, Booth FW. Atrophy of the soleus muscle by hindlimb unweighting. J Appl Physiol. 1985;1990:1–12.
- Goldspink DF, Morton AJ, Loughna P, et al. The effect of hypokinesia and hypodynamia on protein turnover and the growth of four skeletal muscles of the rat. Pflugers Arch. 1986;407:333–340.10.1007/BF00585311
- Tsika RW, Herrick RE, Baldwin KM. Effect of anabolic steroids on skeletal muscle mass during hindlimb suspension. J Appl Physiol. 1985;1987:2122–2127.
- Hornberger TA, Hunter RB, Kandarian SC, et al. Regulation of translation factors during hindlimb unloading and denervation of skeletal muscle in rats. Am J Physiol Cell Physiol. 2001;281:C179–187.
- Sartori R, Milan G, Patron M, et al. Smad2 and 3 transcription factors control muscle mass in adulthood. Am J Physiol Cell Physiol. 2009;296:C1248–C1257.10.1152/ajpcell.00104.2009
- Lokireddy S, McFarlane C, Ge X, et al. Myostatin induces degradation of sarcomeric proteins through a Smad3 signaling mechanism during skeletal muscle wasting. Mol Endocrinol. 2011;25:1936–1949.10.1210/me.2011-1124
- Lin J, Wu H, Tarr PT, et al. Transcriptional co-activator PGC-1 alpha drives the formation of slow-twitch muscle fibres. Nature. 2002;418:797–801.10.1038/nature00904
- Johnson JE, Wold BJ, Hauschka SD. Muscle creatine kinase sequence elements regulating skeletal and cardiac muscle expression in transgenic mice. Mol Cell Biol. 1989;9:3393–3399.10.1128/MCB.9.8.3393
- Schulte LM, Navarro J, Kandarian SC. Regulation of sarcoplasmic reticulum calcium pump gene expression by hindlimb unweighting. Am J Physiol. 1993;264:C1308–1315.
- Morey-Holton E, Globus RK, Kaplansky A, et al. The hindlimb unloading rat model: literature overview, technique update and comparison with space flight data. Adv Space Biol Med. 2005;10:7–40.10.1016/S1569-2574(05)10002-1
- Sacheck JM, Ohtsuka A, McLary SC, et al. IGF-I stimulates muscle growth by suppressing protein breakdown and expression of atrophy-related ubiquitin ligases, Atrogin-1 and MuRF1. Am J Physiol Endocrinol Metab. 2004;287:E591–E601.10.1152/ajpendo.00073.2004
- Kang C, Goodman CA, Hornberger TA, et al. PGC-1alpha overexpression by in vivo transfection attenuates mitochondrial deterioration of skeletal muscle caused by immobilization. FASEB J. 2015;29:4092–4106.10.1096/fj.14-266619
- Chipuk JE, Cornelius SC, Pultz NJ, et al. The androgen receptor represses transforming growth factor-beta signaling through interaction with Smad3. J Biol Chem. 2002;277:1240–1248.10.1074/jbc.M108855200
- Rommel C, Bodine SC, Clarke BA, et al. Mediation of IGF-1-induced skeletal myotube hypertrophy by PI(3)K/Akt/mTOR and PI(3)K/Akt/GSK3 pathways. Nat Cell Biol. 2001;3:1009–1013.10.1038/ncb1101-1009
- Lecker SH, Goldberg AL, Mitch WE. Protein degradation by the ubiquitin-proteasome pathway in normal and disease states. J Am Soc Nephrol. 2006;17:1807–1819.10.1681/ASN.2006010083
- Lecker SH, Jagoe RT, Gilbert A, et al. Multiple types of skeletal muscle atrophy involve a common program of changes in gene expression. FASEB J. 2004;18:39–51.10.1096/fj.03-0610com
- Fuster G, Busquets S, Ametller E, et al. Are peroxisome proliferator-activated receptors involved in skeletal muscle wasting during experimental cancer cachexia? Role of beta2-adrenergic agonists. Cancer Res. 2007;67:6512–6519.10.1158/0008-5472.CAN-07-0231
- Gomes MD, Lecker SH, Jagoe RT, et al. Atrogin-1, a muscle-specific F-box protein highly expressed during muscle atrophy. Proc Nat Acad Sci USA. 2001;98:14440–14445.10.1073/pnas.251541198
- Hanson AM, Harrison BC, Young MH, et al. Longitudinal characterization of functional, morphologic, and biochemical adaptations in mouse skeletal muscle with hindlimb suspension. Muscle Nerve. 2013;48:393–402.10.1002/mus.v48.3
- Lang SM, Kazi AA, Hong-Brown L, et al. Delayed recovery of skeletal muscle mass following hindlimb immobilization in mTOR heterozygous mice. PLoS One. 2012;7:e38910.10.1371/journal.pone.0038910
- Krawiec BJ, Frost RA, Vary TC, et al. Hindlimb casting decreases muscle mass in part by proteasome-dependent proteolysis but independent of protein synthesis. Am J Physiol Endocrinol Metab. 2005;289:E969–E980.10.1152/ajpendo.00126.2005
- Lloyd SA, Lang CH, Zhang Y, et al. Interdependence of muscle atrophy and bone loss induced by mechanical unloading. J Bone Miner Res. 2014;29:1118–1130.10.1002/jbmr.2113
- Handschin C, Chin S, Li P, et al. Skeletal muscle fiber-type switching, exercise intolerance, and myopathy in PGC-1alpha muscle-specific knock-out animals. J Biol Chem. 2007;282:30014–30021.10.1074/jbc.M704817200
- Pette D, Staron RS. Myosin isoforms, muscle fiber types, and transitions. Microsc Res Tech. 2000;50:500–509.10.1002/(ISSN)1097-0029
- Caiozzo VJ, Baker MJ, Baldwin KM. Novel transitions in MHC isoforms: separate and combined effects of thyroid hormone and mechanical unloading. J Appl Physiol. 1985;1998:2237–2248.
- Peuker H, Pette D. Quantitative analyses of myosin heavy-chain mRNA and protein isoforms in single fibers reveal a pronounced fiber heterogeneity in normal rabbit muscles. Eur J Biochem. 1997;247:30–36.10.1111/ejb.1997.247.issue-1
- Geng T, Li P, Okutsu M, et al. PGC-1alpha plays a functional role in exercise-induced mitochondrial biogenesis and angiogenesis but not fiber-type transformation in mouse skeletal muscle. Am J Physiol Cell Physiol. 2010;298:C572–C579.10.1152/ajpcell.00481.2009
- Adachi T, Kikuchi N, Yasuda K, et al. Fibre type distribution and gene expression levels of both succinate dehydrogenase and peroxisome proliferator-activated receptor-gamma coactivator-1alpha of fibres in the soleus muscle of Zucker diabetic fatty rats. Exp Physiol. 2007;92:449–455.10.1113/expphysiol.2006.035451
- Lokireddy S, Mouly V, Butler-Browne G, et al. Myostatin promotes the wasting of human myoblast cultures through promoting ubiquitin-proteasome pathway-mediated loss of sarcomeric proteins. Am J Physiol Cell Physiol. 2011;301:C1316–C1324.10.1152/ajpcell.00114.2011
- Bollinger LM, Witczak CA, Houmard JA, et al. SMAD3 augments FoxO3-induced MuRF-1 promoter activity in a DNA-binding-dependent manner. Am J Physiol Cell Physiol. 2014;307:C278–C287.10.1152/ajpcell.00391.2013