
Abstract
The water extract of soybean seeds (Glycine max (L.) Merr.) is nearly tasteless, but “kokumi” taste sensation was confirmed upon addition of a basic umami solution containing glutamic acid, inosine monophosphate, and sodium chloride. To identify the key contributors to the “kokumi” taste sensation in soybean seeds, sensory-guided fractionation, taste sensory analyses, and LC–MS/MS analyses were utilized. γ-glutamyl-tyrosine and γ-glutamyl-phenylalanine were identified as contributors to “kokumi taste”; specifically, these γ-glutamyl peptides imparted the “kokumi” taste sensation at a low taste threshold in a basic umami solution. Raffinose and stachyose, which are sufficiently present in soybean seeds, exhibited a synergistic effect in regard to the enhanced “kokumi” taste sensation of γ-glutamyl peptides. This is the first report that the combined use of γ-glutamyl peptides and oligosaccharides can increase the “kokumi” intensity, which suggests that soybean extracts or soymilk can be used to enhance the “kokumi” taste sensation in food products.
The combined use of γ-glutamyl peptides and oligosaccharides can increase the “kokumi” taste intensity.
Soybean (Glycine max (L.) Merr.) is a primary crop from the viewpoint of oil production. Soybeans contain about 20% oil in their seeds, and soybean oil is widely used for cooking, baking, and frying. Considerable research has been focused on these uses, and numerous attempts to improve oil quality and increase oil content have been put forth.Citation1,2) On the other hand, soybeans are also comprised of 40% proteins and carbohydrates, which are known to have health benefits.Citation3,4) For example, 7S globulin can reduce serum triglyceride levels,Citation5) and oligosaccharides, such as raffinose and stachyose are utilized by bifido-bacteria to improve the intestinal environment.Citation6) In addition to these applications, in many Asian countries, including Japan, various types of soy-products, such as miso, soy sauce, tofu, tempeh and soymilk are widely utilized. Miso and soy sauce are produced by fermentation and are used as seasonings.
Fermented soy-products, especially soy sauce, abound world-wide. On the other hand, in Japan, roasted soybean seeds are used to make soup stocks for Japanese vegetarian foods. Soybean soup stocks are nearly tasteless, but the savory taste increases upon combination with other soup stocks made from dried kelp or mushrooms, which contain glutamic acid or guanylic acid and are known to impart an umami taste. Recently, in addition to soybean soup stocks, soymilk has also been widely used as a flavor enhancer, especially in Japanese Nabe (hot pot cooking), Ramen (noodles), and soups. Such products exhibit improved properties, such as enhanced thickness, continuity, mouthfulness. These effects were defined as “kokumi”, which is distinct from the five basic tastes.Citation7–9) Specifically, in Japan, “kokumi” is a concept that describes a certain mouthfeel, and is thought to be a key factor for palatability. Many taste-improving components are present in various food materials, such as sulfur-containing peptides in garlic and onions,Citation7,10) N-(1-carboxyethyl)-6-(hydroxymethyl) pyridinium-3-ol inner salt (alapyridaine) in beef broth,Citation11) γ-glutamyl peptides in snap beans,Citation8) Gouda cheese,Citation12) and Parmesan cheese,Citation13) and C17-C21 oxylipins exhibiting 1-acetoxy-2,4-dihydroxy- and 1-acetoxy-2-hydroxy-4-oxo motifs in processed avocados.Citation14) Although many studies regarding such components have been reported, no data are available regarding the taste-improving components in soymilk or soybeans.
In order to isolate and characterize the key taste contributors in soybeans, sensory-guided fractionation and taste sensory analysis were carried out in this study. The structures of contributors to the “kokumi” taste sensation in the water extract of soybean seeds were analyzed by LC–MS. The taste-improving effects of the identified compounds were evaluated quantitatively in basic model experiments.
Materials and methods
Chemicals. γ-glutamyl-tyrosine and γ-glutamyl-phenylalanine were purchased from BACHEM (Bubendorf, Switzerland). Saccharides and other materials in the control solution were purchased from WAKO Pure Chemical Industries (Osaka, Japan). All solvents were of LC–MS grade and were purchased from WAKO Pure Chemical Industries (Osaka, Japan). Soybeans (Glycine max (L.) Merr.) were provided by Fuji Oil Holdings Inc.
Extraction of water soluble components from soybeans. Dried soybean seeds (50 g) were autoclaved (120 °C, 5 min) and powdered using a coffee grinder. The resulting powder was dispersed into distilled water (200 mL), and the dispersion was stirred for 60 min. The resulting slurry was centrifuged, and the supernatant was freeze-dried as the aqueous phase of heat-treated soybean seeds. This aqueous phase was stored at −20 °C until use.
Ultrafiltration (UF). Freeze-dried materials obtained from the aqueous phase described above (10 g) was dissolved in deionized water and filtered through 10,000 Da cut-off membranes on a HIT-1-FUSO181 (DAICEN MEMBRANE SYSTEMS, Tokyo, Japan) at room temperature to obtain high- and low-molecular weight fractions. Two fractions were freeze-dried and stored at −20 °C until use.
Gel Permeation Chromatography (GPC). The low-molecular weight fraction (0.5 g), which exhibited “kokumi” taste activity, was dissolved in 5 mL deionized water and the pH was adjusted to 4.0 with 1% formic acid. An aliquot of this solution (5 mL) was applied on a 70 × 5 cm glass column (Bio Rad Laboratories, CA, USA) filled with a slurry of BioGel P-2 (Bio Rad). The column was conditioned with water adjusted to pH 4.0 with 1% formic acid. Chromatographic separation was performed at a flow rate of 1.5 mL/min for 24 h. The effluent was monitored at 220 nm using an UV-900 ultraviolet detector (GE Healthcare, Uppsala, Sweden), and divided into five fractions (fractions 1–5) collected using a fraction collector DC-1200 (EYELA, Tokyo, Japan); each fraction was freeze-dried. These samples were subjected to sensory analysis and chromatographic subfractionation.
Preparative HPLC using Hydrophilic Interaction Chromatography (HILIC) column. The freeze-dried GPC fraction-3 (0.1 g) was dissolved in a 1:1 volume ratio mixture solution of water and acetonitrile containing 0.1 v/v% formic acid and separated by HPLC using an HILIC column (XBridge BEH Prep Amide column; 10 × 250 mm i.d., 5 μm; Waters). Preparative HPLC was performed on a Waters MassLynx preparative system (Waters, MA, USA) consisting of a 2535 quaternary gradient module, system fluidics organizer, 515 HPLC pomp, 2767 sample manager, 2998 photodiode array detector, and ACQuity QDa MS detector. Before injection, the sample was filtrated using a membrane filter (0.2 μm); a 1 mL aliquot was injected. Chromatography was performed at a flow rate of 6 mL/min using formic acid (0.1% in water) as solvent A, and acetonitrile containing 0.1% formic acid as solvent B. The gradient was as follows: 95% B for 2 min; 95–85% B from 2 to 22 min; 85–50% B from 22 to 30 min; 50–95% B from 30 to 31 min; 95% B from 31 to 45 min. The effluent was monitored at 220 nm and with an MS (ESI−) detector, and separated into six fractions. The fractions were collected over 30 runs, and freeze-dried twice for taste dilution analysis and further separation.
To further separate the “kokumi” taste components, the “kokumi” active HPLC fractions (fractions 3-4 and 3-5) were rechromatographed in a similar way as described above. The gradient was as follows: 95% B for 0.5 min; 95–85% B from 0.5 to 12 min; 85–50% B from 12 to 20 min; 50–95% B from 20 to 21 min; 95% B from 21 to 30 min. Fractions 3-4 and 3-5 were separated into eight and 11 fractions, respectively. These fractions were collected over 20 runs, and freeze-dried twice for the following experiments.
Ultra Performance Liquid Chromatography–quadrupole-time-of-flight-mass spectrometry (UPLC–Q-TOF-MS). The identification of “kokumi” taste components in the selected fractions was performed as previously described with some modifications.Citation15) UPLC–MS was performed using a Waters Acquity UPLC system (Milford, MA) coupled to a Xevo QTOF–MS equipped with an electrospray source operated in negative ion mode (ESI negative mode), with a lock-spray interface for accurate mass measurements. Leucine enkephalin was employed as the lock-mass compound. A solution of this compound (200 ng/mL in 50% acetonitrile, 50% water, and 0.1% formic acid) was infused directly into the MS at a flow rate of 20 μL/min. The capillary, sampling cone, and extraction cone voltages were set at 2700, 20, and 1 V, respectively. The source and desolvation temperatures were 120 °C and 450 °C, respectively. The cone and desolvation gas flow rates were set at 50 and 800 L/h, respectively. An aliquot of the extracted sample (3 μL) was injected into an Acquity UPLC BEH amide column (column size, 2.1 × 100 mm; particle size, 1.7 μm). Mobile phases A (water and 0.1% formic acid) and B (acetonitrile and 0.1% formic acid) were used. The column temperature was set to 40 °C. The buffer gradient consisted of 75%–55% B for 0–10 min, 55% to 50% B for 10–10.1 min, 50% B for 10.1–15 min, and 75% B for 5 min, at a flow rate of 300 μL/min. In MS/MS mode, the collision energy was set at 10–40 V using collision energy ramping.
Quantitative analysis of γ-glutamyl peptides and oligosaccharides. The freeze-dried low-molecular weight fraction and soybean seed powder were dissolved in 1:1 volume ratio mixture solution of water and acetonitrile containing 0.1% formic acid (25 mg/mL), filtered using a membrane (Vivaspin Turbo 15 VS15T01, Sartorius, Göttingen, Germany), and analyzed by UPLC–Q-TOF-MS/MS using the parameters described above. Quantitative analysis was performed in triplicate by comparing the peak areas of the corresponding mass traces with those of defined standard solutions of each reference peptide and oligosaccharide. Data were acquired with MassLynx software (waters). External mass calibration was performed following the manufacturer’s provided protocol.
Taste analysis panelists. The sensory analysis was reviewed for adherence to ethical guidelines and approved by the research ethics board at the Graduate School of Agriculture, Kyoto University (H27-3). Seventeen panelists (eight males and nine females, 21–40 years old), who gave informed consent for participating in the sensory tests, were trained in sensory experiments for at least 1 year for familiarity with the applied techniques.
“Kokumi” taste sensory analysis. Sample solutions for sensory analysis were prepared as follows: the freeze-dried aqueous phase extracted from heat-treated soybean seeds (1 g) was dissolved in 10 mL distilled water; the freeze-dried low-molecular weight fraction (0.4 g) and high-molecular weight fraction (0.6 g) separated by the UF membrane were dissolved in 10 mL of distilled water. GPC fractions (0.1 g) and preparative HPLC fractions (50 mg) were dissolved in 10 mL distilled water. All samples were dissolved in the control solution consisting of monosodium glutamate (0.02 w/v%), inosine monophosphate (0.01 w/v%), and sodium chloride (0.5 w/v%), and adjusted to pH to 6.5 with NaOH. These solutions were then presented in a dual standard discrimination test along with the control solution to the trained sensory panelists. The panelists were asked to judge whether the samples had an enhanced “kokumi” taste as compared to the control solution. To evaluate the “kokumi” taste profile of these samples, time course profiles of taste intensity (thickness; intensity ~5 s after tasting, continuity; intensity ~20 s after tasting) and mouthfulness (the reinforcement of the taste sensation throughout the mouth) were evaluated.Citation9) Time course profiles of taste intensity were evaluated using a non-graduated 10 cm long linear scale (0 cm: low taste intensity; 10 cm: high taste intensity), and mouthfulness was evaluated using a non-graduated 10 cm long linear scale (0 cm: not detectable; 10 cm: intensity perceived). Each sample (10 mL) was administered orally, and panelists were instructed to keep the sample in their mouths for 20 s, during which the taste intensity was monitored every 5 s.
Determination of recognition threshold concentration of “kokumi” taste activity. The taste recognition threshold of each substance in water and the control solution (described above) was determined by means of a three-alternative forced-choice test.Citation16) Solutions of each substance were presented in order of increasing concentrations (serial 1:1 dilutions), and panelists were asked to evaluate whether the solutions exhibited enhanced “kokumi” taste sensation as compared to the control solution. The taste threshold values of each substance were determined as the concentration at which none of the panelists could distinguish the difference as compared to the control solution. The taste threshold was averaged in three different sessions. The values among individuals and separate sessions differed by no more than one dilution step.
Statistical analysis. In each sensory evaluation, differences between groups were compared with Dunnett’s test and one-way analysis of variance (ANOVA) followed by Tukey’s test. p values less than 0.05 and 0.01 were considered statistically significant.
Results and discussion
Taste-improving effects of soybean seeds
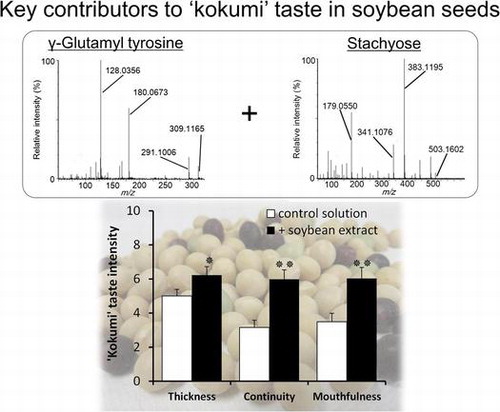
To identify compounds with taste-improving activities in soybeans, the water-soluble extract was prepared. Generally, the water extract of raw soybean seeds has a grassy smell and astringent taste owing to lipoxygenase activity.Citation17,18) Therefore, soybean seeds were heat-treated to deactivate lipoxygenase prior to extraction. These heat-treated soybean seeds were powdered, dispersed in water, and kept for 60 min. After centrifugation, the aqueous phase was collected as an extract and freeze-dried. The aqueous phase was dissolved in water or in the control solution, and the taste was evaluated by a sensory panel. When the aqueous phase was dissolved in water, it was nearly tasteless or exhibited a slightly sweet flavor. On the other hand, the addition of the same amount of the aqueous phase to the control solution caused a significant increase in thickness (intensity at ~5 s after tasting), continuity (intensity ~20 s after tasting), and mouthfulness (Fig. ) as compared to the control solution only, without affecting the taste of the control solution. Since such effects are known as “kokumi”, it was thought that the aqueous phase from soybeans included some compounds that contributed to the “kokumi” taste sensation.
Fig. 1. Sensory analysis of “kokumi” taste sensation of control solution without additives and with aqueous extract of soybeans; fractions were separated using UF membrane.
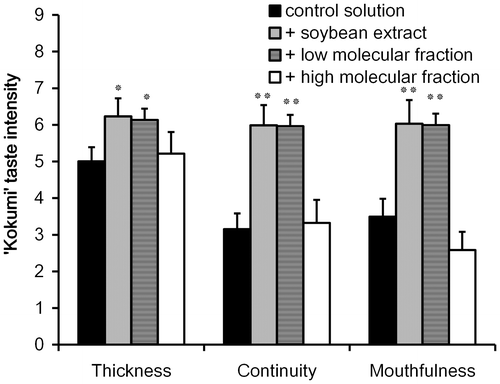
Fig. 2. Gel permeation chromatogram (A) and sensory analysis of “kokumi” taste sensation of fractions separated by UF membrane (B).
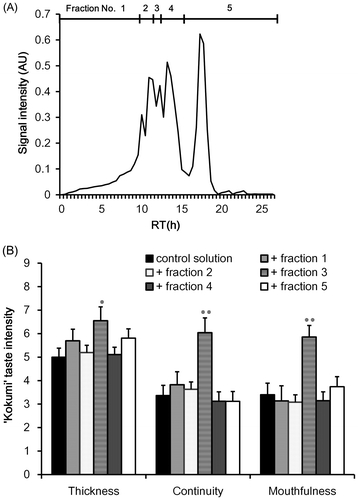
Fig. 3. HILIC–HPLC total ion chromatogram (A) and sensory analysis of “kokumi” taste sensation of fractions separated by GPC fraction 3 (B).
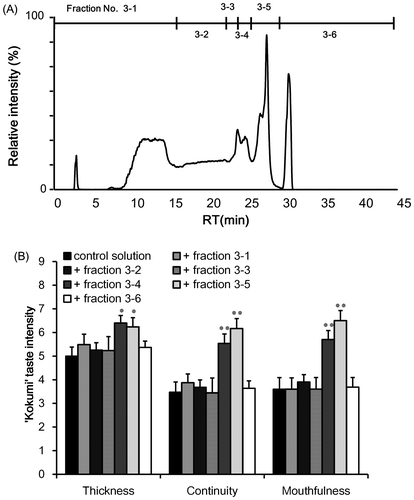
Fig. 4. Total ion chromatograms of fractions 3-4 (A) and 3-5 (B) separated by HILIC–HPLC.
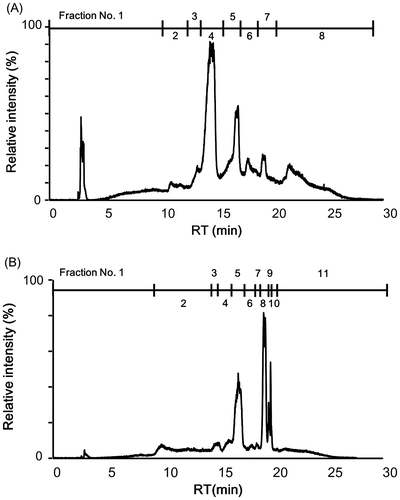
Fig. 5. Sensory analysis of “kokumi” taste sensation of fractions 3-4 (A) and 3-5 (B) separated by HILIC–HPLC.
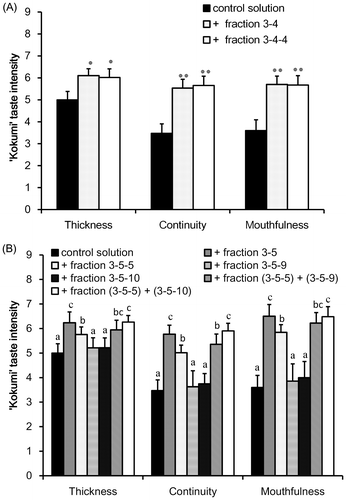
Fig. 6. Identification of γ-glutamyl-tyrosine by LC–MS/MS analysis.
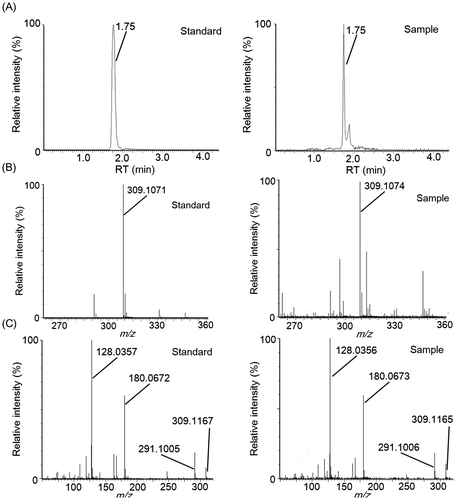
Fig. 7. Identification of γ-glutamyl-phenylalanine by LC–MS/MS analysis.
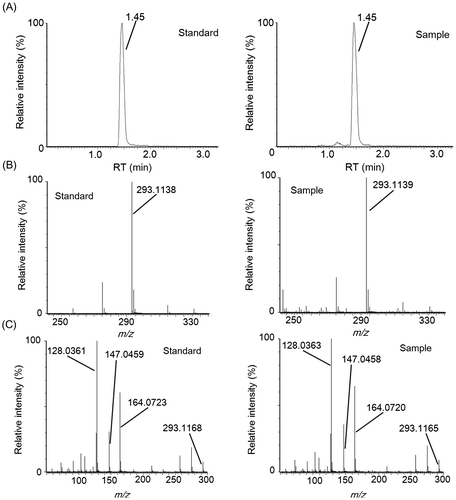
Fig. 8. Identification of raffinose by LC–MS/MS analysis.
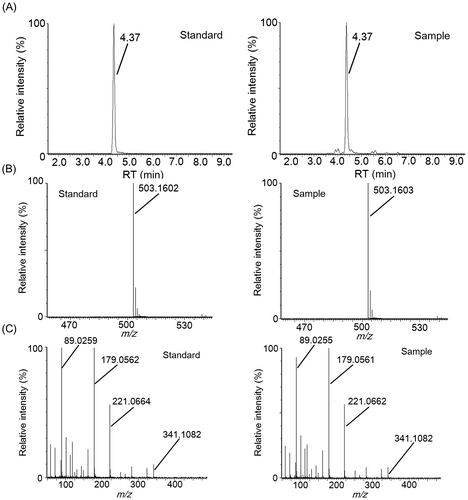
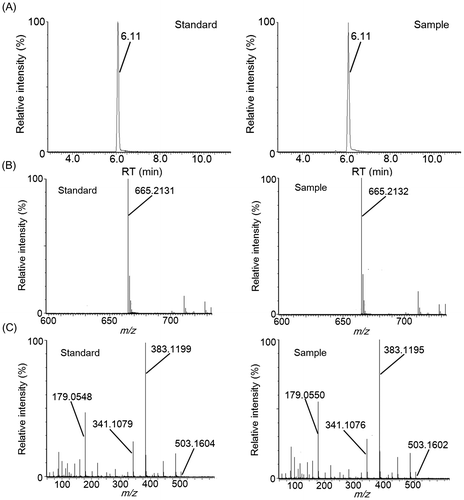
Fig. 9. Identification of stachyose by LC–MS/MS analysis.
Isolation of key contributors to “kokumi” taste sensation
The aqueous phase extracted from heat-treated soybean seeds contained major soybean proteins (7S globlin, 11S glycinin, and lipophilic proteins), carbohydrates, ash, lipids, and other minor components. In order to determine whether the high- or low-molecular weight fraction contributed to the flavor, the aqueous phase was separated by a UF membrane with a molecular weight cut off profile of <10,000. While major soybean proteins were mainly partitioned into the high-molecular weight fraction (>10,000), carbohydrates were mainly separated into the low-molecular weight fraction (<10,000). Sensory analysis revealed that the dispersion of freeze-dried powder in the high-molecular weight fraction was almost tasteless, but the dispersion of the low-molecular weight fraction had a slightly astringent and sweet taste. The “kokumi” taste effects of the powders of the high and low-molecular weight fractions were also evaluated upon dispersion in the control solution. The low-molecular weight fraction demonstrated “kokumi” taste activity, and the strength of this effect was almost the same as that of the aforementioned aqueous phase, whereas the high-molecular fraction did not influence the taste profile of the control solution (Fig. ). These results suggested that the key contributors to the “kokumi” taste sensation were water soluble and had comparatively low-molecular weights.
Next, the low-molecular weight fraction was further separated by GPC fractionation, and the effluent was monitored at 220 nm. Five fractions (fractions 1–5, Fig. (A)) were separated and individually freeze-dried for sensory evaluations. Fractions 1 and 3 were slightly astringent and fraction 5 demonstrated an umami taste when dispersed in water. The other two fractions were almost tasteless in water. In addition, these fractions were evaluated in the control solution, and only fraction 3 exhibited the “kokumi” taste sensation (Fig. (B)). Faction 3 likely contained peptides, as noted by the UV absorption at 220 nm. This fraction also contained saccharides (data not shown).
In order to isolate the molecules that contributed to the “kokumi” taste sensation, GPC fraction 3 was further separated by preparative HPLC using an HILIC column because of the high polarity. The effluent was monitored using an MS detector, and was separated into six fractions (Fig. (A)); each fraction was freeze-dried and used for sensory analysis using the control solution as the solvent. As shown in Fig. (B), the “kokumi” taste was only found in fractions 3-4 and 3-5. To obtain insight into the chemical structures of the “kokumi” taste contributors, these fractions were further separated into sub-fractions by HPLC using an HILIC column (Fig. ). These fractions were also subjected to sensory analysis as described above, and only fractions 3-4-4 and 3-5-5 exhibited the “kokumi” tastes sensation (Fig. ). As a result, the components of fractions 3-4-4 and 3-5-5 were speculated to be major contributors to the “kokumi” taste sensation. However, the taste intensity of fractions 3-5-5 was lower than expected (i.e. equal to the intensity of fractions 3-5 (Fig. (B))). Since all of the sub-fractions of fractions 3-5 except for 3-5-5 did not exhibit the “kokumi” taste sensation, the effects of combining sub-fractions 3-5-5 with other sub-fractions were investigated. As shown in Fig. (B), fractions 3-5-9 and 3-5-10 combined with fraction 3-5-5 demonstrated a higher “kokumi” taste effect as compared to fraction 3-5-5 alone. These results suggested that there were two “kokumi” taste contributors in the water extract of soybean seeds: one which imparted the “kokumi” taste sensation intrinsically, and another which enhanced the “kokumi” taste sensation when combined with “kokumi” taste components. In this case, the former and latter corresponded to 3-5-5 and 3-5-9 or 3-5-10, respectively. In order to identify the contributors to the “kokumi” taste sensation, the chemical structures of these fractions were analyzed.
Structure determination of contributors to “kokumi” taste sensation
LC–MS and LC–MS/MS analysis of fractions 3-4-4 and 3-5-5, which exhibited “kokumi” activity, indicated that these fractions contained different dipeptides. In fraction 3-5-5, an unfragmented deprotonation ion (C14H17N2O6−, [M–H]−, Rt = 1.75 min, m/z = 309.1074) was detected by electrospray negative ionization mass spectrometry (Fig. (A) and (B)). Tandem mass spectrometry (MS/MS) (Fig. (C)) revealed [Glu–H2O–H]− (m/z = 128.0356), [Tyr–H]− (m/z = 180.0673), and [Tyr–NH3–H]− (m/z = 163.0405) fragments, and the fragment ions detected in fraction 3-5-5 matched those of the pure γ-glutamyl-tyrosine standard. Similarly, an unfragmented deprotonation ion (C14H17N2O5−, [M–H]−, Rt = 1.45 min, m/z = 293.1139) was detected in fraction 3-4-4 by electrospray negative ionization mass spectrometry (Fig. (A) and (B)). MS/MS analysis (Fig. (C)) revealed [Glu–H2O–H]− (m/z = 128.0363), [Phe–H]− (m/z = 164.0720), and [Phe–NH3–H]− (m/z = 147.0458) fragments, and the detected fragment ions in fraction 3-4-4 matched those of the pure γ-glutamyl-phenylalanine standard. Fractions 3-5-9 and 3-5-10, which contained “kokumi” taste enhancers, were also analyzed using the same method. Unfragmented deprotonation ions (C18H31O16−, [M–H]−, Rt = 4.37 min, m/z = 503.1603; C24H41O21−, [M–H]−, Rt = 6.11 min, m/z = 665.2132) were detected in fractions 3-5-9 and 3-5-10 by electrospray negative ionization, respectively (Figs. (A) and (B), (A) and (B)). MS/MS analysis (8(C) and 9(C)) revealed the loss of hexose fragments in fraction 3-5-9 ([M–Hex–H]−, m/z = 341.1082; [M–2Hex–H]−, m/z = 179.0561) and 3-5-10 ([M–Hex–H]−, m/z = 503.1602; [M–2Hex–H]−, m/z = 341.1076; [M–3Hex–H]−, m/z = 179.0555). Upon comparison to the pure standards, the fragment ions of fractions 3-5-9 and 3-5-10 were identified as raffinose and stachyose, which are known to be contained in soybeans. Based on these data, γ-glutamyl-tyrosine and γ-glutamyl-phenylalanine were identified as contributors to the “kokumi” taste sensation in fractions 3-5-5 and 3-4-4, and raffinose and stachyose were identified as “kokumi” taste enhancers in fractions 3-5-9 and 3-5-10. Although the presence of γ-glutamyl-tyrosine, γ-glutamyl-phenylalanine, raffinose, and stachyose in soybean seeds has been reported,Citation19,20) this is the first indication that these peptides and oligosaccharides contribute to the “kokumi” taste sensation in soybean extracts, soymilk, and their derivatives.
Quantitative analysis of the contributors to “kokumi” taste sensation
In order to determine the quantitative effect of the contributors to the “kokumi” taste sensation in soybean seeds, quantitative analysis of two γ-glutamyl peptides and two oligosaccharides in soybean seeds was carried out; the low-molecular weight fraction of the soybean water extract separated by a UF membrane with a molecular weight cut-off profile of <10,000 was used. The γ-glutamyl-phenylalanine content was 1.4 times greater than that of γ-glutamyl-tyrosine in the low-molecular weight fraction of the soybean seed extract and soybean seeds (Table ). On the other hand, the stachyose content was 3.9 times greater than that of the raffinose content in the low-molecular weight fraction of the soybean seed extract and soybean seeds. These data suggest that these γ-glutamyl peptides and oligosaccharides were extracted by water without affecting the ratio.
Table 1. Quantitative analysis of γ-glutamyl peptides and oligosaccharides in low-molecular weight fraction separated by UF membrane and soybean seeds.
Previous studies showed that the γ-glutamyl peptide content was almost the same among the specific soybean varieties,Citation19) and the oligosaccharide content depended on the soybean variety.Citation20 Such discrepancies in γ-glutamyl peptide contents among studies might be due to the use of different soybean varieties, such as the case with oligosaccharides. To clarify the distribution of “kokumi” taste contributors in various soybean varieties, the determination of γ-glutamyl peptide and oligosaccharide contents in various soybean seeds is now ongoing in our laboratory.
Sensory analysis of contributors to “kokumi” taste sensation
In order to evaluate the contributors to the “kokumi” taste threshold, various concentrations of γ-glutamyl peptides and oligosaccharides were assessed in water (pH 6.5) and the control solution by the ascending three alternative forced choice tests. The γ-glutamyl dipeptides exhibited a slightly bitter and astringent oral taste in water, which was reported previously.Citation8,12,13) On the other hand, these γ-glutamyl dipeptides imparted the “kokumi” taste sensation to a control solution containing monosodium glutamate, inosine monophosphate, and sodium chloride. Even though γ-glutamyl-tyrosine exhibited a high intrinsic taste threshold of 3.0 mmol/L in water, it showed a significantly lower “kokumi” taste threshold value of 5.0 μmol/L in the control solution (Table ). Similar trends were found for γ-glutamyl-phenylalanine, and were in agreement with the results of other γ-glutamyl peptides.Citation8) Furthermore, these γ-glutamyl peptides exhibited lower “kokumi” taste thresholds in the control solution containing raffinose and stachyose (Table ). In this experiment, these two oligosaccharides were added to the control solution in their natural concentration ratios to two γ-glutamyl peptides’ in the low-molecular weight fraction, as shown in Table .
Table 2. “Kokumi” taste recognition threshold concentrations of γ-glutamyl peptides in control solution with or without oligosaccharides determined by three-alternative forced-choice test.
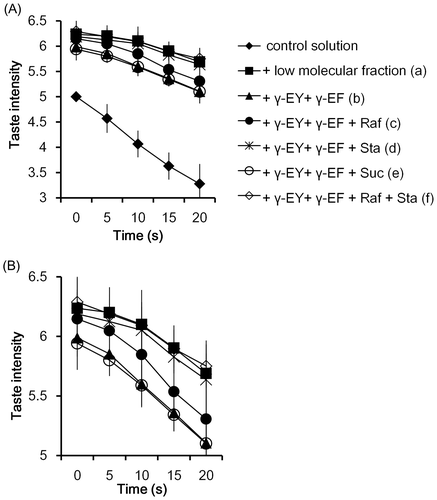
The time course profiles of the “kokumi” taste sensation intensity of the γ-glutamyl peptides and oligosaccharides were also evaluated. These substances were added to the control solution in their natural concentration ratios in the low-molecular weight fraction, and the taste intensity was compared that in the control solution. In the control solution alone or with only oligosaccharides (data not shown), the taste intensity gradually decreased after oral administration (0–20 s) (Fig. (A)). On the other hand, the taste intensity significantly increased (1.2–1.8 times) in the presence of the low-molecular weight fraction or the γ-glutamyl peptides over the entire period. However, the addition of only two γ-glutamyl peptides to the control solution did not raise the intensity to that of the low-molecular weight fraction. This prompted us to verify the combined effect of the two γ-glutamyl peptides and two oligosaccharides. Sensory analysis revealed that the combination of the γ-glutamyl peptides and oligosaccharides increased the taste intensity, and the intensity became almost equal to that elicited by the low-molecular weight fraction (Fig. (B); the scale is expanded to facilitate comparison). These results suggest that soybean oligosaccharides add to the “kokumi” taste activity of γ-glutamyl peptides. To the best of our knowledge, this is the first report of such phenomenon. The difference in the enhancement of the “kokumi” taste activity between raffinose and stachyose (Fig. ) was assumed to be caused by the different concentrations utilized in the experiments (Table ). Interestingly, sucrose, which was present in soybean seeds and the low-molecular weight fraction, did not enhance the “kokumi” taste sensation (Fig. ). In the low-molecular weight fraction, the sucrose content (1870 μg/100 mL) was higher than that of raffinose (6.9 times) and stachyose (1.8 times). However, among major the saccharides in soybean seeds, only sucrose did not enhance the “kokumi” taste activity. These results might indicate that each substance exhibited different reactivity with the “kokumi” taste receptor. Ohsu et al.Citation9) reported that the calcium-sensing receptor (CaSR) is a receptor for “kokumi” active substances, such as γ-glutamyl peptides, and produced a desirable “kokumi” taste sensation in humans. Moreover, Medina et al.Citation21) recently reported that glucose, sucrose, and sucralose acted as positive allosteric modulators of CaSR. Our data might suggest that the use of a combination of γ-glutamyl peptides and oligosaccharides synergistically activate CaSR. The detailed mechanism behind the enhanced “kokumi” taste sensation by γ-glutamyl peptides and oligosaccharides is unclear, and is currently under investigation in our laboratory.
Fig. 10. Time course profile of “kokumi” taste sensation of γ-glutamyl peptides and oligosaccharides.
Conclusions
Key contributors to the “kokumi” taste sensation were identified in soybean seeds using fractionation, LC–Q–TOF MS/MS, and human sensory analysis. γ-glutamyl-tyrosine and γ-glutamyl-phenylalanine caused the “kokumi” taste sensation at a low taste threshold in a control solution containing glutamic acid, inosine monophosphate, and sodium chloride. In addition, raffinose and stachyose exhibited a synergistic effect and enhanced the “kokumi” taste activity of γ-glutamyl peptides. Therefore, the combination of γ-glutamyl peptides and oligosaccharides caused an increase in taste intensity, and contributed to the “kokumi” taste sensation, which suggests that soybean extracts or soymilk could be used as “kokumi” taste sensation enhancers in food products. Studies on soybean varieties containing high concentrations of these contributors, as well as processing methods that enable the efficient extraction of such contributors are currently in progress, and the obtained results will lead to improved palatability of food products containing soybean extracts or soymilk.
Author contributions
M.S. convinced the research theme. M.S., M.H., T.K., Y.H., and Y.M. designed and reviewed the study. M.S., Y.M., H.T., and K.M. performed the experiments and analyzed the data. M.S. wrote the manuscript.
Disclosure statement
The authors declare no conflicts of interest.
Acknowledgments
We thank members of the R&D division of Fuji Oil Company for their assistance with the study. We also would like to thank Editage (www.editage.jp) for English language editing.
Notes
Abbreviations: UPLC–Q-TOF-MS, Ultra Performance Liquid Chromatography–quadrupole -time-of-flight-mass spectrometry; UF, ultrafiltration; GPC, gel permeation chromatography; HPLC, high performance liquid chromatography; HILIC, hydrophilic interaction chromatography; CaSR, calcium-sensing receptor.
References
- Broun P, Gettner S, Somerville C. Genetic engineering of plant lipids. Annu Rev Nutr. 1999;19:197–216.10.1146/annurev.nutr.19.1.197
- Thelen JJ, Ohlrogge JB. Metabolic engineering of fatty acid biosynthesis in plants. Metab Eng. 2002;4:12–21.10.1006/mben.2001.0204
- Moure A, Sineiro J, Domínguez H, et al. Functionality of oilseed protein products: a review. Food. Res. Int. 2006;39:945–963.10.1016/j.foodres.2006.07.002
- MacMasters MM, Woodruff S, Klaas H. Studies on soybean carbohydrates. Ind Eng Chem. 1941;13:471–474.
- Moriyama T, Kishimoto, k, Nagai K, et al. Soybean β-conglycinin diet suppresses serum triglyceride levels in normal and genetically obese mice by induction of β-oxidation, downregulation of fatty acid synthase, and inhibition of triglyceride absorption. Biosci Biotechnol Biochem. 2004;68:352–359.10.1271/bbb.68.352
- Hayakawa K, Mizutani J, Wada K, et al. Effects of soybean oligosaccharides on human faecal flora. Microb Ecol Health D. 1990;3:293–303.10.3109/08910609009140252
- Ueda Y, Sakaguchi M, Hirayama K, et al. Characteristic flavor constituents in water extract of garlic. Agric Biol Chem. 1990;54:163–169.
- Dunkel A, Köster J, Hofmann T. Molecular and sensory characterization of γ-glutamyl peptides as key contributors to the kokumi taste of edible beans (Phaseolus Vulgaris L.). J Agric Food Chem. 2007;55:6712–6719.10.1021/jf071276u
- Ohsu T, Amino Y, Nagasaki H, et al. Involvement of the calcium-sensing receptor in human taste perception. J Biol Chem. 2010;285:1016–1022.10.1074/jbc.M109.029165
- Ueda Y, Tsubuku T, Miyajima R. Composition of sulfur-containing components in onion and their flavor characters. Biosci Biotechnol Biochem. 1994;58:108–110.10.1271/bbb.58.108
- Ottinger H, Hofmann T. Identification of the taste enhancer alapyridaine in beef broth and evaluation of its sensory impact by taste reconstitution experiments. J Agric Food Chem. 2003;51:6791–6796.10.1021/jf034788r
- Toelstede S, Dunkel A, Hofmann T. A series of kokumi peptides impart the long-lasting mouthfulness of matured gouda cheese. J Agric Food Chem. 2009;57:1440–1448.10.1021/jf803376d
- Hillmann H, Hofmann T. Quantitation of key tastants and re-engineering the taste of parmesan cheese. J Agric Food Chem. 2016;64:1794–1805.10.1021/acs.jafc.6b00112
- Degenhardt AG, Hofmann T. Bitter-tasting and Kokumi-enhancing molecules in thermally processed avocado (Persea americana Mill.). J Agric Food Chem. 2010;58:12906–12915.10.1021/jf103848p
- Takahashi H, Kamakari K, Goto T, et al. 9-Oxo-10(E),12(Z),15(Z)-octadecatrienoic acid activates peroxisome proliferator-activated receptor α in hepatocytes. Lipids 2015;50:1083–1091.10.1007/s11745-015-4071-3
- Frank O, Ottinger H, Hofmann T. Characterization of an intense bitter-tasting 1H,4H-Quinolizinium-7-olate by application of the taste dilution analysis, a novel bioassay for the screening and identification of taste-active compounds in foods. J Agric Food Chem. 2001;49:231–238.10.1021/jf0010073
- Wilkens WF, Lin FM. Gas chromatographic and mass spectral analyses of soybean milk volatiles. J Agric Food Chem. 1970;18:333–336.10.1021/jf60169a003
- Torres-Penaranda AV, Reitmeier CA, Wilson LA, et al. Sensory characteristics of soymilk and tofu made from lipoxygenase-free and normal soybeans. J Food Sci. 1998;63:1084–1087.
- Morris CJ, Thompson JF. The isolation and characterization of γ-l-glutamyl-l-tyrosine and γ-l-glutamyl-l-phenylalanine from soybeans. Biochemistry 1962;1:706–709.10.1021/bi00910a026
- Hou A, Chen P, Alloatti J, et al. Genetic variability of seed sugar content in worldwide soybean germplasm collections. Crop Sci. 2009;49:903–912.10.2135/cropsci2008.05.0256
- Medina J, Nakagawa Y, Nagasawa M, et al. Positive allosteric modulation of the calcium-sensing receptor by physiological concentrations of glucose. J Biol Chem. 2016;291:23126–23135.10.1074/jbc.M116.729863