
ABSTRACT
1-Kestose is a key prebiotic fructooligosaccharide (FOS) sugar. Some β-fructofuranosidases (FFases) have high transfructosylation activity, which is useful for manufacturing FOS. Therefore, obtaining FFases that produce 1-kestose efficiently is important. Here, we established a rapid FFase evaluation method using Escherichia coli that display different FFases fused to a PgsA anchor protein from Bacillus subtilis. E. coli cell suspensions expressing the PgsA-FFase fusion efficiently produce FOS from sucrose. Using this screening technique, we found that the E. coli transformant expressing Aspergillus kawachii FFase (AkFFase) produced a larger amount of 1-kestose than those expressing FFases from A. oryzae and A. terreus. Saturation mutagenesis of AkFFase was performed, and the mutant G85W was obtained. The E. coli transformant expressing AkFFase G85W markedly increased production of 1-kestose. Our results indicate that the surface display technique using PgsA is useful for screening of FFases, and AkFFase G85W is likely to be suitable for 1-kestose production.
Abbreviations: AkFFase: Aspergillus kawachii FFase; AoFFase: Aspergillus oryzae FFase; AtFFase: Aspergillus terreus FFase; FFase: β-fructofuranosidase; FOS: fructooligosaccharide; fructosylnystose: 1F-β-fructofuranosylnystose
Graphical Abstract
Products from the incubation of sucrose with E. coli cell suspensions expressing the surface-displayed PgsA-AkFFase wild-type and mutant proteins.
β-Fructofuranosidase (FFase) (EC 3.2.1.26) hydrolyzes sucrose to produce glucose and fructose [Citation1]. Some FFases also catalyze transfructosylation to form oligosaccharides and thus the enzymes are useful for producing fructooligosaccharide (FOS), which include 1-kestose (β-D-Fruf-(2→1)-β-D-Fruf-(2↔1)-α-D-Glcp), nystose (β-D-Fruf-(2→1)-β-D-Fruf-(2→1)-β-D-Fruf-(2↔1)-α-D-Glcp), and other sugars. The reaction process during the incubation of a mixture of Aspergillus FFases and sucrose has already been reported. In the first step, sucrose is mainly transfructosylated with another sucrose molecule to produce 1-kestose and glucose, but a small amount of sucrose is also hydrolyzed to form glucose and fructose. In the subsequent steps, similar transfructosylation reactions occur between 1-kestose and sucrose, and between nystose and sucrose, to give a mixture of nystose and glucose, and a mixture of 1F-β-fructofuranosylnystose (fructosylnystose) and glucose, respectively [Citation1].
In the CAZy database, FFases are classified into glycoside hydrolase (GH) families GH32 and GH68 [Citation2]. Among GH32 and GH68 FFases, GH32 enzymes from Aspergillus species have been reported to produce a large amount of FOS from sucrose. FOS production by FFases from A. niger ATCC 20,611 [Citation3] and A. japonicus CB05 [Citation4] have been extensively studied. Whole genome sequences of several Aspergillus species have recently been determined [Citation5], and we have shown that a FFase from A. kawachii IFO 4308 (AkFFase; 68% amino acid sequence identity to both of the above FFases) is a strong FOS producer [Citation6]. Potential GH32 FFase genes were annotated in A. oryzae RIB 40 (AoFFase; UniProtKB: Q2U3S3) and in A. terreus NIH 2624 (AtFFase; UniProtKB: Q0CMT8) genomes, and their amino acid sequences have 68% and 62% identity to AkFFase, respectively. These two enzymes are expected to have high transfructosylation activity, but their enzymatic properties have not been confirmed. FOS are well researched and commercialized prebiotics, and are known to improve the intestinal environment. 1-Kestose is a key prebiotic component in FOS for growth stimulation of Lactobacilli and Bifidobacteria [Citation7,Citation8], for improvement of clinical symptoms in infants with atopic dermatitis [Citation9], and for insulin-signaling stimulation [Citation10]. Therefore, efficient production of purified 1-kestose is industrially important. Crystallization is needed for 1-kestose purification, but production from sucrose results in a large accumulation of nystose as a by-product, which inhibits crystallization of 1-kestose. In addition, nystose is difficult to efficiently separate from 1-kestose by chromatography at industry scale. Therefore, FFases not only with high transfructosylation activity but also with low nystose production are ideal for 1-kestose purification.
To establish an evaluation method for FFases suitable for 1-kestose production, we used an E. coli cell surface display system based on the PgsA anchor protein [Citation11]. This expression system is useful because E. coli is a common host organism in molecular biology. However, E. coli generally express recombinant proteins intracellularly, and disruption of E. coli cells is needed to measure activity. In addition, heterologous protein production in E. coli often results in insoluble inclusion bodies. To overcome these problems, a surface display system using the PgsA anchor protein has been reported. PgsA, a cell surface anchoring protein from Bacillus subtilis involved in poly-γ-glutamate synthesis, is fused to the protein of interest, and activity can be measured without disruption and purification [Citation12]. PgsA-fusion proteins were shown to be displayed by immunofluorescence labeling [Citation12]. Using this cell surface display system, we compared 1-kestose production of FFases from Aspergillus species, and obtained variant FFases suitable for 1-kestose production.
Materials and methods
Construction of expression plasmids
E. coli JM109 (Takara Bio Inc.) was used for construction of plasmids. Plasmids constructed and oligonucleotides (FASMAC Co., Ltd., Japan) are shown in . KOD-Plus (Toyobo Co., Ltd., Japan) was used for PCR.
Table 1. Plasmids and oligonucleotide primers used.
A plasmid with the PgsA anchor protein was constructed as described below. DNA encoding a PgsA anchor protein (GenBank: AB016245.1) was amplified by PCR from the genomic DNA of Bacillus subtilis IAM1026 using the oligonucleotides PgsA_NdeF and PgsA_BglR. The obtained PCR product was digested with restriction enzymes NdeI and BglII and used as a PgsA-DNA fragment. A pCDFDuet-1 plasmid (hereafter, abbreviated as pCDF plasmid; Merck KGaA) was digested with restriction enzymes NdeI and BglII, and the pCDF plasmid fragment was acquired. Ligation of the pCDF plasmid fragment and the PgsA-DNA fragment was performed using DNA Ligation Kit Ver. 2.1 (Takara Bio Inc., Japan) according to the manufacturer’s instructions to make the pCDF-PgsA recombinant plasmid.
A plasmid with A. kawachii FFase (AkFFase) was constructed as described below. Using the Signal-P4 server (http://www.cbs.dtu.dk/services/SignalP/), the N-terminal signal sequence of AkFFase was predictedto comprise 24 amino acid residues MKLQTASVLLGSAAAASPSMQTRA. That sequence was omitted in the primer design, and the primers Kawachii_F and Kawachii_R were used for PCR amplification. DNA encoding wild-type AkFFase (GenBank: GAA88101.1) without its signal sequence was synthesized (GenScript Japan Inc., Japan). Subsequently, a DNA fragment of AkFFase was amplified by PCR from the synthesized DNA using the oligonucleotides Kawachii_F and Kawachii_R. In addition, a pCDF-PgsA-DNA fragment was amplified by PCR from pCDF-PgsA recombinant plasmid using VecInv_F and VecInv_R. The DNA fragment of AkFFase and the pCDF-PgsA-DNA fragment were ligated using In-Fusion HD Cloning Kit (Takara Bio Inc.) according to the manufacturer’s instructions. The resulting plasmid pCDF-PgsA-AkFFase was designated as wild-type AkFFase recombinant plasmid.
Similarly, pCDF-PgsA-AoFFase and pCDF-PgsA-AtFFase recombinant plasmids were constructed for the expression of A. oryzae FFase (AoFFase) and A. terreus FFase (AtFFase), respectively. The cDNAs encoding AoFFase (GenBank: BAE63792.1) and AtFFase (GenBank: EAU34065.1) also lacking the signal sequence were synthesized and amplified using the oligonucleotides Oryzae_F and Oryzae_R, and Terreus_F and Terreus _R, respectively. The signal sequences of AoFFase and AtFFase were predicted using the Signal-P4 server to comprise 20 amino acid residues MKLSTASALVTSQAAYAASA and MKSSVTRMGLVASLVASAAA, respectively.
Construction of site-saturation library plasmids
Site-saturation library plasmid construction for site-directed mutagenesis was achieved by self-ligation of PCR fragments made from oligonucleotides containing the degenerate nnk (where n = a, t, g, c; k = g, t) codon for the 5ʹ-end of forward primers, which codes for all 20 amino acids and the TAG stop codon. For position Gly85 of AkFFase, a forward primer was used to create a mutation, and inverse PCR was performed using pCDF-PgsA-AkFFase as a template. That is, a site-saturation library of plasmids at position Gly85 was constructed using the oligonucleotides KawachiiG85X_F and KawachiiG85_R.
After PCR, the PCR product was digested with DpnI restriction enzyme at 37°C for 1 h and then subjected to agarose gel electrophoresis. The gel was excised and DNA fragment was purified. Ligation high (Toyobo Co., Ltd.) and T4 Polynucleotide Kinase (Toyobo Co., Ltd.) were added and incubated at 16°C for 1 h for self-ligation of the DNA fragments to prepare a recombinant plasmids with DNA encoding the mutated FFases.
Evaluation of FOS production
Recombinant plasmids were transferred to E. coli BL21 (DE3) competent cells (Cosmo Bio Co., Ltd., Japan) to obtain recombinant E. coli, and cultured on a solid medium at 30°C overnight. Recombinant E. coli clones were isolated, inoculated with 0.5 mL of M9 SEED medium, and cultured at 220 rpm at 30°C for 20 h. Subsequently, a 5-μL aliquot was inoculated with 5 mL of M9 Main medium and cultured at 220 rpm at 25°C for 24 h. The composition of the M9 SEED medium and M9 Main medium is shown below. M9 SEED medium (a total of 100 mL): 72 mL of water, 20 mL of 5 × M9 salt, 5 mL of 20% casamino acid, 2 mL of 20% D-glucose, 1 mL of 2 mg/mL thymine, 0.2 mL of 50 mM CaCl2, 40 μL of 2.5 M MgCl2, 28 μL of 100 mg/mL FeSO4, and antibiotic (final concentration 50 μg/mL of streptomycin sulfate). M9 Main medium (a total of 100 mL): 67 mL of water, 20 mL of 5 × M9 salt, 5 mL of 20% casamino acid, 1 mL of 2 mg/mL thymine, 0.2 mL of 50 mM CaCl2, 28 μL of 100 mg/mL FeSO4, 2 mL of Overnight Express Autoinduction System 1 (O.N.E.; Merck KGaA, Germany) Sol. 1, 5 mL of O.N.E. Sol. 2, 100 μL of O.N.E. Sol. 3, and antibiotic (final concentration 50 μg/mL of streptomycin sulfate).
Sodium phosphate buffer (40 mM, pH7.0) containing 30% (w/w) sucrose was prepared and designated as a 30% sucrose solution. An aliquot (0.5 mL) of recombinant E. coli culture was centrifuged to collect bacteria, 30% sucrose solution (350 μL) was added to the bacteria, and resuspended. The solution was reacted at 200 rpm at 30°C for 3 h, or the reactions were performed for 1, 3, 6, 9, and 24 h when the time course of FOS production was monitored. Subsequently, 50 μL of the reaction solution was diluted by the addition of 950 μL of water and heated at 100°C for 10 min. Supernatant was recovered by centrifugation at 15,000 × g at 4°C for 10 min and filtered through a 0.45 μm pore size filter. FOS production in these filtered supernatants was determined by HPLC using a Shodex SUGAR KS-802 column as described [Citation13].
Cultivation and analysis of AkFFase mutants
The cultivation and the reaction of sucrose into FOS using E. coli BL21 (DE3) transformed with the site-saturation library plasmid was performed in a 96 Deep Well Plate (AxyGen Scientific, Inc., CA, USA) as described above. After HPLC analysis, clones that accumulated 1-kestose were selected and the AkFFase gene was sequenced.
Results
Surface display expression of aspergillus FFases
For the evaluation of FOS production using heterologously expressed FFases, plasmids with a fusion of PgsA and FFase were constructed, and surface display expression in E. coli was tested. We constructed a plasmid carrying a gene fusion of PgsA-AkFFase, and the resulting plasmid pCDF-PgsA-AkFFase was introduced into E. coli BL21(DE3). E. coli transformant cells expressing AkFFase using PgsA cell surface display system were collected, the cell suspension was incubated with 30% sucrose, and the supernatant was analyzed by HPLC (). The results indicated that two FOS, 1-kestose and nystose, mainly accumulated in the reaction mixture, and a small amount of another FOS fructosylnystose was found ()). Under this condition, the amount of 1-kestose and nystose were 32.6 mg and 11.1 mg in 350 μL of reaction mixture, which were calculated to be 93.0 g/L and 31.8 g/L, respectively.
Figure 1. HPLC analysis of the products from the incubation of sucrose with E. coli cell suspensions expressing (a) PgsA-AkFFase, (b) PgsA-AoFFase, (c) PgsA-AtFFase, and (d) PgsA-AkFFase G85W.
FN, fructosylnystose; N, nystose; K, 1-kestose; S, sucrose; G, glucose; F, fructose.
We then tested the surface display expression of two other FFases from A. oryzae (AoFFase; UniProtKB, Q2U3S3) and A. terreus (AtFFase; UniProtKB, Q0CMT8), which have 68% and 62% sequence identity with AkFFase, respectively. E. coli transformant expressing AoFFase and AtFFase fused to PgsA were constructed, and FOS production was measured by HPLC (, )). Three FOS, 1-kestose, nystose, and fructosylnystose, were detected in the reaction mixtures, but the ratios of fructosylnystose/nystose/1-kestose were different among E. coli transformants expressing AkFFase, AoFFase, and AtFFase. Because the accumulation of fructosylnystose was not high, the amounts of nystose and 1-kestose were expressed as grams per one liter of reaction solution, and the values were compared (). Of the three, E. coli transformants expressing AkFFase accumulated the largest amount of 1-kestose.
Figure 2. Amount of product from the incubation of sucrose with E. coli cell suspensions expressing PgsA-AkFFase, PgsA-AoFFase, PgsA-AtFFase, and PgsA-AkFFase G85W.
Black bar, 1-kestose; Gray bar, nystose. Error bars represent SEM (standard error of the mean). Each bar of PgsA-AkFFase and PgsA-AkFFase G85W corresponds to the average of four experiments, and each bar of PgsA-AoFFase and PgsA-AtFFase corresponds to the average of two experiments.
Enhancing the production of 1-kestose by saturation mutagenesis of AkFFase
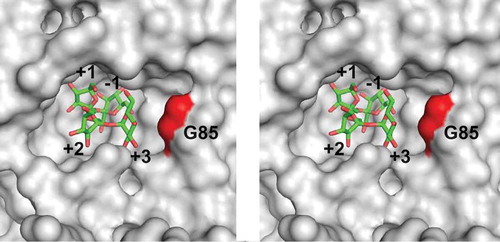
We aimed to improve 1-kestose production by AkFFase. To select the site where the mutation was introduced, a nystose-bound model of AkFFase was constructed. The unliganded structure of AkFFase (PDB ID, 5XH8) [Citation6] and the complex structure of A. japonicus FFase – nystose (PDB ID, 3LEM) [Citation4] were superimposed, and the coordinate of nystose was then placed in AkFFase (). We modified Gly85 because the residue was close to a glucose unit at subsite +3 (abbreviated Glc +3); the distance between the Cα atom of Gly85 and the C4 atom of Glc +3 was 4.8 Å, and no interactions between Gly85 and fructose units at subsites −1, +1, and +2 were found.
Figure 3. Stereo view of the catalytic cleft of AkFFase. The model of nystose (green) is obtained from PDB entry 3LEM, and placed on the structure of AkFFase (PDB ID, 5XH8).
Subsite numbers are indicated from −1 to +3.
A saturation mutagenesis library at position 85 of pCDF-PgsA-AkFFase was created, and 96 colonies were screened. FOS production of E. coli transformants was measured by HPLC, and one E. coli strain that markedly produced a higher amount of 1-kestose was identified ()). The nucleotide sequence of the obtained plasmid revealed that the mutation at position 85 was Trp. The amounts of 1-kestose and nystose produced by the E. coli transformant expressing AkFFase G85W were 55.7 mg and 4.03 mg in 350 μL of reaction mixture, which calculated to be 159 g/L and 11.5 g/L, respectively, after the reaction for 3h (). The ratio of 1-kestose/nystose produced by wild-type AkFFase was 100:34, and that produced by the G85W mutant was 100:7.2. Therefore, production of 1-kestose by the E. coli transformant expressing AkFFase G85W was markedly increased compared to the E. coli transformant with AkFFase wild-type.
The time course of FOS production by E. coli transformants was investigated (). The production of 1-kestose by E. coli transformant expressing AkFFase G85W was especially higher than that expressing wild-type AkFFase in the early stage of the reaction (1–3 h in ), although the production was slightly varied in each experiment and the amount of 1-kestose accumulated for 3h was somewhat larger than the value in .
Figure 4. Time courses of the amounts of sucrose, 1-kestose, and nystose in the reaction using E. coli cell expressing PgsA-AkFFase wild-type enzyme (dotted lines) and PgsA-AkFFase G85W mutant (solid lines).
Symbols: white square, wild-type and sucrose; black square, G85W and sucrose; white circle; wild-type and 1-kestose; black circle, G85W and 1-kestose; white triangle, wild-type and nystose; black triangle, G85W and nystose.
Discussion
Several surface display expression systems using E coli have been reported reviewed in [Citation14]. The first report of surface display expression of clan GH-J enzymes was Zymomonas mobilis GH68 levansucrase expressed by fusion with Pseudomonas syringae ice-nucleation protein [Citation15]. In this system, E. coli cells displaying levansucrase converted 130 g/L sucrose into 44 g/L levan for a 34% conversion yield. This study demonstrated that surface display expression of clan GH-J enzymes is useful for the production of sugars. In our study, all the three FFases belonging to GH32, AkFFase, AoFFase, and AtFFase, were successfully displayed on the E. coli surface. The molecular weight of these GH32 enzymes is about 65 kDa, which is larger than that of Z. mobilis GH68 levansucrase (45 kDa), but both GH32 and GH68 are classified into clan GH-J. The PgsA protein has been reported to have some beneficial properties for surface display expression, such as display of large molecular weight proteins [Citation12] and expressed protein embedded in the cell is more stable than the purified soluble form [Citation16]. The favorable properties of PgsA enhanced surface display of some GH32 FFases from Aspergillus in this study.
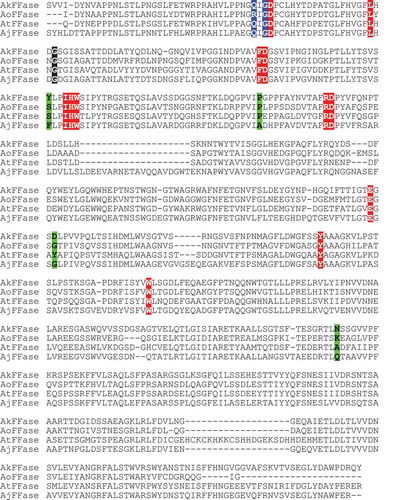
Our results also showed that production of 1-kestose is different among AkFFase, AoFFase, and AtFFase despite similar amino acid sequences. The sequence alignment indicates that amino acid residues near the catalytic center, subsites −1 and +1, (shown in red in ) [Citation6] are strictly conserved among the three enzymes. On the other hand, some residues that are distantly located from the catalytic center (shown in green or blue in ) and reportedly involved in the transfructosylation in A. japonicus FFase (shown in green in ) [Citation17], are not conserved. These findings suggest that subtle differences near the entrance of the catalytic cleft may affect FOS production.
Figure 5. Comparison of amino acid sequences of AkFFase, AoFFase, AtFFase, and A. japonicus FFase (AjFFase).
The sequences were aligned using ClustalOmega server. Colors: red, residues in subsites −1 and +1; black, Gly85 in AkFFase and the corresponding residues; blue, residues located inside the catalytic cleft other than those shown in red or black; green, residues that located distantly from the catalytic site but reportedly influence transfructosylation.
We performed saturation mutagenesis of AkFFase, and the E. coli transformant expressing AkFFase G85W accumulated a 2.4-fold larger amount of 1-kestose (159 g/L) and only 36% of nystose (11.5 g/L) compared to that expressing wild-type AkFFase (93.0 g/L and 31.8 g/L, respectively) after the reaction for 3h, which suggests that the G85W mutant converted sucrose into 1-kestose as nearly the sole transfructosylation product. The replacement of glycine by the bulky tryptophan residue may prevent binding of sugars at subsite +3 (), which results in a decrease of nystose production.
The time course of FOS production in showed that 1-kestose was accumulated in the early stage (1–3 h) and then degraded in the late stage (9–24 h), resulting in that the difference of amount of 1-kestose between the reactions of two E. coli transformants was highest at 3 h. Although the values were relatively similar in the late stage, the amount of 1-kestose by E. coli transformant expressing AkFFase G85W was still higher than that expressing wild-type AkFFase.
Crystallization is important for the purification of sugars, and in the case of sucrose, samples containing less than 10% of other sugars had good production [Citation18,Citation19]. We also found that 10% nystose relative to the amount of 1-kestose inhibited crystallization of 1-kestose (Tochio T., Ito N., Nakamura S., Fukatani Y., Fujii T., Tamura K. Japan patent, JP 2017–505,409). Therefore, the 1-kestose syrup produced by the E. coli transformant with AkFFase G85W appears to be ideal for crystallization of 1-kestose.
Author contributions
T. Tochio and T. Fujii planned the experiments. K. Tamura and T. Fujii constructed the expression plasmids and performed experiments of the mutant screening. T. Tochio and K. Hirano analyzed the enzymatic properties. T. Fujii wrote the manuscript. T. Tonozuka edited the manuscript. All authors read and approved the final manuscript.
Disclosure statement
No potential conflict of interest was reported by the authors.
References
- Vijn I, Smeekens S. Fructan: more than a reserve carbohydrate. Plant Physiol. 1999;120:351–359.
- Lombard V, Golaconda Ramulu H, Drula E, et al. Carbohydrate-active enzymes database (CAZy) in 2013. Nucleic Acids Res. 2014;42:490–495.
- Yanai K, Nakane A, Kawate A, et al. Molecular cloning and characterization of the fructooligosaccharide-producing beta-fructofuranosidase gene from Aspergillus niger ATCC 20611. Biosci Biotechnol Biochem. 2001;42:766–773.
- Chuankhayan P, Hsieh CY, Huang YC, et al. Crystal structures of Aspergillus japonicus fructosyltransferase complex with donor/acceptor substrates reveal complete subsites in the active site for catalysis. J Biol Chem. 2010;285:23251–23264.
- Futagami T, Mori K, Yamashita A, et al. Genome sequence of the white koji mold Aspergillus kawachii IFO 4308, used for brewing the Japanese distilled spirit shochu. Eukaryot Cell. 2011;10:1586–1587.
- Nagaya M, Kimura M, Gozu Y, et al. Crystal structure of a β-fructofuranosidase with high transfructosylation activity from Aspergillus kawachii. Biosci Biotechnol Biochem. 2017;81:1786–1795.
- Endo A, Nakamura S, Konishi K, et al. Variations in prebiotic oligosaccharide fermentation by intestinal lactic acid bacteria. Int J Food Sci Nutr. 2016;67:125–132.
- Suzuki N, Aiba Y, Takeda H, et al. Superiority of 1-kestose, the smallest fructo-oligosaccharide, to a synthetic mixture of fructo-oligosaccharides in the selective stimulating activity on Bifidobacteria. Biosci Microflora. 2006;25:109–116.
- Shibata R, Kimura M, Takahashi H, et al. Clinical effects of kestose, a prebiotic oligosaccharide, on the treatment of atopic dermatitis in infants. Clin Exp Allergy. 2009;39:1397–1403.
- Tochio T, Kitaura Y, Nakamura S, et al. An alteration in the cecal microbiota composition by feeding of 1-Kestose results in a marked increase in the cecal butyrate content in rats. PLOS One. 2016;11:e0166850.
- Candela T, Fouet T. Poly-gamma-glutamate in bacteria. Mol Microbiol. 2006;60:1091–1098.
- Narita J, Okano K, Tateno T, et al. Display of active enzymes on the cell surface of Escherichia coli using PgsA anchor protein and their application to bioconversion. Appl Microbiol Biotechnol. 2006;70:564–572.
- Hisano H, Kanazawa A, Yoshida M, et al. Coordinated expression of functionally diverse fructosyltransferase genes is associated with fructan accumulation in response to low temperature in perennial ryegrass. New Phytol. 2008;178:766–780.
- Lee SY, Choi JH, Xu Z. Microbial cell-surface display. Trends Biotechnol. 2003;21:45–52.
- Jung HC, Lebeault JM, Pan JG. Surface display of Zymomonas mobilis levansucrase by using the ice-nucleation protein of Pseudomonas syringae. Nat Biotechnol. 1998;16:576–580.
- Narita J, Okano K, Kitao T, et al. Display of alpha-amylase on the surface of Lactobacillus casei cells by use of the PgsA anchor protein, and production of lactic acid from starch. Appl Environ Microbiol. 2006;72:269–275.
- Trollope KM, Görgens JF, Volschenk H. Semirational directed evolution of loop regions in Aspergillus japonicus β-fructofuranosidase for improved fructooligosaccharide Production. Appl Environ Microbiol. 2015;81:7319–7329.
- Chen AC. Ingredient technology by the sugar cocrystallization process. Int Sugar J. 1994;96:493–496.
- Bhandari BR, Hartel RW. Co-crystallization of sucrose at high concentration in the presence of glucose and fructose. J Food Sci. 2002;67:1797–1802.