
ABSTRACT
The study was aimed to compare the satiating effect of various protein hydrolysates in rats and examine the underlying mechanism associated with the satiety hormones. Food intake and portal satiety hormone levels were measured in rats. Enteroendocrine cell-lines were employed to study the direct effect of protein hydrolysates on gut hormone secretions. The results showed that oral preload of wheat gluten hydrolysate (WGH) suppressed food intake greater and longer than other hydrolysates. The portal peptide-YY levels in WGH-treated rats at 2 h and 3 h were higher than those in control- and lactalbumin hydrolysate (LAH)-treated rats. In a distal enteroendocrine cell model, WGH more potently stimulated glucagon-like peptide-1 secretion than LAH, and the effect was largely enhanced by pepsin/pancreatin digestion of WGH. These results suggest WGH is potent in activating enteroendocrine cells to release satiety hormones leading to the prolonged suppression of food intake.
Graphical Abstract
Among various protein hydrolysates, oral administration of wheat gluten hydrolysate (WGH) potently stimulates PYY secretion and suppresses food intake in rats.
To explain the complex process of appetite regulation, two different mechanisms are proposed: the long-term regulation of food intake via adiposity signals such as leptin and insulin; and short-term regulation from meal to meal, which is coordinated by several anorexigenic and orexigenic hormones secreted by the gastrointestinal tract [Citation1–Citation3]. Satiety is a physiological process that is mediated through a complex system connected with appetite regulation [Citation4,Citation5]. An understanding of the pathways by which foodstuff induces satiety is becoming critical for human health. The link between foodstuff and relevant gut hormones is also critically important.
Cholecystokinin (CCK), glucagon-like peptide 1 (GLP-1) and peptide YY (PYY) are the major gut hormones that induce satiety. CCK is produced by I cells located in the duodenum and upper jejunum. CCK is released mainly in response to dietary protein or its hydrolysates [Citation6–Citation8]. The release of GLP-1 from enteroendocrine L cells in the distal intestine is stimulated by diverse molecules, such as glucose and fatty acids. Recently, it has been reported that protein hydrolysates exerted a marked effect on GLP-1 secretion [Citation9–Citation11]. The PYY-producing cells are mostly co-localized with the GLP-1-producing cells in the distal but not in the proximal gut [Citation12,Citation13]. Although it has been shown that the release of PYY relies on nutrient ingestion [Citation14–Citation16], the stimulatory mechanism remains largely unknown.
Dietary proteins are considered to have the most satiating effect among macronutrients [Citation17–Citation19], and the mechanism by which proteins exert their satiating effect may include the stimulation of gut hormone signals (CCK, GLP-1, and PYY). However, data on the satiating efficacy with regard to the quality and source of protein are limited and inconsistent [Citation20–Citation22]. The purpose of the present study was to elucidate the relationship between anorexic gut hormone responses and the satiating effect induced by various protein hydrolysates.
Materials and methods
Materials
Wheat gluten hydrolysate (HyPep 4601, total nitrogen 11%, amino nitrogen > 2%, ash < 20%, loss on drying < 6%, average molecular weight 660, molecular weight distribution; 10.1% for > 2000, 57.9% for 500–2000, 32.0% for < 500), lactalbumin enzymatic hydrolysate (LAH, total nitrogen 12.9%, average molecular weight 240, molecular weight distribution; 2.1% for > 2000, 33.3% for 500–2000, 64.5% for < 500), potato protein hydrolysate (peptone from potatoes, PPH, total nitrogen 10.6%, amino nitrogen 5.3%, ash 22%, loss on drying 4.8%, average molecular weight 340, molecular weight distribution; 4.6% for > 2000, 28.6% for 500–2000, 66.8% for < 500), and bovine serum albumin (BSA) were purchased from Sigma Aldrich (St. Louis, MO). The soybean protein hydrolysate (Hinute, SPH, average total nitrogen 13.8%, ash 5.5%, loss on drying 5.5%, molecular weight 2500, molecular weight distribution; 59.4% for > 2000, 35.8% for 500–2000, 4.8% for < 500) was kindly provided by Fuji oil Co., Ltd. (Osaka, Japan). The average molecular weight was determined by the trinitro-benzene-sulfonic acid (TNBS) method using glycine as the standard. The molecular weight distributions of the protein hydrolysates were determined with size-exclusion chromatography in an FPLC system (AKTA explorer 10S, GE Health Sciences, USA) using a Superdex Peptide 10/300 GL column (GE Health Sciences) [Citation23]. Unless otherwise specified, the other materials were purchased from Wako Pure Chemical Industries, Ltd. (Osaka, Japan).
Measurement of food intake after loading of protein hydrolysates in rats
Male Wistar/ST rats (7 weeks of age) were purchased from Japan SLC (Hamamatsu, Japan) and were fed an AIN-93G-based semipurified diet [Citation24]. The diet (3.86 kcal/g) consisted of 250 g/kg casein, 602.5 g/kg sucrose, 50 g/kg soybean oil, 50 g/kg cellulose, 35 g/kg mineral mixture (AIN-93G), 10 g/kg vitamin mixture (AIN-93G), and 2.5 g/kg choline bitartrate. All of the rats were housed individually in a temperature- and humidity-controlled room (22 ± 2°C, 55% ± 5%) under a 12:12-h light-dark cycle (lights on during 20:30 – 08:30). Rats deprived of food for 12 h (20:00 – 08:00) were trained daily for intra-gastric administration using 1–2 mL of water through a feeding tube (Safeed Feeding tube Fr.5, 40 cm; Terumo, Tokyo, Japan) before receiving access to the diet (08:00). After acclimation for 7 days (until the daily food intake became stable), the rats (weighing approximately 250–300 g) received the test solutions through the feeding tube immediately before receiving access to the food. The study was approved by the Hokkaido University Animal Committee, and the animals were maintained in accordance with the guidelines for the care and use of laboratory animals at Hokkaido University (Approval number: 08–0138).
The satiety effect of protein hydrolysates was evaluated with the crossover study design test (, , ) and ). Rats were given oral administrations of water (control) and protein hydrolysate in respective order everyday until they receive all of treatments. To examine the consistency of the cross over study results, single parallel administration study was also performed (). The allocation of animals to the experiments was randomized and treatments were performed in a randomized order. Test hydrolysates (WGH, LAH, SPH, or PPH) and intact wheat gluten (WG) were dissolved in deionized water and orally administered at a dose of 0.5–1.5 g/kg BW as indicated in each figure legend. During the experiments, water (6 or 12 mL/kg BW in experiments) was orally administered as a control treatment. The food consumption was measured at 1, 2, 3, 6, and 12 h after the administration of the oral solution.
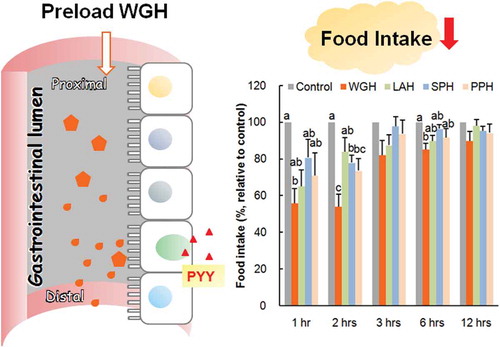
Figure 1. The effect of orogastric preload of various protein hydrolysates on food intake in re-fed rats.
The diet was given immediately after the oral administration of wheat gluten hydrolysate (WGH), lactalbumin enzymatic hydrolysate (LAH), soybean protein hydrolysate (SPH) or potato protein hydrolysate (PPH) at a dose of 1.0 g/kg BW. The administration of water (6 mL/kg BW) was the control. The accumulated food intake was measured at 1, 2, 3, 6, and 12 h after feeding. The food intake relative to the control (considered to be 100%) is presented. The results are expressed as the mean ± SEM (numbers of rats for water, WGH, LAH, SPH, and PPH treatments are 11, 8, 9, 11, and 10, respectively). The two-way repeated measure ANOVA P values are 0.0015, < 0.0001, < 0.0001 for treatment, time, and treatment × time, respectively. Bars not sharing the same letters differ significantly (P < 0.05 by Tukey-Kramer test) at the same time points.
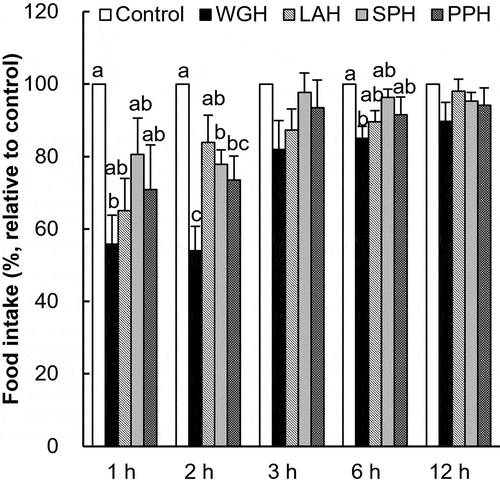
Figure 2. Comparison of satiety effect between WGH and LAH in re-fed rats.
The accumulated food intake was measured after the oral administration of 0.5–1.5 g/kg BW WGH (a) or LAH (b). The food intake relative to the control (considered to be 100%) is presented. The results are expressed as the mean ± SEM (numbers of rats for water, 0.5 g/kg WGH, 1.0 g/kg WGH, 1.5 g/kg WGH, 0.5 g/kg LAH, 1.0 g/kg LAH, 1.5 g/kg LAH treatments are 21, 19, 18, 19, 17, 20, and 20, respectively). The respective two-way repeated measure ANOVA P values for WGH (a) are < 0.0001, < 0.0001, 0.0422 for treatment, time, and treatment × time; the values for LAH (b) are < 0.0001, < 0.0001, 0.0015 for treatment, time, and treatment × time. (c) The accumulated food intake was measured after a single oral administration of 1.0 g/kg BW WGH or LAH (not cross-over design). The results are expressed as the mean ± SEM (numbers of rats for water, WGH, and LAH treatments are 8, 5, and 6, respectively). The two-way repeated measure ANOVA P values for accumulated food intake are < 0.0001, 0.0026, 0.0977 for treatment, time, and treatment × time, respectively. Bars not sharing the same letters differ significantly (P < 0.05 by Tukey-Kramer test) at the same time points.
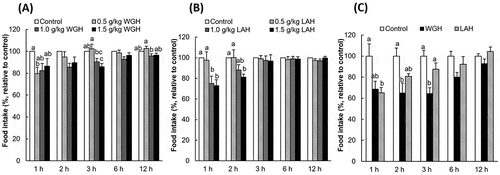
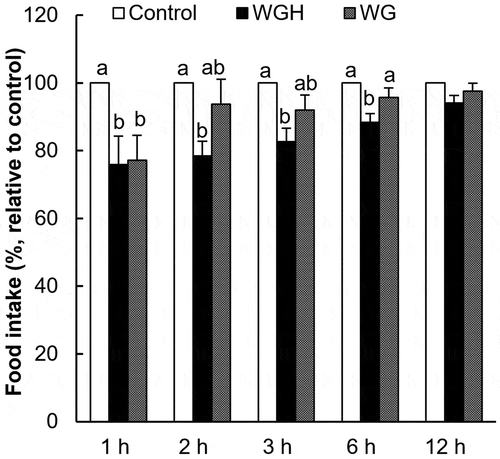
Figure 3. The effect of orogastric preload of WGH or intact wheat gluten on food intake in re-fed rats.
The accumulated food intake was measured after the oral administration of 1.0 g/kg BW WGH or WG (intact wheat gluten). The food intake relative to the control (considered to be 100%) is presented. The results are expressed as the mean ± SEM (numbers of rats for water, WGH, and WG treatments are 20, 19, and 18, respectively). The two-way repeated measure ANOVA P values are < 0.0001, 0.0019, 0.1344 for treatment, time, and treatment × time, respectively. Bars not sharing the same letters differ significantly (P < 0.05 by Tukey-Kramer test) at the same time points.
Measurement of plasma gut hormones
The rats were fasted for 12 h and were each orally gavaged with WGH, LAH (1.0 g/kg BW), or the control (6 mL/kg BW water) solution through the feeding tube. Afterwards, the rats were respectively allowed to feed for 1, 2, 3, or 6 h in experiments. After the designated refeeding time (1, 2, 3, or 6 h), portal blood samples (2 mL) were drawn into a syringe containing EDTA (final concentration at 1 mg/mL), aprotinin (final concentration at 0.6 TIU/mL) and DPP-IV inhibitor (final concentration at 50 μM, Millipore, Billerica, MA) under anesthesia with pentobarbital sodium (i.p. 50 mg/kg BW, Somnopentyl, Kyoritsu Seiyaku Corporation, Tokyo, Japan), and then euthanized by exsanguination. The plasma was separated from the whole blood and frozen at – 80°C until hormone (CCK, GLP-1, PYY) measurements. Hormone measurements were conducted using commercial ELISA kits. In the CCK-33 enzyme immunoassay (EIA) kit (Phoenix Pharmaceuticals Inc., Burlingame, CA), the primary antiserum cross-reacts 100% with CCK-33 and 2.36% with non-sulfated CCK (26–33), but does not cross-react with gastrin. The coefficients of the intra- and inter-assay variation are 5%-10% and < 15%, respectively. The antiserum contained in the active GLP-1 EIA kit (Millipore, Billerica, MA) cross-reacts 100% with both GLP-1 (7–36 amide) and GLP-1 (7–37), and the intra- and inter-assay variation are 6%-9% and < 13%, respectively. The PYY EIA kit (Yanaihara Institute Inc., Shizuoka, Japan) shows 100% cross-reactivity with PYY (3–36) and 115% with PYY (1–36). The coefficients of intra- and inter-assay variation are 3.1%-9.8% and 4.2%-14.2%, respectively.
The mimicking gastrointestinal digestion of WGH and LAH by pepsin and pancreatin
WGH or LAH was treated with pepsin (from porcine gastric mucosa, Sigma) and pancreatin (from porcine pancreas, Sigma) for various periods of time, using a slightly modified protocol [Citation25]. Briefly, WGH or LAH was dissolved in 0.02 N H3PO4 at a concentration of 50 g/L, and the pH was adjusted to 1.85 using 20 N H3PO4. Pepsin was added at 0.5% wt/substrate wt and incubated for 30 or 60 min with shaking at 37°C. The pH of the suspension was then adjusted to 8.2 using Ca(OH)2, and pancreatin was added at 4% wt/substrate wt. The suspension was incubated for 1 or 2 h at 37°C, followed by boiling for 20 min to inactivate the enzymes. The suspension was neutralized using 20 N H3PO4 and Ca(OH)2. Finally, the soluble fraction was centrifuged, filtered through a filter with 0.45 µm pores, and lyophilized.
Gut hormone secretion study in STC-1 and GLUTag cells
Two murine enteroendocrine cell lines, STC-1 cells (a gift from Dr. D. Hanahan, University of California, San Francisco, CA) [Citation23], and GLUTag cells (a gift from Dr. D. J. Drucker, University of Toronto, Toronto, Canada) [Citation9], were grown in a Dulbecco’s modified Eagle’s medium (Invitrogen, Carlsbad, CA) supplemented with 10% fetal bovine serum, 50 IU/mL penicillin, and 500 μg/mL streptomycin in a humidified 5% CO2 atmosphere at 37°C. The cells were routinely subcultured by trypsinization upon reaching 80%–90% confluency. The cells were grown in 48-well culture plates at a density of 1.25 × 10⁵ cells/well for 2–3 days until they reached 80%–90% confluency.
For the CCK secretion study, STC-1 cells were washed three times with HEPES buffer to remove the culture medium and exposed to 100 μL of the buffer containing test hydrolysates (5–10 mg/mL WGH or LAH) for 60 min at 37°C. The HEPES buffer (pH 7.4) was composed of 140 mM NaCl, 4.5 mM KCl, 20 mM HEPES, 1.2 mM CaCl2, 1.2 mM MgCl2, 10 mM D-glucose, and 0.1% BSA. After the incubation, the supernatants were collected from the 48-well culture plates and centrifuged at 800 × g for 5 min at 4°C to remove the dissociated cells. The supernatant sample was then frozen below −50°C until it was time for CCK concentration measurements, which were performed using the CCK EIA kit (Phoenix Pharmaceuticals Inc., Burlingame, CA). The primary antiserum cross-reacts 100% with the sulfated and non-sulfated CCK (26–33), CCK-33 (porcine), CCK (27–33), caerulein, gastrin-1 (human), and big gastrin-1 (human), and cross-reacts 12.8% with CCK (30–33). Although the primary antibody cross-reacts with gastrin, the EIA kit was used in the present study because gastrin is not expressed at a detectable level in STC-1 cells [Citation26]. The coefficients of intra- and inter-assay variation are 5%-10% and < 15%, respectively.
For the GLP-1 secretion study, GLUTag cells cultured in 48-well plates were exposed to 80 μL of the test solutions (5 or 10 mg/mL of WGH, LAH, or their hydrolysates dissolved in HEPES buffer), as described above. The GLP-1 concentrations of the collected supernatants were measured using the GLP-1 EIA kit (Yanaihara Institute Inc., Shizuoka, Japan). The primary antiserum cross-reacts 100% with both GLP-1 (7–36) amide and GLP-1 (9–36) amide, and the cross-reactivity for GLP-1 (1–36) amide, GLP-1 (1–37) and GLP-1 (7–37) are 0.3%, < 0.1%, and < 0.1%, respectively. The coefficients of intra- and inter-assay variation for the rat plasma are 5.36%-6.60% and 5.51%-18.87%, respectively.
Statistical analysis
The results are presented as the mean ± SEM. In cross-over studies (, , ) and ), results are expressed as % relative values to the food intake of individual rats under control treatment. Accordingly, there was no error bar in control treatment. Statistical significance was assessed by one-way ANOVA or two-way repeated measure ANOVA, as described in the figure legends. Significant differences among the mean values were determined using a Tukey-Kramer test. P < 0.05 was considered to be statistically significant.
Results
WGH had higher potency for the regulation of food intake in rats
The cumulative food intake was recorded at each respective time point (1, 2, 3, 6, and 12 h). Results are expressed as % relative values to the control treatment due to relatively large variances in absolute data. The accumulated food intake values after the control treatment were 2.24 ± 0.16 g at 1 h, 3.54 ± 0.23 g at 2 h, 5.04 ± 0.35 g at 3 h, 10.20 ± 0.47 g at 6 h, and 18.20 ± 0.52 g at 12 h. When the rats were gavaged with the test hydrolysates, they consumed relatively lower amounts of food compared with the control rats (). Food intake was notably reduced after an oral preload with WGH after 1 h of re-feeding. At 2 h, all hydrolysate except LAH treatments significantly suppressed food intake; WGH treatment showed the highest reduction in food intake. The total energy intake, including the energy from the preload and diet at 12 h, were 70.26 ± 2.00, 62.77 ± 2.88, 69.38 ± 2.34, 67.76 ± 1.79, and 67.54 ± 2.78 kcal after control, WGH, LAH, SPH, and PPH treatments respectively (P = 0.260, by one-way ANOVA). Because WGH had larger effect than other test hydrolysates, it was adopted for the subsequent studies with LAH as an iso-nitrogenous comparison.
The satiety effect of WGH, LAH, and intact wheat gluten in rats
The dose responses of WGH and LAH on satiety were examined with a cross over design test ( and ). The accumulated food intake values of the control treatment in cross-over experiment were 4.21 ± 0.24 g at 1 h, 4.81 ± 0.22 g at 2 h, 6.50 ± 0.29 g at 3 h, 10.31 ± 0.29 g at 6 h, and 19.20 ± 0.33 g at 12 h. The result of a two-way repeated measure ANOVA analysis showed a treatment effect by WGH and LAH (P < 0.0001). Similarly, an oral preload of WGH at doses of 1.0 and 1.5 g/kg tended to reduce subsequent food intake until 12 h (). The food intake after treatment with 0.5 g/kg WGH was significantly lower than the control treatment after 1 h, but the effect disappeared after 2 h. A preload of LAH at 1 g/kg tended to reduce food intake only after 1–2 h, whereas a 1.5 g/kg dose showed a relatively larger effect (). The total energy intake at 12 h was 74.12 ± 1.29, 76.05 ± 1.40, 71.65 ± 1.15, and 73.78 ± 1.35 kcal after preload of the control, 0.5 g/kg WGH, 1.0 g/kg WGH, and 1.5 g/kg WGH, respectively (P = 0.151 by one-way ANOVA). The total energy intake at 12 h after LAH preload was 73.49 ± 1.75, 72.67 ± 1.09, and 74.96 ± 1.21 kcal after 0.5 g/kg, 1.0 g/kg, and 1.5 g/kg doses, respectively (P = 0.654 by one-way ANOVA).
To confirm the consistency of the cross over study result, the rats received a single administration of WGH or LAH (not as a cross-over study) to isolate the effects of repeated administrations of these hydrolysates on food intake. The accumulated food intake values of the control group were 3.38 ± 0.39 g at 1 h, 4.81 ± 0.37 g at 2 h, 7.16 ± 0.39 g at 3 h, 11.43 ± 0.52 g at 6 h, and 20.34 ± 0.45 g at 12 h. The accumulated food intake following WGH treatment was significantly reduced for up to 3 h (). The food intake decreased significantly only at the first hour after the oral administration of LAH. The total energy intake at 12 h was 78.50 ± 1.75, 73.88 ± 3.44, and 82.93 ± 3.48 kcal after control, WGH, and LAH treatments, respectively (P = 0.130, by one-way ANOVA).
Because intact wheat gluten (WG) was insoluble in water, it was administered as a suspension in a volume of 12 mL/kg BW. The values of accumulated food intake were 1.86 ± 0.20 g at 1 h, 3.17 ± 0.18 g at 2 h, 5.28 ± 0.27 g at 3 h, 8.91 ± 0.32 g at 6 h, and 18.36 ± 0.50 g at 12 h following the control treatment. When compared to WG, WGH showed a greater satiety effect (). WGH suppressed the food intake from 1 h to 6 h after the treatment, whereas WG only suppressed the food intake during the first hour. The total energy intake at 12 h was 70.86 ± 1.93, 68.13 ± 1.45, 70.13 ± 1.43 kcal after the control, WGH, WG treatments, respectively (P = 0.475, by one-way ANOVA).
Gut hormone secretion during food intake with or without protein hydrolysates treatment
The rats treated with WGH and LAH tended to have higher postprandial CCK levels compared to the control treatment at 1 h after the feeding start (P = 0.040, by one-way ANOVA, ). The plasma CCK level at 6 h was significantly higher in the WGH-treated rats compared to the control rats. The portal PYY level was significantly higher in the WGH-treated rats compared to the control-treated rats at 2 h and 3 h. The plasma GLP-1 level in the WGH-treated rats tended to be higher compared to the control-treated rats at 1 h and 2 h (one-way ANOVA P values were 0.097 at 1 h and 0.083 at 2 h).
Table 1. The effect of orogastric preload of WGH or LAH on postprandial gut hormone levels in portal vein in rats (pM).
The potency of WGH and LAH on gut hormone secretion in enteroendocrine cell lines
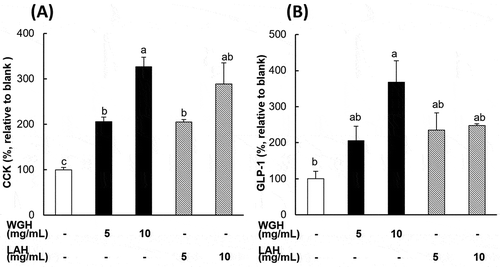
To examine the direct effect of WGH and LAH on intestinal enteroendocrine cells, STC-1 cells (as a proximal enteroendocrine cell model) and GLUTag cells (as a distal enteroendocrine cell model) were exposed to either WGH or LAH solution. As shown in , WGH and LAH (5 and 10 mg/mL) similarly induced a dose-dependent increase in CCK secretion from STC-1 cells. In the GLUTag cells, WGH induced a dose-dependent increase in the GLP-1 concentration in the supernatant. However, GLP-1 release was similar for cells exposed to 5 and 10 mg/mL of LAH and 5 mg/mL of WGH ().
Figure 4. CCK and GLP-1 secretion in response to WGH or LAH in enteroendocrine cells.
(a) The CCK levels were measured in the supernatants of STC-1 cells after exposure to the test hydrolysates (WGH or LAH) at 5–10 mg/mL for 1 h. (b) The GLP-1 levels were measured in the supernatants of GLUTag cells after exposure to the test hydrolysates (WGH or LAH) at 5–10 mg/mL for 1 h. The level relative to the blank (considered to be 100%) is presented. The results are expressed as the mean ± SEM of three to seven wells. Bars not sharing the same letters differ significantly (P < 0.05 by Tukey-Kramer test).
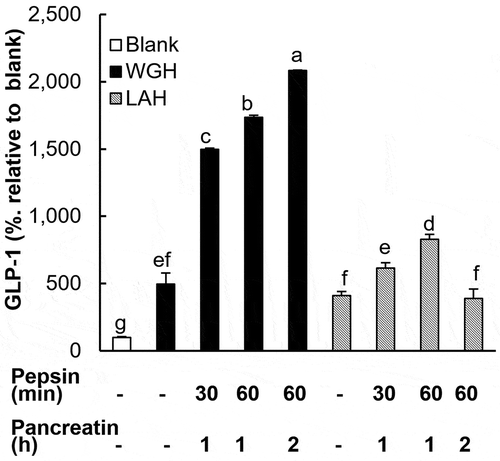
To examine the effect of gastrointestinal digestion on these protein hydrolysates-induced gut hormone secretion, WGH and LAH were treated with pepsin and pancreatin in vitro to mimic luminal digestion. Pepsin and pancreatin solution treated for 60 and 2 h without substrates had only minor effect on GLP-1 secretion (108.6% ± 5.7%). WGH treated with pepsin (30 or 60 min) and pancreatin (1 or 2 h) induced a much higher release of GLP-1 than untreated WGH. A longer treatment with the enzymes led to a higher secretion of GLP-1; the strongest conditions (pepsin for 60 min and pancreatin for 2 h) resulted in the highest level of GLP-1 secretion (). In the case of LAH, although the treatment with pepsin (30 or 60 min) and pancreatin (1 h) significantly enhanced its effect on GLP-1 secretion, the extent of enhancement was remarkably lower than that observed with WGH. Moreover, after further digestion of LAH by pancreatin for 2 h, the activity returned to the level observed for the untreated LAH.
Figure 5. The effects of in vitro digestion of WGH or LAH on GLP-1 secretion in GLUTag cells.
WGH or LAH was treated with pepsin and pancreatin for various time periods indicated below the X-axis. The GLUTag cells were exposed to the digested hydrolysates at 10 mg/mL for 1 h, and GLP-1 levels relative to the blank (considered to be 100%) are presented. The results are expressed as the mean ± SEM of three to four wells. Bars not sharing the same letters differ significantly (P < 0.05 by Tukey-Kramer test).
Discussion
In the present study, we found that WGH, among various protein hydrolysates, had a potent and prolonged effect on suppressing food consumption in rats. Prolonged suppression of food consumption was accompanied with higher postprandial PYY levels in rats treated with a WGH preload. In enteroendocrine cell models, WGH potently stimulated gut hormone secretions such as CCK and GLP-1, and in vitro digestion of WGH with pepsin/pancreatin further enhanced its potency. These results demonstrate that the dietary peptide WGH potently and specifically stimulates PYY secretion in rats. The results of the in vitro study suggest that WGH could directly stimulate distal enteroendocrine cells even after luminal digestion.
A variety of dietary proteins and their hydrolysates possess different potencies for inducing satiety [Citation17–Citation22]. The present results also indicated that a variety of protein hydrolysates differed in affecting satiety in rats, which is consistent with previous reports on the effect of protein source on food intake [Citation27–Citation29]. The oral preload of WGH showed a higher activity on suppressing food intake than the other protein hydrolysates (), and WGH was further studied for gut hormone secretions in comparison with LAH as an iso-nitrogenous comparison. Although statistical significance was not detected for total energy intake, the reduced energy intake (7.49 kcal) with a preload of WGH was apparently larger than the energy provided from the WGH preload (~ 1 kcal/head; 1 g/kg BW = 250 mg/250 g BW).
Hydrolysates used in the present study have various nitrogen contents and other components. Because suppressive effects on food intake did not correlate with nitrogen content of these hydrolysates, the differences in the effect would not simply be attributed to the concentration of protein/peptide. Unidentified components might partially be involved in the suppressive effects on food intake, however, results in enteroendocrine cell models suggest that peptides in WGH potently and directly stimulate gut hormone secretions.
The effect of WG on food intake suggests that an adequate hydrolysis is critical to prolong the appetite-suppressing effect of gluten peptides (). This suggestion is supported by the in vitro experiment where the pepsin/pancreatin digestion of WGH largely enhanced the potency of GLUTag cell activation (). The significance of hydrolysis on protein/peptide-induced gut hormone secretion and/or satiety is not consistent in previous studies. A preload of casein and its hydrolysate in rats had a similar effect on meal consumption [Citation30]. In the case of BSA [Citation31] and soybean beta-conglycinin [Citation7], peptic hydrolysis significantly enhanced the potency of CCK release in rats and rat intestinal mucosal cells, respectively. In contrast, a previous report demonstrated that intact proteins are potent to stimulate gut hormone secretion in vitro [Citation32]. Such differences may come from different experimental conditions, in addition to different protein sources and their digestibility. In the present study, the higher tendencies of CCK and GLP-1 levels at 1 h in the WGH- or LAH-preloaded rats () imply that the enhanced CCK/GLP-1 secretion by the administration of WGH or LAH contributes to suppress food intake. Furthermore, luminal digestion of wheat gluten hydrolysate might potentiate its appetite-suppressive effect through the stimulation to distal PYY-producing cells. It is well recognized that CCK-producing cells mainly locate in the proximal, and GLP-1/PYY-coproducing cells mainly locate in the distal gut. However, recent immunohistochemical studies [Citation12,Citation13] have revealed that GLP-1-producing cells also exist in the proximal region without coproducing PYY. The time-related and non-parallel responses of CCK/GLP-1/PYY release after WGH preloading seem congruent with such distribution of enteroendocrine cells. The increase of PYY levels in the WGH-treated group may explain why WGH demonstrated a longer effect on suppressing food intake than LAH. Lower tendency of GLP-1 levels at 2 h in the control and LAH groups compared to other time points seemed to reflect biphasic patterns of postprandial GLP-1 secretion [Citation33,Citation34] due to nutrient delivery in the intestinal lumen and direct/indirect stimulation on GLP-1-producing cells [Citation9,Citation35].
The suppressive effect of WGH and LAH on food intake seems to be associated with their direct stimulating effect on enteroendocrine cells. STC-1 cells and GLUTag cells produce not only CCK or GLP-1, but also multiple gut hormones [Citation36], as well as native enteroendocrine cells [Citation12,Citation13]. Although a previous study used STC-1 cells as PYY-producing cells [Citation37], we and other group [Citation36] have not detected PYY in both cell lines. STC-1 cells were derived from murine duodenum and GLUTag cells derived from murine colon. Thus, it may be no more appropriate to use these cell lines as a CCK-specific or a GLP-1-specific enteroendocrine cell model. When we consider STC-1 cells as a proximal and GLUTag cells as a distal enteroendicrince cell model, WGH appears to be more potent to stimulate distal enteroendocrine cells compared to LAH. This may partly explain the potent effect of WGH on PYY secretion in vivo.
In GLUTag cells, WGH induced GLP-1 secretion in a dose-dependent manner, while LAH caused similar and relatively weak GLP-1 secretion with different doses (). The average molecular size of LAH (~ 200 Da) is smaller than WGH (~ 600 Da), and FPLC analyses determined that LAH contains a large portion (~ 50%) of free amino acids; WGH contains only approximately 3% free amino acids. The higher potency of WGH to stimulate GLUTag cells to secret the hormone may be explained by the molecular size of the peptides. Although GLUTag cells are not recognized as PYY-producing cells, the result suggests that WGH directly activated distal enteroendocrine cells including GLP-1/PYY-coproducing cells with a higher potency than LAH. These results provide further data on the stimulation of PYY and GLP-1 secretion by peptones [Citation9–Citation15]. Furthermore, these findings suggest that the highly potent peptides or structures in WGH are liberated by luminal protease digestion after oral administration, which leads to the further release of PYY/GLP-1 secretion from the enteroendocrine L cells. A single active peptide that stimulates PYY/GLP-1 secretion has not been identified. Therefore, further studies are needed to identify the active peptides derived from WGH.
There are several limitations in the present study. Dose-dependent effects were not clearly observed after WGH administration (). It is possible that gastric emptying was immediately reduced by gut hormones secretions (CCK, GLP-1 etc.) induced by WGH partly flown in the intestine, so that further delivery of WGH into the intestinal lumen was limited to enhance gut hormone secretions. Although WGH repeatedly reduced food intake in the cross-over ( and ) and single administration study (), the degree of reduction was unstable as observed in . Specific reasons are unclear, but it is necessary to improve the experimental condition for future studies. Furthermore, it will be necessary to compare various WGH sources (not only reagent grade but also food grade) when considering applications in humans for preventing overeating. An unexpected finding was that the CCK concentration, but not the GLP-1 or PYY concentration was higher compared to the control group at 6 h after WGH administration (). This could be explained by the increased food intake after 3 h in WGH group ().
In summary, the orogastric preload of WGH suppressed food intake for a longer period of time than the other protein hydrolysates. WGH had a higher potency to elevate plasma PYY levels in vivo and to activate enteroendocrine models to release gut hormones in vitro. These results suggest WGH is potent in activating enteroendocrine cells to release satiety hormones leading to the prolonged suppression of food intake.
Author Contribution
WC, TH, SN, HH conceived and designed the experiments.
WC, TH, SN performed the experiments.
WC and TH cowrote the manuscript.
SN and HH reviewed and edited the manuscript.
All authors read and approved this manuscript.
Disclosure statement
No potential conflict of interest was reported by the authors.
References
- Parker HE, Gribble FM, Reimann F. The role of gut endocrine cells in control of metabolism and appetite. Exp Physiol. 2014;99:1116–1120.
- Feinle-Bisset C. Modulation of hunger and satiety: hormones and diet. Curr Opin Clin Nutr Metab Care. 2014;17:458–464.
- Camilleri M. Peripheral mechanisms in appetite regulation. Gastroenterology. 2015;148:1219–1233.
- Clemmensen C, Müller TD, Woods SC, et al Gut-brain cross-talk in metabolic control. Cell. 2017;168:758–774.
- Ueno H, Nakazato M. Mechanistic relationship between the vagal afferent pathway, central nervous system and peripheral organs in appetite regulation. J Diabetes Investig. 2016;7:812–818.
- Cordier-Bussat M, Bernard C, Haouche S, et al. Peptones stimulate cholecystokinin secretion and gene transcription in the intestinal cell line STC-1. Endocrinology. 1997;138:1137–1144.
- Nishi T, Hara H, Tomita F. Soybean beta-conglycinin peptone suppresses food intake and gastric emptying by increasing plasma cholecystokinin levels in rats. J Nutr. 2003;133:352–357.
- Sufian MK, Hira T, Miyashita K, et al. Pork peptone stimulates cholecystokinin secretion from enteroendocrine cells and suppresses appetite in rats. Biosci Biotechnol Biochem. 2006;70:1869–1874.
- Hira T, Mochida T, Miyashita K, et al. GLP-1 secretion is enhanced directly in the ileum but indirectly in the duodenum by a newly identified potent stimulator, zein hydrolysate, in rats. Am J Physiol Gastrointest Liver Physiol. 2009;297:G663–G671.
- Higuchi N, Hira T, Yamada N, et al. Oral administration of corn zein hydrolysate stimulates GLP-1 and GIP secretion and improves glucose tolerance in male normal rats and goto-kakizaki rats. Endocrinology. 2013;154:3089–3098.
- Ishikawa Y, Hira T, Inoue D, et al. Rice protein hydrolysates stimulate GLP-1 secretion, reduce GLP-1 degradation, and lower the glycemic response in rats. Food Funct. 2015;6:2525–2534.
- Svendsen B, Pedersen J, Albrechtsen NJ, et al. An analysis of cosecretion and coexpression of gut hormones from male rat proximal and distal small intestine. Endocrinology. 2015;156:847–857.
- Wewer Albrechtsen NJ, Kuhre RE, Toräng S, et al. The intestinal distribution pattern of appetite- and glucose regulatory peptides in mice, rats and pigs. BMC Res Notes. 2016;9:60.
- Steinert RE, Feinle-Bisset C, Asarian L, et al. Ghrelin, CCK, GLP-1, and PYY(3–36): secretory controls and physiological roles in eating and glycemia in health, obesity, and after RYGB. Physiol Rev. 2017;97:411–463.
- Spreckley E, Murphy KG. The L-cell in nutritional sensing and the regulation of appetite. Front Nutr. 2015;2:23.
- Zhang T, Brubaker PL, Thompson JC, et al. Characterization of peptide-YY release in response to intracolonic infusion of amino acids. Endocrinology. 1993;132:553–557.
- Lonnie M, Hooker E, Brunstrom JM, et al. Protein for life: review of optimal protein intake, sustainable dietary sources and the effect on appetite in ageing adults. Nutrients. 2018;10:E360.
- Carreiro AL, Dhillon J, Gordon S, et al. The macronutrients, appetite, and energy intake. Annu Rev Nutr. 2016;36:73–103.
- Dougkas A, Östman E. Protein-enriched liquid preloads varying in macronutrient content modulate appetite and appetite-regulating hormones in healthy adults. J Nutr. 2016;146:637–645.
- Diepvens K, Häberer D, Westerterp-Plantenga M. Different proteins and biopeptides differently affect satiety and anorexigenic/orexigenic hormones in healthy humans. Int J Obes. 2008;32:510–518.
- Giezenaar C, Trahair LG, Luscombe-Marsh ND, et al. Effects of randomized whey-protein loads on energy intake, appetite, gastric emptying, and plasma gut-hormone concentrations in older men and women. Am J Clin Nutr. 2017;106:865–877.
- Chungchunlam SMS, Henare SJ, Ganesh S, et al. Effects of whey protein and its two major protein components on satiety and food intake in normal-weight women. Physiol Behav. 2017;175:113–118.
- Nakajima S, Hira T, Hara H. Calcium-sensing receptor mediates dietary peptide-induced CCK secretion in enteroendocrine STC-1 cells. Mol Nutr Food Res. 2012;56:753–760.
- Reeves PG, Nielsen FH, Fahey GC Jr. AIN-93 purified diets for laboratory rodents: final report of the American institute of nutrition ad hoc writing committee on the reformulation of the AIN-76A rodent diet. J Nutr. 1993;123:1939–1951.
- Nakajima S, Hira T, Tsubata M, et al. Potato extract (potein) suppresses food intake in rats through inhibition of luminal trypsin activity and direct stimulation of cholecystokinin secretion from enteroendocrine cells. J Agric Food Chem. 2011;59:9491–9496.
- McLaughlin JT, Lomax RB, Hall L, et al. Fatty acids stimulate cholecystokinin secretion via an acyl chain length‐specific, Ca2+‐dependent mechanism in the enteroendocrine cell line STC‐1. J Physiol. 1998;513:11–18.
- Moura CS, Lollo PCB, Morato PN, et al. Bioactivity of food peptides: biological response of rats to bovine milk whey peptides following acute exercise. Food Nutr Res. 2017;61:1290740.
- Anderson GH, Tecimer SN, Shah D, et al. Protein source, quantity, and time of consumption determine the effect of proteins on short-term food intake in young men. J Nutr. 2004;134:3011–3015.
- Pal S, Radavelli-Bagatini S, Hagger M, et al. Comparative effects of whey and casein proteins on satiety in overweight and obese individuals: a randomized controlled trial. Eur J Clin Nutr. 2014;68:980–986.
- Burton-Freeman B, Gietzen DW, Schneeman BO. Meal pattern analysis to investigate the satiating potential of fat, carbohydrate, and protein in rats. Am J Physiol. 1997;273:R1916–R1922.
- Guan D, Green GM. Significance of peptic digestion in rat pancreatic secretory response to dietary protein. Am J Physiol. 1996;271:G42–G47.
- Geraedts MC, Troost FJ, Fischer MA, et al. Direct induction of CCK and GLP-1 release from murine endocrine cells by intact dietary proteins. Mol Nutr Food Res. 2011;55:476–484.
- Rask E, Olsson T, Söderberg S, et al. Impaired incretin response after a mixed meal is associated with insulin resistance in nondiabetic men. Diabetes Care. 2001;24:1640–1645.
- O’Connor KL, Scisco JL, Smith TJ, et al. Altered appetite-mediating hormone concentrations precede compensatory overeating after severe, short-term energy deprivation in healthy adults. J Nutr. 2016;146:209–217.
- Brubaker PL, Anini Y. Direct and indirect mechanisms regulating secretion of glucagon-like peptide-1 and glucagon-like peptide-2. Can J Physiol Pharmacol. 2003;81:1005–1012.
- Kuhre RE, Wewer Albrechtsen NJ, Deacon CF, et al. Peptide production and secretion in GLUTag, NCI-H716, and STC-1 cells: a comparison to native L-cells. J Mol Endocrinol. 2016;56:201–211.
- Hand KV, Bruen CM, O’Halloran F, et al. Examining acute and chronic effects of short- and long-chain fatty acids on peptide YY (PYY) gene expression, cellular storage and secretion in STC-1 cells. Eur J Nutr. 2013;52:1303–1313.