
ABSTRACT
We wished to search for the compounds contributing to the anti-inflammatory effects of the water extract of Curcuma longa (WEC). WEC was fractioned and the fractions were evaluated with regard to their inhibitory effect on the production of nitric oxide (NO) from the macrophage cell line stimulated by lipopolysaccharide. Compounds in the active fractions were isolated and identified. One isolated compound was identified as new: (6S)-2-methyl-5-hydroxy-6-(3-hydroxy-4-methylphenyl)-2-heptene-4-one (1). Four isolated compounds were identified as known: (6S)-2-methyl-6-(4-hydroxyphenyl)-2-heptene-4-one (4), bisabolone-4-one (5), curcumenone (6), and turmeronol A (8). Three isolated compounds were not identified their stereostructures but their planar structures: 2-methyl-6-(4-hydroxymethyl-phenyl)-2-heptene-4-one (2), 2-methyl-6-(2,3-epoxy-4-methyl-4-cyclohexene)-2-heptene (3), and 4-methylene-5-hydroxybisabola-2,10-diene-9-one (7). Compounds 1, 4, 7 and 8 inhibited production of prostaglandin E2 and NO. Others inhibited NO production only. These results (at least in part) show the active compounds contributing to the anti-inflammatory effects of WEC, and may be useful for elucidating its various beneficial physiologic effects.
Graphical Abstract
Isolated compounds from the water extract of Curcuma longa and their effect on the PGE2 production in a macrophage cell line stimulated by LPS.
Curcuma longa (C. longa) is a rhizomatous herbaceous perennial plant belonging to the ginger family. C. longa is cultured in tropical or subtropical regions worldwide. The deep yellow-orange powder known as “turmeric” is produced by boiling and drying the rhizomes of C. longa. Turmeric is used as a spice and also for drugs, especially in Asia [Citation1].
The water extract of the rhizomes of C. longa (WEC) has been reported to have hepatoprotective [Citation2], anti-depression [Citation3], cardioprotective [Citation4], and anti-stress [Citation5] effects in animal models. The anti-inflammatory effects of WEC have also been reported, such as prevention of endotoxin-induced uveitis [Citation6], prevention of ethanol-induced production of pro-inflammatory cytokines in the liver [Citation7], as well as tumor necrosis factor (TNF)-α-induced expression of adhesion-molecule proteins and monocyte adhesion in human endothelial cells [Citation8].
One of the most important compounds in turmeric is curcumin, and numerous reports of its anti-inflammatory effects have been published [Citation9]. Nevertheless, several types of compounds other than curcumin (curcumin-free turmeric) have also been reported to have anti-inflammatory effects [Citation10]. For example, sesquiterpenoids such as ar-turmerone and curdione inhibit lipopolysaccharide (LPS)-induced macrophage inflammation [Citation11,Citation12] and bisacurone has inhibitory effects on TNF-α-induced expression of adhesion molecules in vascular endothelial cells [Citation13].
It has been reported that turmeric contains ≥235 types of phenolic compounds and terpenoid compounds [Citation14]. However, the physiologic effects of most of these compounds, including anti-inflammatory effects, have not been evaluated. Clarification of their effects may help to elucidate the mechanism of action of extracts of C. longa, and aid the search for pharmaceutical lead compounds with strong activity.
We wished to search for the compounds that contribute to the anti-inflammatory effects of WEC. Initially, WEC was fractionated. Then, the fractions were evaluated with regard to their inhibitory effect on the production of nitric oxide (NO) from the macrophage cell line RAW 264.7 stimulated by LPS. Finally, the compounds in the active fractions were isolated and identified.
Materials and methods
Fractionation
WEC, an ingredient of commercial processed food, was provided by Takasago International (Tokyo, Japan). WEC was prepared from C. longa. The crushed rhizomes of C. longa were incubated with hot water. The supernatant was concentrated, mixed with dextrin, and spray-dried into the powder of WEC.
The fractionation scheme of WEC is shown in . After extraction of 2 kg of WEC with 20 L of 90% methanol for 2 h at room temperature, the residue was extracted again with 5 L of 90% methanol. Both extracts were combined, filtered, and rotary-evaporated until methanol was evaporated completely but water remained.
Figure 1. Fractionation scheme for WEC.
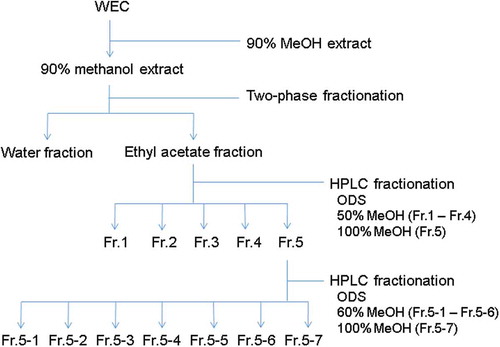
The water concentrate (1.2 L) was partitioned with ethyl acetate (0.5 L), and this process was repeated four times. The ethyl acetate-soluble fractions were combined and rotary-evaporated. Then, 56.44 g of the ethyl acetate-soluble fraction was obtained in the form of a viscous oil.
The ethyl-acetate fraction was fractionated by preparative high-performance liquid chromatography (HPLC). The column used was ODS-A-HG (100 × 240 mm; 5 μm; YMC, Kyoto, Japan). The mobile phase at Fr. 1–4 was methanol/water (50:50, v/v) and the mobile phase at Fr. 5 was methanol. Each eluate was rotary-evaporated and then freeze-dried. The viscous solids Fr. 1–5 (Fr. 1: 11.00 g; Fr. 2: 6.78 g; Fr. 3: 6.82 g; Fr. 4: 4.96 g; Fr. 5: 14.74 g) were obtained.
Then, 7.0 g of Fr. 5 was fractionated by preparative HPLC again. The column used was ODS-A-HG (100 × 225 mm; 10 μm). The mobile phase at Fr. 5–1 to Fr. 5–6 was methanol/water (60:40, v/v) and the mobile phase at Fr. 5–7 was methanol. Each eluate was rotary-evaporated and then freeze-dried. The viscous solids Fr. 5–1 to Fr. 5–7 (Fr. 5–1: 0.776 g; Fr. 5–2: 0.326 g; Fr. 5–3: 0.434 g; Fr. 5–4: 0.688 g; Fr. 5–5: 0.525 g; Fr. 5–6: 1.042 g; Fr. 5–7: 2.136 g) were obtained.
Isolation and identification
The Fr. 5 and Fr. 5–1 to Fr. 5–7 were analyzed by HPLC coupled to Fourier transform ion cyclotron resonance–mass spectrometry (LC/FT-ICR-MS). An Ultimate 3000 HPLC system (Thermo Fisher Scientific) with a Unison UK-C18 column (5 × 250 mm; 3 μm; Imtakt Co. Kyoto, Japan) and FT-ICR-MS Velos Pro (Thermo Fisher Scientific) were used. LC/FT-ICR-MS conditions were as described below. Water (LC-MS grade; solvent A) with 0.1% of formic acid and acetonitrile (LC-MS grade; solvent B) was used as the mobile phase. The gradient program was as follows: 15–65% B over 25 min; 65–95% B over 30 min; 95% B for 10 min; 95–15% B over 0.1 min; 15% B for 14 min. The flow rate was set to 0.5 mL/min and column oven temperature was set at 30°C. A photodiode array detector was used in the range 200–650 nm. The ESI setting was as follows: spray voltage 3.5 kV and capillary temperature 300°C for positive mode.
The main compounds were isolated from the fractions (Fr. 5–2 to Fr. 5–6) by the method described below. Their chemical structure analyzed by nuclear magnetic resonance (NMR) spectroscopy using an ECA-500 system (JEOL, Tokyo, Japan) and high sensitive polarimater SEPA-200 (HORIBA, Kyoto, Japan).
First, 50 mg of Fr. 5–2 was subjected to recycling preparative HPLC (LC9110; Japan Analytical Industry, Tokyo, Japan). An Inertsil column (ODS-3; 20 × 250 mm; 5 μm; GL Sciences, Tokyo, Japan) was used. The mobile phase was 80% methanol, the flow rate was 5 mL/min, and detection was at 240 nm. After the eighth round, the peak having the highest signal intensity was collected and subjected to preparative thin-layer chromatography (TLC; PLC Silicagel 60 F254; 1 mm; Merck, Whitehouse Station, NJ, USA) with hexane:ethyl acetate (2:1, v/v). Three major spots having UV absorption (Rf = 6.5 for Fr. 5–2-a; Rf = 5.8 for Fr. 5–2-b; Rf = 4.8 for Fr. 5–2-c) were collected. The yields were: 4.7 mg for Fr. 5–2-a; 4.6 mg for Fr. 5–2-b; 10.7 mg for Fr.5–2-c.
Then, 12.2 mg of Fr. 5–3 was subjected to recycling preparative HPLC in the same manner as for Fr. 5–2. After the tenth round, the peak having the largest signal intensity (Fr. 5–3-a) and the peak eluting just before the largest peak (Fr. 5–3-b) were collected. The yields were: 8.0 mg for Fr.5–3-a; 1.2 mg for Fr.5–3-b.
Subsequently, 132.5 mg of Fr. 5–4 was subjected to recycling preparative HPLC in the same manner as for Fr. 5–2 but instead the mobile phase was 65% methanol. The peak at a retention time of 55–62 min in the first round was collected. The yield was 27.6 mg.
Then, 92.8 mg of Fr. 5–5 was subjected to preparative TLC (PLC Silicagel 60 F254; 1 mm; Merck) with chloroform:methanol (96:4, v/v). The main spot having UV absorption (Rf: 0.57) was collected. The yield was 29.6 mg.
Subsequently, 200.0 mg of Fr. 5–6 was subjected to preparative TLC in the same manner as for Fr. 5–5. The spot having very thin UV absorption (Rf: 0.52) was collected and subjected to recycling preparative HPLC in the same manner as for Fr. 5–4. The peak at a retention time of 92–102 min in the first round was collected. The yield was 6.8 mg.
Evaluation of production of PGE2 and NO
The mouse macrophage cell line RAW 264.7 was obtained from RIKEN BioResource Center (Tokyo, Japan). Cells were seeded in 96-well plates at 1.5 × 10⁵ cells/well and incubated in Dulbecco’s modified Eagle’s medium (DMEM) containing 10% fetal bovine serum (FBS) for 24 h in an atmosphere of 5% CO2 at 37°C After incubation, the medium was exchanged with DMEM (FBS-free) containing each sample and pretreated for 1 h. Then, LPS (Escherichia coli O127:B8; L3129; Sigma–Aldrich, Saint Louis, MO, USA) was added at a final concentration of 20 ng/mL and left for 12 h.
After treatment, the prostaglandin (PG)E2 level in the medium was measured by a competitive enzyme-linked immunosorbent assay using a Parameter™ Prostaglandin-E2 kit (SKGE004B) according to manufacturer (R&D Systems, Minneapolis, MN, USA) instructions. The concentration of nitrite (a NO metabolite used to indicate cellular NO production) in the medium was measured by the Griess method.
Data are expressed as mean values ± SD of triplicates. Data from all groups were analyzed by one-way ANOVA. The Dunnett’s test was used as a post hoc test. Significance level was set at P < 0.05.
Results
Evaluation of WEC and its rough fractions
WEC, the 90% methanol extract, ethyl-acetate fraction, and water fraction were evaluated for their inhibitory effect on the production of NO ().
Figure 2. Effect of WEC and its rough fractions on the production of NO in the macrophage cell line RAW264.7 stimulated by LPS.
Cells were seeded in 96-well plate at 1.5 x 10⁵ cells/well and incubated in DMEM (10% FBS) for 24 hours. Then, the medium was exchanged with DMEM (FBS free) containing each sample and pretreated for 1 hour. Then, LPS was added in a final concentration of 20 ng/mL and treated for 12 hours. After treatment, nitrite in the medium was measured as described in Methods. Data shown are mean values ±SD of triplicates. Significance compared to control (+), * P < 0.05, **P < 0.01 (Dunnett’s test).
WEC inhibited the production of NO stimulated by LPS in a dose-dependent manner at 75–600 μg/mL. The 90% methanol extract of WEC showed dose-dependent activity at 12.5–100 μg/mL, suggesting that almost all of the active compounds were extracted in 90% methanol. In addition, the ethyl-acetate fraction showed dose-dependent activity at 6.25–50 μg/mL, whereas the water fraction was not active, suggesting that almost all of the active compounds were contained in the ethyl-acetate fraction.
Evaluation of HPLC fractions
sFirst, Fr. 1 to Fr. 5 fractionated by HPLC from the ethyl-acetate fraction were evaluated for their inhibitory effect on the production of NO (). Dose-dependent activity was observed in all fractions. The activity of Fr. 5 was the highest of all, and higher than that of the ethyl-acetate fraction. Furthermore, because the yield of Fr. 5 was the highest of all, it was judged that most of the active compounds were contained in Fr. 5, so it was fractionated by HPLC again. Then, Fr. 5–1 to Fr. 5–7 were evaluated for their inhibitory effect on the production of NO (). Dose-dependent activity was observed in all fractions, suggesting that many types of active compounds were interspersed in Fr. 5.
Figure 3. Effect of HPLC fractions of WEC (Fr. 1 to Fr. 5) on the production of NO in the macrophage cell line RAW264.7 stimulated by LPS.
Cells were seeded in 96-well plate at 1.5 x 10⁵ cells/well and incubated in DMEM (10% FBS) for 24 hours. Then, the medium was exchanged with DMEM (FBS free) containing each sample and pretreated for 1 hour. Then, LPS was added in a final concentration of 20 ng/mL and treated for 12 hours. After treatment, nitrite in the medium was measured as described in Methods. Data shown are mean values ±SD of triplicates. Significance compared to control (+), * P < 0.05, **P < 0.01 (Dunnett’s test).
Figure 4. Effect of HPLC fractions of WEC (Fr. 5–1 to Fr. 5–7) on the production of NO in the macrophage cell line RAW264.7 stimulated by LPS. Cells were seeded in 96-well plate at 1.5 x 10⁵ cells/well and incubated in DMEM (10% FBS) for 24 hours.
Then, the medium was exchanged with DMEM (FBS free) containing each sample and pretreated for 1 hour. Then, LPS was added in a final concentration of 20 ng/mL and treated for 12 hours. After treatment, nitrite in the medium was measured as described in Methods. Data shown are mean values ±SD of triplicates. Significance compared to control (+), * P < 0.05, **P < 0.01 (Dunnett’s test).
Isolation and identification
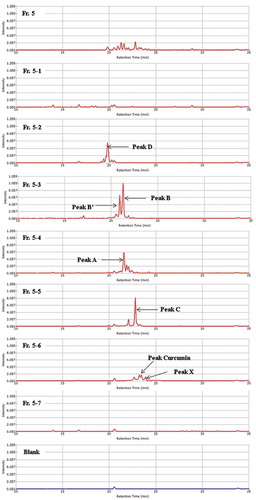
First, Fr. 5 and Fr. 5–1 to Fr. 5–7 were analyzed by mass spectrometry (). Using the procedures detailed in the Materials and methods section, three compounds, Fr. 5–2-a, Fr. 5–2-b and Fr. 5–2-c, were isolated from peak D observed in Fr. 5–2.
Figure 5. Mass spectra of the HPLC fractions of WEC (Fr. 5, Fr. 5–1 to Fr. 5–7). One scale on the vertical axis shows 2.0E7 of the mass intensity.
The analytical data of Fr. 5–2-a is shown below. It was identified as the known compound (6S)-2-methyl-6-(4-hydroxyphenyl)-2-heptene-4-one [Citation15] (compound 4 in ). Specific rotation [α] + 40.4 (CH3OH). 1H NMR (500 MHz, CD3OD) δ ppm 1.20 (d, J = 7.45 Hz, 3 H) 1.86 (d, J = 1.15 Hz, 3 H) 2.04 (d, J = 1.15 Hz, 3 H) 2.57–2.72 (m, 2 H) 3.12–3.22 (m, 1 H) 6.12 (t, J = 1.15 Hz, 1 H) 6.65–6.72 (m, 2 H) 7.02 (d, J = 8.59 Hz, 2 H). 13C NMR (126 MHz, CD3OD) δ ppm 20.95, 22.88, 27.75, 36.93, 53.95, 116.26, 125.35, 128.88, 138.65, 156.83, 157.14, 203.02. FT-ICR-MS calculated for C14H19O2, 219.1380 [M + H]+; found, 219.1374.
The analytical data of Fr. 5–2-b is shown below. Since it exhibited positive value of the specific rotation, its stereostructure was supposed to be the same as that of turmeronol A [Citation16]. It was identified as a new compound: (6S)-2-methyl-5-hydroxy-6-(3-hydroxy-4-methylphenyl)-2-heptene-4-one (compound 1 in ). Specific rotation [α] + 32.0 (CH3OH). 1H NMR (500 MHz, CD3OD) δ ppm 1.17 (d, J = 6.30 Hz, 3 H) 1.85–1.90 (m, 3 H) 2.07–2.11 (m, 3 H) 2.11–2.17 (m, 3 H) 2.92–3.00 (m, 1 H) 4.12 (d, J = 5.73 Hz, 1 H) 6.16 (dt, J = 2.72, 1.22 Hz, 1 H) 6.65 (dd, J = 7.45, 1.72 Hz, 1 H) 6.68 (d, J = 1.72 Hz, 1 H) 6.95 (d, J = 7.45 Hz, 1 H). The spectrum is shown in Figure S1. 13C NMR (126 MHz, CD3OD) δ ppm 15.95, 15.99, 21.27, 27.97, 44.35, 82.75, 115.38, 120.14, 122.01, 123.75, 131.62, 143.61, 156.44, 159.08, 203.23. The spectrum is shown in Figure S2. The correlation signals obtained by correlation spectroscopy (COSY, Figure S3) and heteronuclear multiple bond correlation (HMBC, Figure S4) are shown in . FT-ICR-MS calculated for C15H21O3, 249.1485 [M + H]+; found, 249.1478. The spectrum is shown in Figure S13.
Figure 6. The correlation signals obtained by COSY and HMBC for compounds 1 to 3.
The analytical data of Fr. 5–2-c is shown below. Its planar structure was decided as a new compound but its stereostructure was not identified: 2-methyl-6-(4-hydroxymethyl-phenyl)-2-heptene-4-one (compound 2 in ). Specific rotation [α] + 38.9 (CH3OH). 1H NMR (500 MHz, CD3OD) δ ppm 1.23 (d, J = 6.87 Hz, 3 H) 1.87 (d, J = 1.15 Hz, 3 H) 2.04 (d, J = 1.15 Hz, 3 H) 2.62–2.77 (m, 2 H) 3.22–3.30 (m, 1 H) 4.55 (s, 2 H) 6.10–6.18 (m, 1 H) 7.20 (d, J = 8.02 Hz, 2 H) 7.26 (d, J = 8.02 Hz, 2 H). The spectrum is shown in Figure S5. 13C NMR (126 MHz, CD3OD) δ ppm 20.97, 22.77, 27.78, 37.26, 53.53, 65.20, 125.25, 128.05, 128.42, 140.68, 146.97, 157.30, 202.50. The spectrum is shown in Figure S6. The correlation signals obtained by COSY (Figure S7) and HMBC (Figure S8) are shown in . FT-ICR-MS calculated for C15H21O2, 233.1536 [M + H]+; found, 233.1534. The spectrum is shown in Figure S13.
Figure 7. Chemical structures of the compounds isolated from WEC.
The analytical data of Fr. 5–3-a, isolated from peak B observed in Fr. 5–3, is shown below. It was identified as the known compound bisabolone-4-one [Citation15,Citation17] (compound 5 in ). Specific rotation [α] – 19.6 (CH3OH). 1H NMR (500 MHz, CD3OD) δ ppm 0.82 (d, J = 6.87 Hz, 3 H) 1.75 – 1.85 (m, 1 H) 1.91 (s, 3 H) 1.94–1.98 (m, 3 H) 1.98–2.03 (m, 1 H) 2.12 (s, 3 H) 2.19 (dt, J = 12.03, 4.58 Hz, 1 H) 2.31–2.51 (m, 4 H) 2.69–2.91 (m, 1 H) 5.81 (d, J = 1.15 Hz, 1 H) 6.19 (d, J = 1.15 Hz, 1 H). 13C NMR (126 MHz, CD3OD) δ ppm 16.65, 21.01, 24.26, 24.32, 27.83, 29.03, 31.72, 50.00, 50.97, 125.04, 127.29, 157.46, 165.57, 202.92, 203.33. FT-ICR-MS calculated for C15H23O2, 235.1693 [M + H]+; found, 235.1680.
The analytical data of Fr. 5–3-b, isolated from peak B′ observed in Fr. 5–3, is shown below. It was identified as the known compound curcumenone [Citation18] (compound 6 in ). Specific rotation [α] – 10.0 (CH3OH). 1H NMR (500 MHz, CD3OD) δ ppm 0.45 (qt, J = 4.58, 2.29 Hz, 1 H) 0.73 (q, J = 3.82 Hz, 1 H) 1.14 (s, 3 H) 1.52–1.68 (m, 2 H) 1.83 (s, 3 H) 2.07 (s, 3 H) 2.13 (s, 3 H) 2.52 (dd, J = 65.30, 16.04 Hz, 2 H) 2.53 (t, J = 7.45 Hz, 2 H) 2.85 (br. s., 2 H). 13C NMR (126 MHz, CD3OD) δ ppm 19.32, 21.23, 23.69, 23.84, 24.54, 25.59, 28.84, 30.06, 44.55, 49.88, 129.56, 149.67, 204.20, 211.96. FT-ICR-MS calculated for C15H23O2, 235.1693 [M + H]+; found, 235.1684.
The analytical data of Fr. 5–4, isolated from peak A observed in Fr. 5–4, is shown below. Its planar structure was same as the known compound [Citation19,Citation20] but its stereostructure was not identified: 4-methylene-5-hydroxybisabola-2,10-diene-9-one (compound 7 in ). Specific rotation [α] – 8.4 (CH3OH). 1H NMR (500 MHz, CD3OD) δ ppm 0.89 (d, J = 6.87 Hz, 3 H) 1.50–1.57 (m, 1 H) 1.79–1.86 (m, 1 H) 1.91 (d, J = 1.15 Hz, 3 H) 2.12 (d, J = 1.15 Hz, 3 H) 2.14 – 2.22 (m, 1 H) 2.25–2.55 (m, 2 H) 2.45 (br. s., 1 H) 4.36 (dd, J = 5.16, 2.86 Hz, 1 H) 4.99 (d, J = 54.99 Hz, 2 H) 5.73 (d, J = 10.31 Hz, 1 H) 6.15 (dd, J = 10.02, 2.58 Hz, 1 H) 6.18–6.21 (m, 1 H). 13C NMR (126 MHz, CD3OD) δ ppm 17.15, 21.04, 27.83, 33.35, 34.57, 37.61, 49.81, 69.75, 113.86, 125.18, 128.89, 134.23, 146.41, 157.39, 203.38. FT-ICR-MS calculated for C15H21O, 217.1587 [M + H – H2O]+; found, 217.1577.
The analytical data of Fr. 5–5, isolated from peak C observed in Fr. 5–5, is shown below. It was identified as the known compound turmeronol A [Citation16] (compound 8 in ). Specific rotation [α] + 40.4 (CH3OH). 1H NMR (500 MHz, CDCl3) δ ppm 1.23 (d, J = 6.87 Hz, 3 H) 1.87 (d, J = 1.15 Hz, 3 H) 2.12 (d, J = 1.15 Hz, 3 H) 2.21 (s, 3 H) 2.55–2.76 (m, 2 H) 3.20–3.30 (m, 1 H) 6.04 (dt, J = 2.43, 1.36 Hz, 1 H) 6.67 (d, J = 1.72 Hz, 1 H) 6.70 (dd, J = 7.45, 1.72 Hz, 1 H) 7.03 (d, J = 7.45 Hz, 1 H). 13C NMR (126 MHz, CDCl3) δ ppm 15.37, 20.77, 21.92, 27.68, 35.31, 52.56, 113.49, 118.74, 121.46, 124.02, 130.90, 145.92, 153.88, 155.63, 200.21. FT-ICR-MS calculated for C15H21O2, 233.1536 [M + H]+; found, 233.1528.
The analytical data of Fr. 5–6, isolated from the peak X observed in Fr. 5–6, is shown below. Its planar structure was decided as a new compound but its stereostructure was not identified: 2-methyl-6-(2,3-epoxy-4-methyl-4-cyclohexene)-2-heptene (compound 3 in ). Specific rotation [α] – 17.2 (CH3OH). 1H NMR (500 MHz, CDCl3) δ ppm 0.83 (d, J = 6.87 Hz, 3 H) 1.30–1.36 (m, 2 H) 1.41–1.49 (m, 1 H) 1.61 (s, 3 H) 1.62–1.66 (m, 1 H) 1.69 (d, J = 1.15 Hz, 3 H) 1.73 (dt, J = 13.89, 2.51 Hz, 1 H) 1.81 (t, J = 1.72 Hz, 3 H) 1.95–2.01 (m, 1 H) 2.01–2.07 (m, 2 H) 3.95 (s, 1 H) 3.96–3.99 (m, 1 H) 5.10 – 5.16 (m, 1 H) 5.53–5.56 (m, 1 H). The spectrum is shown in Figure S9. 13C NMR (126 MHz, CDCl3) δ ppm 14.38, 17.69, 20.46, 25.70, 26.04, 29.74, 30.47, 35.19, 40.55, 67.93, 69.14, 124.62, 129.93, 131.37, 136.70. The spectrum is shown in Figure S10. The correlation signals obtained by COSY (Figure S11) and HMBC (Figure S12) are shown in . FT-ICR-MS calculated for C15H23, 203.1794 [M + H – H2O]+; found, 203.1790; calculated for C15H25O, 221.1900 [M + H]+; found, 221.1894. The spectrum is shown in Figure S13.
The peak observed in Fr. 5–6 was presumed to be curcumin upon comparison with the compound purchased from Wako Pure Chemical Industries (Osaka, Japan).
Evaluation of isolated compounds
The isolated compounds were evaluated for their inhibitory effect on the production of PGE2 and NO (). Dose-dependent inhibitory activity against PGE2 and NO was observed for compounds 1, 4, 7, and 8. Dose-dependent inhibitory activity against NO was observed for compounds 2, 3, 5, and 6.
Figure 8. Effect of the compounds isolated from WEC on the production of (a) PGE2 and (b) NO in the macrophage cell line RAW264.7 stimulated by LPS.
Cells were seeded in 96-well plate at 1.5 x 10⁵ cells/well and incubated in DMEM (10% FBS) for 24 hours. Then, the medium was exchanged with DMEM (FBS free) containing each sample and pretreated for 1 hour. Then, LPS was added in a final concentration of 20 ng/mL and treated for 12 hours. After treatment, PGE2 and nitrite in the medium was measured as described in Methods. Data shown are mean values ±SD of triplicates. Significance compared to control (+), * P < 0.05, **P < 0.01 (Dunnett’s test).
Discussion
WEC was fractionated and the fractions were evaluated with regard to their inhibitory effect on the production of and NO from RAW 264.7 cells stimulated by LPS. One new (1) and four known (4, 5, 6, and 8) compounds shown in were isolated and identified from the active fractions. Compounds 1, 4, 7, and 8 inhibited the production of PGE2 and NO. Others inhibited NO production only.
Compound 1 was identified as new, but one of the essential structural analysis such as UV and IR spectrum about compound 1 were not conducted in this study and should be done in the future study. Compounds 2 and 3 were supposed to be new compound when judging from their planar structure, but their stereostructures were not identified in this study and should be done in the future study.
All of the obtained compounds except for compound 6 were bisabolane-type sesquiterpenoids. Compounds 1, 4, 7 and 8, which showed inhibition of PGE2 production, had structures in which hydroxyl groups were bonded directly to the benzene ring. Turmeronol B, a bisabolane-type sesquiterpenoid in which one hydroxyl group is bonded to the benzene ring, was purchased from Nagara Science (Gifu, Japan). It showed considerable inhibition of PGE2 production, with a half-maximal inhibitory concentration (IC50) of <1.6 μg/mL (data not shown). The activity of bisacurone containing two hydroxyl groups and ar-turmerone containing no hydroxyl group was weaker (IC50 > 25 and 21.7 μg/mL, respectively) than compounds in which one hydroxyl group was bonded to the benzene ring (data not shown).
These results suggested that the activity of a compound in which one hydroxyl group was bonded to the benzene ring was relatively high among bisabolane-type sesquiterpenoids. The position of the hydroxyl group is not defined specifically, so the polarity defined by one hydroxyl group is thought to be important for defining its activity. Inhibition of NO production was observed in compounds 2, 3, 5 and 6, but did not show a distinct correlation with the structure among bisabolane-type sesquiterpenoids.
Inflammatory stimuli such as LPS induce cyclooxygenase-2 (COX-2) which catalyzes the committed step in PG formation and inducible nitric oxide synthase (iNOS) gene expression through intracellular signaling pathways such as nuclear factor-kappa B (NF-κB) and activator protein (AP)-1 [Citation21,Citation22]. Because compounds 1, 4, 7 and 8 inhibited the production of PGE2 and NO although to different extents, they may have inhibited the production of PGE2 and NO by suppressing pathways such as NF-κB and AP-1. For compounds 2, 3, 5, and 6, only inhibition of NO production was observed. Compounds 2, 3, 5, and 6 may have affected the intracellular signaling pathways that regulate iNOS expression specifically. For example, the janus kinase/signal transducers and activators of transcription pathway is involved in the induction of iNOS expression [Citation22], but not in the induction of COX-2 expression. It is necessary to examine the mechanism of inhibition of each component of these active compounds in future work.
Curcumin is a major component of C. longa and its anti-inflammatory effect via suppression of NF-κB or AP-1 signaling pathways has been reported [Citation23,Citation24]. It is presumed that curcumin contributes to the anti-inflammatory effects of WEC. However, the curcumin content in WEC used in the present study was too low (≈0.2 mg/g) to explain all the activity of WEC by curcumin alone. Also, the content of each compound obtained in the present study was not sufficient to explain the total activity of WEC. The total activity of WEC could be explained by the composite effects of all components within it, including the compounds identified in the present study.
With regard to the anti-inflammatory effects of WEC in vivo, the effects of the compounds identified in our study must be evaluated in other organs, tissues, cells, or inflammatory mediators. To elucidate the complexity of a mixture of natural extracts, the effects of their combination and on other targets must be investigated.
Conclusions
For the purpose of searching for the compounds contributing to the anti-inflammatory effects of WEC, it was fractioned and the fractions were evaluated with regard to their inhibitory effect on the production of NO from RAW 264.7 cells stimulated with LPS. Eight compounds were isolated from active fractions and one new and four known compounds were identified their stereostructure. Among them, four compounds inhibited the production of PGE2 and NO, and others inhibited NO production only. These results (at least in part) show the active compounds contributing to the anti-inflammatory effects of WEC, and may be useful for elucidating its various beneficial physiologic effects.
Notes on contributions
YY conceived and designed the experiments. KK, CO and MA performed experiments. All authors analyzed data. KK, MA and SM wrote the paper. All authors have read and approved the final manuscript.
Supplementary_File.pdf
Download PDF (1.6 MB)Disclosure statement
All authors are employees of House Wellness Foods Corporation or House Foods Group Inc.
Supplementary material
Supplementary data for this article can be accessed here
Related Research Data
References
- Remadevi R, Surendran E, Kimura T. Turmeric in traditional medicine. In: Ravindran PN, Nirmal Babu K, Sivaraman K, editors. Turmeric: the genus Curcuma. Boca Raton (FL): CRC Press; 2007. p. 409–436.
- Sengupta M, Sharma GD, Chakraborty B. Hepatoprotective and immunomodulatory properties of aqueous extract of Curcuma longa in carbon tetra chloride intoxicated Swiss albino mice. Asian Pac J Trop Biomed. 2011;1:193–199.
- Yu ZF, Kong LD, Chen Y. Antidepressant activity of aqueous extracts of Curcuma longa in mice. J Ethnophaemacol. 2002;83:161–165.
- Mohanty I, Arya DS, Dinda A, et al Protective effects of Curcuma longa on ischemia-reperfusion induced myocardial injuries and their mechanisms. Life Sci. 2004;75:1701–1711.
- Zafir A, Banu N. Antioxidant potential of fluoxetine in comparison to Curcuma longa in restraint-stressed rats. Eur J Pharmacol. 2007;572:23–31.
- Gupta SK, Agarwal R, Srivastava S, et al The anti-inflammatory effects of Curcuma longa and Berberis aristata in endotoxin-induced uveitis in rabbits. Invest Ophthalmol Vis Sci. 2008;49:4036–4040.
- Uchio R, Higashi Y, Kohama Y, et al A hot water extract of turmeric (Curcuma longa) suppresses acute ethanol-induced liver injury in mice by inhibiting hepatic oxidative stress and inflammatory cytokine production. J Nutr Sci. 2017;6:e3.
- Kawasaki K, Muroyama K, Yamamoto N, et al A hot water extract of Curcuma longa inhibits adhesion molecule protein expression and monocyte adhesion to TNF-α-stimulated human endothelial cells. Biosci Biotechnol Biochem. 2015;79:1654–1659.
- Menon VP, Sudheer AR. Antioxidant and anti-inflammatory properties of curcumin. Adv Exp Med Biol. 2007;595:105–125.
- Aggarwal BB, Yuan W, Li S, et al Curcumin-free turmeric exhibits anti-inflammatory and anticancer activities: identification of novel components of turmeric. Mol Nutr Food Res. 2013;57:1529–1542.
- Lee SK, Hong CH, Huh SK, et al Suppressive effect of natural sesquiterpenoids on inducible cyclooxygenase (COX-2) and nitric oxide synthase (iNOS) activity in mouse macrophage cells. J Environ Pathol Toxicol Oncol. 2002;21:141–148.
- Oh OJ, Min HY, Lee SK. Inhibition of inducible prostaglandin E2 production and cyclooxygenase-2 expression by curdione from Curcuma zedoaria. Arch Pharm Res. 2007;30:1236–1239.
- Sun DI, Nizamutdinova IT, Kim YM, et al Bisacurone inhibits adhesion of inflammatory monocytes or cancer cells to endothelial cells through down-regulation of VCAM-1 expression. Int Immunopharmacol. 2008;8:1272–1281.
- Li S, Yuan W, Deng G, et al Chemical composition and product quality control of turmeric (Curcuma longa L.). Pharmaceutical Crops. 2011;2:28–54.
- Zeng Y, Qiu F, Takahashi K, et al New sesquiterpenes and calebin derivatives from Curcuma longa. Chem Pharm Bull (Tokyo). 2007;55:940–943.
- Imai S, Morikiyo M, Furihata K, et al Turmeronol A and turmeronol B, new inhibitors of soybean lipoxygenase. Agric Biol Chem. 1990;54:2367–2371.
- Bohlmann F, Zdero C, Robinsona H, et al Germacranolides from Lychnophora species. Phytochemistry. 1982;21:1087–1091.
- Ohshiro M, Kuroyanagi M, Ueno A. Structures of sesquiterpenes from Curcuma longa. Phytochemistry. 1990;29:2201–2205.
- Li W, Feng JT, Xiao YS, et al Three novel terpenoids from the rhizomes of Curcuma longa. J Asian Nat Prod Res. 2009;11:569–575.
- Li HM, Lei C, Luo YM, et al Intermedins A and B; new metabolites from Schisandra propinqua var. intermedia. Arch Pharm Res. 2008;31:684–687.
- Kang YJ, Mbonye UR, DeLong CJ, et al Regulation of intracellular cyclooxygenase levels by gene transcription and protein degradation. Prog Lipid Res. 2007;46:108–125.
- Kleinert H, Pautz A, Linker K, et al Regulation of the expression of inducible nitric oxide synthase. Eur J Pharmacol. 2004;500(1–3):255–266.
- Singh S, Aggarwal BB. Activation of transcription factor NF-kappa B is suppressed by curcumin (diferuloylmethane). J Biol Chem. 1995;270:24995–25000.
- Chen YR, Tan TH. Inhibition of the c-Jun N-terminal kinase (JNK) signaling pathway by curcumin. Oncogene. 1998;17:173–178.