
ABSTRACT
Quercetin is a flavonoid with many physiological effects. Absorbed quercetin is rapidly conjugated in the intestinal epithelium and liver. Different positional isomers of quercetin conjugates have different physiological properties. However, the mechanisms of quercetin conjugation in the intestine are not fully clarified. We examined the regioselective quercetin conjugate formation in the intestine after oral administration of quercetin glycosides, by simultaneous sampling of blood from the portal vein and superior vena cava, and quantifying various positional isomers of quercetin glucuronides and sulfates in conscious rats. Concentrations of quercetin glucuronides were higher in blood from the portal vein than the superior vena cava, showing that glucuronidation mainly occurred in the intestine. Such differences were not observed for quercetin sulfates. Regioselectivity of the intestinal glucuronidation in quercetin hydroxyl groups were 7- >3′- >3- >4′-OH. Quercetin was mainly sulfated on 3′-OH at 30 min, but on 4′-OH at 240 min.
Graphical Abstract
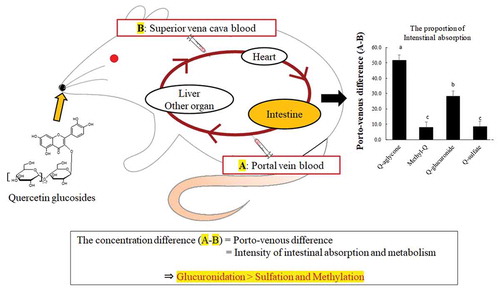
Simultaneous collection of the portal and superior vena cava blood in conscious rats defined that intestinal epithelium is the major site of glucuronidation, but not sulfation and methylation, of quercetin.
Quercetin is one of the most abundant flavonol-type flavonoids found in nature. It has been reported that quercetin has numerous physiological properties, such as antioxidant [Citation1], anticancer [Citation2] and antiarteriosclerotic activity [Citation3]. However, an extent of their bioactivity in vivo will be dependent on the amount of quercetin absorbed and metabolized.
Quercetin is present in the form of its glucoside derivatives, such as quercetin-4′-O-glucoside and quercetin-3-O-glucoside, in tea, onions, and apples [Citation4–Citation6]. Ingested quercetin glucosides are hydrolyzed to quercetin aglycone in the small intestine [Citation7] by the lactase phlorizin hydrolase (LPH) enzyme [Citation8,Citation9]. Absorbed quercetin aglycone is then converted to glucuronidated, sulfated, and methylated quercetin derivatives by phase II metabolizing enzymes such as UDP-glucuronosyl transferases (UGT), phenol sulfotransferases (SULT), and catechol-O-methyltransferases (COMT), in liver and intestine [Citation10,Citation11]. In systemic circulation, quercetin metabolites exist mainly in the conjugated forms, but not as aglycone [Citation11]. Quercetin entered into the cecum and colon is degraded to phenolic acid derivatives, such as 3-hydroxyphenylacetic acid and 3, 4-dihydroxyphenylacetic acid, by colonic microflora [Citation12].
Various kinds of quercetin conjugates in the plasma have been reported to have different physiological properties depending on the type of position isomers of conjugates present [Citation13,Citation14]. For instance, Ki (inhibition constant) values of xanthine oxidase for 3-, 7-, 4′-, and 3′-glucuronides were 160, 100, 0.25 and 1.4 μmol/L, respectively [Citation14]. These results indicate that the identification of regioisomers and types of quercetin conjugates in the blood is important to evaluate physiological effects of quercetin. As mentioned above, quercetin conjugates are mainly produced in the liver and the intestine. However, levels of contribution of each the two organs in forming quercetin conjugates, and the criteria for producing a specific type of positional isomer of a conjugate are not yet fully understood. shows the chemical structure of quercetin aglycone and its carbon numbers. All hydroxy group of quercetin (3,5,7,3′ and 4ʹ) are conjugated with glucuronic acid or sulfonic acid. Only 3ʹ-and 4′-hydroxy group in B ring of quercetin are acceptable for methylation.
Figure 1. The structure of quercetin.
Although a number of studies on absorption and metabolism of quercetin have been conducted, only a few of them were conducted in physiological conditions. In our previous study, we observed the quercetin absorption in ligated small intestinal loop of anesthetized rats [Citation15], in which the intestinal ability to conjugate and methylate quercetin was possibly either impaired or enhanced. The present study was designed to observe the intestinal ability to form quercetin conjugates in conscious rats. We implanted cannulae into the portal vein and the superior vena cava, and collected blood samples from both of them simultaneously after an administration of quercetin glucosides in unrestrained conscious rats. The differences in quercetin metabolite concentrations between the portal vein blood and the superior vena cava blood (porto-venous differences) indicate absorption and metabolism (conjugation and methylation) of quercetin in intestine. We assumed that the concentrations of quercetin derivatives are almost the same between the blood in superior vena cava and that in the arteries. Our previous study has reported the methods of collecting blood from superior vena cava and portal vein to examine intestinal absorption [Citation16]. We administered a water-soluble quercetin glucoside through a feeding tube.
The objectives of this study are (i) to evaluate the contribution of the intestine in formation of quercetin glucuronides and sulfates, and (ii) to examine regioselectivity in glucuronidation and sulfation of quercetin after an oral administration of a quercetin glycoside in conscious rats.
Materials and methods
Materials
A mixture of water-soluble quercetin glucosides (Q3GM) is mainly composed of quercetin-3-O-glucoside (Q3G, 31.8%), mono- (23.3%), and di- (20.3%) glucose adducts on the glucose moiety of Q3G with α-1, 4-linkages (San-Ei Gen F.F.I, Inc., Osaka, Japan), which is enzymatically produced with transglycosylation [Citation17]. The mixture also includes tri- to hepta-adducts as minor components. Standard preparations of quercetin and tamarixetin (methylquercetin) were purchased from Extrasynthese (Genay, France). Quercetin-7-O-glucuronide, quercetin-3-O-glucuronide, quercetin-4′-O-glucuronide, quercetin-3′-O-glucuronide, quercetin-7 or 3-O-sulfate, quercetin-4′-O-sulfate, and quercetin-3′-O-sulfate were biosynthesized using Saccharomyces cerevisiae, harboring a co-expression system (recombinant plasmid) encoding for mammalian UGTs and SULTs [Citation18–Citation20]. All other reagents were purchased at the best quality that is commercially available.
Animals and diet
Experimental procedures were approved by the Hokkaido University Animal Committee, and rats were maintained in accordance with the guidelines of Hokkaido University for the care and use of laboratory animals (approval number: 08-0131, 14-0026). Male Wistar/ST rats weighing about 230 g each (8 weeks old; Japan SLC, Shizuoka, Japan) were housed in individual stainless-steel cages with wire-mesh bottoms. The cages were placed in a room at controlled temperature (22 ± 2°C), relative humidity (40–60%), and light (lights on 08:00–20:00) throughout the day. The rats were fed a diet based on the AIN-93G formulation [Citation21] for 1 week for acclimatization.
Surgical procedure for cannulation for collection of blood from superior vena cava and portal vein
Rats were anesthetized with sodium pentobarbital (50 mg/kg body weight (BW), Somnopentyl Injection; Kyoritsu Seiyaku Co, Tokyo, Japan). The right jugular vein was exposed, and a silicone tube (Silascon No. 00, ID 0.5 mm, OD 1.0 mm; Kaneka, Osaka, Japan) was inserted 5 cm into the blood vessel and fixed with a thread. The tip of the catheter reached the superior vena cava. An abdominal midline incision was made on rats, and the small tip (5–6 mm) of a polyethylene tube (SP28; ID 0.4 mm, OD 0.8 mm; Natsume Seisakusyo, Tokyo, Japan) connected to a silicone tube was inserted into the portal vein and fixed with instant adhesive. Both catheters were prefilled with sterilized saline that contained heparin (200 IU/mL; AY pharmaceuticals, Tokyo, Japan). Free ends of the catheters were dorsally exteriorized, which permitted us to conduct the experiment on the rats under awake and unrestrained conditions. The rats were then used for experiments after a recovery period for 2 days. To prevent blood coagulation, the jugular and portal catheters were flushed with heparinized saline every day.
Absorption of quercetin glycosides in conscious rats
We examined the quercetin absorption in conscious rats after an oral administration of a water-soluble quercetin glucoside mixture (Q3GM) through a feeding tube (5 mL/kg BW, Q3GM 100 mmol/L in deionized water) after 16 h of fasting. Blood samples (150 μL) were drawn through the jugular and portal catheters before (i.e., at 0 min), and at 30, 60, 120, 180, and 240 min after an oral gavage. Blood was centrifuged (4°C, 10 min, 2300 g), and the plasma was collected and stored at −80°C until further analyses.
Sample preparation for LC/MS/MS analyses
Preparation of plasma samples was performed similar to a previously described method with minor modifications [Citation15]. The plasma (20 μL) from the portal blood was added to a mixture of 80 μL of deionized water and 10 μL of 0.58 mol/L acetic acid (pH 4.9). The final mixture was then added to 100 μL of methanol containing an internal standard (naringenin, final 2 μmol/L), heated at 100°C for 1 min, and centrifuged (5 min, 4°C, 9300 g), and the supernatant was collected. Residual flavonoids in the precipitate were extracted thrice with 100 μL methanol. All of the supernatant was combined, evaporated, and dissolved in methanol for LC/MS/MS analyses.
Measurement of concentrations of quercetin derivatives in rat plasma by LC/MS/MS
Quercetin and its metabolites were quantified by liquid chromatography (using an Agilent 1290 Infinity II LC System; Agilent Technologies, Waldbronn, Germany) coupled with an Agilent Jet Stream (AJS) ionization triple quadrupole mass spectrometer (Agilent 6495 Triple Quadrupole LC/MS System; Agilent Technologies, Santa Clara, CA, USA). The injection volume was 2 μL, and the separation column used was a Zorbax Eclipse Plus RRHD Phenyl-hexyl 3.0 × 100 mm, 1.8 μm (Agilent Technologies). The column temperature was 30°C, with a flow rate of 0.4 mL/min, and the gradient elution was used with 0.1% formic acid (mobile phase A) and 0.1% formic acid in methanol (mobile phase B). The following gradient profile was employed: 0–3 min: 20→40% B; 3–13 min: 40→60% B; 13–13.1 min: 60→95% B; 13.1–15 min: 95% B. The post time was 1 min. The following ionization conditions were used: positive and negative simultaneously, drying gas (nitrogen) temperature 250°C, drying gas flow rate 15 L/min, nebulizer gas pressure 50 psi, sheath gas temperature 350°C, sheath gas flow 11 L/min, capillary voltage 3000 V, and nozzle voltage 0 V. The ion funnel parameters were as follows: high-pressure ion funnel RF voltage 100 V and low-pressure ion funnel RF voltage 50 V. Detection of analytes was performed using dynamic MRM mode (dMRM). The details are shown in . The concentrations of quercetin, methylquercetin, Q3G-Q3G8, quercetin glucuronide, and quercetin sulfate in plasma were calculated from the peak area of each MRM chromatogram and the calibration curves of each standard compound.
Table 1. LC/MS analytical parameters.
The preparation of S9 homogenates from rat intestine, liver and kidney
Three male Wistar/ST rats (8 weeks old; Japan SLC, Shizuoka, Japan) were sacrificed, and collected liver, kidney and whole the small intestine without duodenum, which was from 3 cm distal of the Treitz ligament to the teriminal ileum.
Liver (15.0 g) and kidney tissues (6.0 g) were homogenized in 3- and 2-fold volumes of solution A, respectively. Solution A contained 50 mmol/L Tris-HCl (pH 7.4), 150 mmol/L KCl, and 2 mmol/L EDTA. The homogenate was centrifuged (3000g, 4°C, 15 min), and the supernatant was collected and centrifuged again (10000g, 4°C, 20 min). After centrifugation, the supernatant (S9 fraction) was collected.
Small intestinal enterocytes were isolated as described previously [Citation22]. Small intestinal contents were flushed out with saline, and the intestinal segment (10–20 cm) was vertically cut off on ice. The intestinal segment was incubated on ice in 20 mL solution B for 60 min. Solution B (pH 7.4) was consisting of phosphate buffered solution (PBS), 1.5 mmol/L EDTA, a protease inhibitor (PI) cocktail (0.5% v/v) and 0.5 mmol/L dithiothreitol (DTT). After an incubation, the solution was collected and the intestinal segment was re-incubated for 60 min. The procedure was repeated thrice, and the incubated medium was combined and centrifuged (3000g, 4°C, 5 min). The pellet was washed in solution C which consisting of 250 mmol/L sucrose, 0.5 mmol/L EDTA, and PI cocktail (0.5% v/v). Following the final centrifugation (3000g, 4°C, 5 min), the pellet was reconstituted in 2mL of solution D per g of cells and homogenized. Solution D contained 50 mmol/L Tris-HCl (pH7.4), 150 mmol/L KCl, 1 mmol/L EDTA, 20% glycerol, 0.1 mmol/L DTT, and PI cocktail (1% v/v). Protein concentrations in the S9 fraction of intestine, liver and kidney samples were determined with a BCA kit (Thermo Fisher Scientific, Waltham, MA, USA) and adjusted to 4.80 mg/mL.
In vitro conjugation of quercetin by intestinal epithelium, liver and kidney S9 fractions
For in vitro assay of glucuronidation or sulfation, S9 protein solutions of intestine, liver and kidney (400μL) adding 100 μL of 3 mmol/L UDP-glucuronic acid (UDPGA) acid or 3ʹ-phosphoadenosine 5ʹ-phosphosulfate (PAPS), respectively were preincubated at 37°C for 5 min. The reaction was initiated by adding 2 μL quercetin aglycone dissolved in 50% DMSO (final concentration, 50 μmol/L). After an incubation for 1 h, the reaction was terminated by adding 500 μL of ice-cold methanol. The samples were centrifuged at 9000g for 5 min., and supernatant was analyzed by LC/MS/MS. The reaction was performed in duplicate.
Statistical analysis
All values are expressed as mean ± standard error. Statistical analyses were performed by two-way analysis of variance (ANOVA), and differences among the groups were determined by using Tukey-Kramer’s test. A difference of P < 0.05 was considered significant. JMP version 12.0 (SAS Institute, Cary, NC) was used for statistical analyses.
Results
After an oral administration of Q3GM, quercetin aglycone, methylquercetin, Q3G, quercetin glucuronides, and quercetin sulfates were detected in the portal and superior vena cava blood. shows the typical MRM chromatograms of portal vein plasma after a Q3GM administration. Methylquercetin is composed of isorhamnetin (3′-methylquercetin) and tamarixetin (4′-methylquercetin). Four isomers of quercetin glucuronide were detected (3-, 7-, 4′-, and 3′-glucuronide) and one additional uncharacterized peak was obtained. The three regioisomers of quercetin sulfates were also identified. We labeled 3 or 7-sulfate for the first small peak because the peak was not able to be identified the sulfate position 3 or 7. We showed the standard chromatograms of conjugates as Supplemental Figure 1 (see http://journalauthors.tandf.co.uk/preparation/multimedia.asp for further explanation of supplemental data).
Figure 2. LC/MS/MS MRM chromatograms in portal vein plasma. Numbers in the chromatograms represent different regioisomers of quercetin conjugates.
Concentrations of total quercetin, which was a sum of concentrations of quercetin aglycone, methylquercetin, Q3G, quercetin glucuronides, and quercetin sulfates, were much higher in the portal plasma than in the superior vena cava blood plasma during 30–240 min time interval ()). Absorptive intensities of quercetin, which were evaluated by subtracting its concentrations in the superior vena cava plasma from those in the portal vein plasma (porto-venous differences), increased during 30–60 min time interval, thereafter, started decreasing ()). The concentrations of quercetin aglycone in the superior vena cava blood were very low compared to those in the portal blood, which indicates that most of the aglycone absorbed into the portal blood does not recirculate into the intestine (,)). In contrast, the concentration of methylquercetin in the superior vena cava blood was not significantly different from that in the portal blood (). Concentrations of Q3G in the portal blood were extremely low (below 1 μmol/L, data not shown). The sums of the concentrations of each regioisomer of glucuronide and sulfate conjugates in the portal blood were at similar levels (,)). However, glucuronide levels in the superior vena cava blood were much lower than in the portal blood. Porto-venous differences of glucuronides were much higher than those of sulfates (,)). shows that the molar percentage of aglycone in the AUC of its porto-venous differences was 52% and that of glucuronides was about 28%. Proportions of methylquercetin and sulfates were relatively low.
Figure 3. Changes in concentrations of total quercetin in portal and superior vena cava blood plasma (a), and their differences (Porto-venous differences, (b)). Total quercetin is the sum of quercetin aglycone, methylquercetin, quercetin glucuronides, and quercetin sulfates. Porto-venous differences show intestinal intensities for quercetin absorption and intestinal mechanisms for conjugation and methylation of quercetin. Portal and superior vena cava blood was collected before (that is, at 0 min), and at 30, 60, 120, 180, and 240 min after the administration of Q3GM solution (5 mL/kg BW, 100 mmol/L). Values are represented as mean ± SEM shown by vertical bars. n = 4–6.
Figure 4. Changes in concentrations of quercetin aglycone and methylquercetin in portal and superior vena cava blood plasma and their differences. The portal and superior vena cava plasma concentration of quercetin aglycone (a) and methylquercetin (b) after an administration of Q3GM. Porto-venous differences in quercetin aglycone (c) and methylquercetin (d) evaluated by subtracting their respective concentrations in superior vena cava plasma from that in portal vein plasma. Portal and superior vena cava blood was collected before (that is, at 0 min), and at 30, 60, 120, 180, and 240 min after the administration of Q3GM solution (5 mL/kg BW, 100 mmol/L). Values are represented as mean ± SEM shown by vertical bars. n = 4–6.
Figure 5. Changes in concentrations of quercetin glucuronides and quercetin sulfates in portal and superior vena cava blood plasma, and their differences. The portal and superior vena cava blood plasma concentrations of quercetin glucuronide, (which are a sum of concentrations of all its regioisomers, (a). The portal and superior vena cava plasma concentrations of quercetin sulfate, (which are a sum of concentrations of all its regioisomers, (b). Porto-venous differences in quercetin glucuronide (c) and quercetin sulfate (d) evaluated by subtracting the respective concentrations in superior vena cava plasma from that in the portal vein plasma. Portal and superior vena cava blood was collected before (that is, at 0 min), and at 30, 60, 120, 180, and 240 min after the administration of Q3GM solution (5 mL/kg BW, 100 mmol/L). Values are represented as mean ± SEM shown by vertical bars. n = 4–6.
Figure 6. Intestinal metabolic rate for total quercetin derivatives. Portal and superior vena cava blood was collected before (that is, at 0 min), and at 30, 60, 120, 180, and 240 min after the administration of Q3GM solution (5 mL/kg BW, 100 mmol/L). The intestinal metabolic rate was calculated as follows. First, area under the curve (AUC) of porto-venous differences in the concentrations of total quercetin derivatives ()), quercetin aglycone ()), methylquercetin ()), quercetin glucuronide ()), and quercetin sulfate ()) were examined. AUC of porto-venous difference in the concentrations of each metabolite was divided by the AUC of the total quercetin derivatives. Values are represented as mean ± SEM shown by vertical bars. n = 4–6. Means not sharing a common letter differ significantly (Tukey-Kramer’s test, P < 0.05).
shows regional isomer profiles of quercetin glucuronides (A and C) and sulfates (B and D). In the portal blood, the concentrations of all quercetin glucuronides reached a maximum at 30 min and started decreasing gradually 60 min after the Q3GM administration. The highest concentration among the positional isomers of quercetin glucuronides was that of quercetin-7-O-glucuronide, followed by that of the 3′-O isomer ()). Porto-venous difference of 7-O isomer was much higher than the other three isomers ()). The porto-venous differences of glucuronides were higher than glucuronide concentrations in the vena cava. Portal blood concentrations of quercetin sulfates were similar to those of glucuronides ()). The quercetin sulfate isomer with the highest concentration was 3′-O-sulfate at 30 min, however, 4′-O-sulfate levels reached the highest 120 min after an administration, and these changes and levels of three sulfates in the vena cava blood were very similar to those in the portal blood ()). Porto-venous differences of sulfate isomers were much lower than their concentrations in the vena cava blood, and the porto-venous differences of glucuronides.
Figure 7. Changes in concentrations of regioselective quercetin glucuronide and quercetin sulfate in portal and superior vena cava plasma, and their differences. Concentrations of regioselective quercetin glucuronide (a) and quercetin sulfate (b) in portal plasma. Concentrations of regioselective quercetin glucuronide (c) and quercetin sulfate (d) in superior vena cava plasma. Porto-venous differences in regioselective quercetin glucuronide (e) and quercetin sulfate (f) are obtained by subtracting the respective concentrations in superior vena cava plasma from those in portal vein plasma. Portal and superior vena cava blood was collected before (that is, at 0 min), and at 30, 60, 120, 180, and 240 min after the administration of Q3GM solution (5 mL/kg BW, 100 mmol/L). Values are represented as mean ± SEM shown by vertical bars. n = 4–6.
The proportion of the positional isomers (molar percentage) of glucuronides and sulfates in port-venous differences at 30 or 240 min after an administration are shown in ,), respectively (in vivo experiment). Quercetin-7-O-glucuronide had the highest concentration and constituted around 60% of total glucuronides ()). The regioselectivity of glucuronidation was not changed by the time. In contrast, the proportion of sulfate conjugation markedly changed at 30 min and 240 min. At 30 min, 3′-O-sulfate had the highest concentration and constituted 60% of total sulfates, however, 4′-O-sulfate had the highest concentration at 240 min ()).
Figure 8. Proportion of each positional isomer of quercetin glucuronide (a) and quercetin sulfate (b) in the intestine at 30 or 240 min after Q3GM administration. Portal and superior vena cava blood was collected before (that is, at 0 min) and at 30, 60, 120, 180, and 240 min after an administration of Q3GM solution (5 mL/kg BW, 100 mmol/L). Values are represented as mean ± SEM shown by vertical bars. n = 4–6. Means not sharing a common letter differ significantly (Tukey-Kramer’s test, P < 0.05).
Proportion of the positional isomers of glucuronide and sulfate produced by using S9 protein fractions of the liver, kidney and small intestinal enterocytes are shown in , respectively (in vitro experiment). The proportion of the positional isomers of 7-O- and 3′-O- glucuronides was both more than 30%, and 3-O- and 4′-O-glucuronide were minor components ()). These isomer proportions were similar among tissues used. Sulfate conjugation has different positional selectivity between tissues. In the small intestinal enterocytes, 3′-sulfate was major metabolites, and 4′-sulfate were not detected. Liver also had the high sulfation activity at 3′-OH, however, kidney had the highest activity at 7 or 3 -position ()).
Figure 9. Proportion of each positional isomer of quercetin glucuronide (a) and quercetin sulfate (b) in the S9 protein in intestine, liver and kidney. Quercetin aglycone (50 μmol/L) was incubated with S9 homogenate in small intestine, liver, and kidney with UDPGA (a) and PAPS (b) at 37°C for 60 min. The reaction was terminated with ice-cold methanol, centrifuged at 9000 g for 5 min., and supernatant was analyzed with LC/MS/MS. Values are represented as average of duplicated experiments.
Discussion
In this study, we have examined the intestinal absorption and metabolism of a quercetin glucoside by simultaneous sampling of the portal and vena cava blood in conscious rats. The porto-venous differences, obtained by subtracting the concentrations of total quercetin in blood plasma of the superior vena cava from those of the portal vein, closely reflect intestinal absorption rate of quercetin. We refer to these values as “absorptive intensities”. In the study, we also observed time-dependent changes in the porto-venous difference in the concentrations of the quercetin metabolites. The porto-venous differences of quercetin glucuronides, sulfates, and methylquercetin, indicate the synthesis of these metabolites in the intestinal epithelium. This is the first report estimating the intestinal metabolism of quercetin in conscious rats under physiological conditions.
The form of metabolites present in the portal blood represents the absorption pathway of quercetin. Appearance of glycoside form of quercetin in the portal blood indicates absorption via paracellular pathway [Citation15,Citation23], and aglycone or conjugated forms indicate that the administered quercetin is absorbed via transcellular pathway. The concentrations of quercetin-3-O-glucoside (Q3G) in the portal blood plasma were very low, which shows low contribution of the paracellular pathway in the quercetin glucoside absorption in physiological conditions. On the other hand, the concentrations of quercetin aglycone were relatively high in the portal blood. This finding shows that administered quercetin glucoside was rapidly absorbed through the transcellular pathway as aglycone derivative, which agrees with our previous results from the study on the ligated intestinal loops in anesthetized rats [Citation15]. The concentrations of quercetin aglycone were about 10 times higher in the portal blood than those in the superior vena cava. This result demonstrates that quercetin aglycone released into the portal blood was immediately conjugated in the tissues other than intestine, such as liver. It has been reported that quercetin aglycone has strong physiological effects compared to other quercetin derivatives. For instance, quercetin aglycone exhibits stronger inhibition on xanthine oxidase and lipoxygenase compared to other conjugated forms of quercetin [Citation14]. The high levels of quercetin aglycone in the portal blood possibly affect the functions of the intestine or the liver.
The comparison between the concentrations of quercetin metabolites in blood plasma of the portal vein and the superior vena cava has shed some light on the intestinal metabolism of quercetin. We calculated porto-venous differences in concentrations of quercetin glucuronides and sulfates, and found that these differences were much higher for glucuronides compared to those for sulfates. In addition, the porto-venous differences of glucuronides were higher than their concentrations in the superior vena cava blood. In contrast, the porto-venous differences of sulfates were much lower than their concentrations in the superior vena cava blood. These results reveal that the major site of glucuronidation is the intestine, but quercetin sulfates are mainly generated in tissues other than the intestine, such as the liver. It has been previously described that glucuronide conjugation was rapidly processed [Citation24,Citation25] and the intestine was involved in this process. We also found that the intestine has a low level of methylation activity based on the results of porto-venous differences of methylquercetin, and this result is supported by a previous study [Citation26].
We evaluated not only the conjugation type, but also the regioselectivity of the glucuronide and the sulfate conjugation. Five peaks were detected in the quercetin glucuronide MRM chromatogram of quercetin glucuronide, which was consistent with the previous study [Citation27]. Quercetin 3-, 7-, 4′- and 3′-O-glucuronide were identified with standard compounds, an unidentified peak is assumed to belong to quercetin-5-O-glucuronide. In our in vivo experiment, order for positional isomer of glucuronides in portal vein blood was 7 > 3′> 3 > 4′, which did not match the order in the superior vena cava blood. The positional isomer profile in the superior vena cava blood may be affected by regioselective glucuronidation activities of tissues other than the intestine. UDP-glucuronosyltransferases (UGT), which catalyzes quercetin glucuronidation, are composed of the UGT1 and UGT2 families in both human and rats. In the human isoform, UGT1A9 preferentially generates 7-O-glucuronide, while UGT1A1 and UGT1A8 preferentially generate 3′-O-glucuronide [Citation28]. Regioselectivity of the UGT isoform in rats has not been fully investigated, but it has been reported that mRNA expression of UGT in each tissue was examined in rats [Citation29]. Therefore, the isoforms of UGT expressed was different between each tissues, and was possibly affecting position selectivity. In the present study, we performed in vitro experiments using S9 fractions including UGTs and SULTs in the intestinal enterocytes, liver and kidney. The regioselectivities for glucuronidation were similar between tissues, which were equally higher in 7 and 3′ positions than other positions, and which was consistent with previous studies [Citation28]. These results do not agree with the regioselectivities in porto-venous differences, which is much higher glucuronidation at 7-position than 3ʹ-position. We considered two possibilities. The first possibility is that the 7-O-glucuronide is more acceptable to further conjugation on other hydroxy groups in vivo rats. It is reported that the quercetin has conjugated at multiple hydroxyl groups, such as quercetin diglucuronide, quercetin glucuronide sulfate, and methylquercetin glucuronide sulfate [Citation30]. Using S9 fraction experiments, we did not detect these complex quercetin metabolites, which possibly be associated with cell destruction. The second possible reason is that the 7-O-glucuronide is rapidly removed from the blood into urine or bile. However, it has not been reported whether the regioselectivity of glucuronide conjugates affect the activity of further conjugation and the affinity for transporters related to excrete into urine or bile. Further studies are necessary.
In positional isomers of quercetin sulfates, the site of predominant conjugation was 3′-position at 30 min in both the portal and superior vena cava blood. However, quercetin-4′-sulfate was preferentially generated 120–240 min after a quercetin administration. The levels of porto-venous difference were very low, but the profile was similar. These results indicate that the predominant position of sulfate changes over time from 3′-OH to 4′-OH of quercetin, and sulfate formation occurred in tissues other than the intestine. We determined regioselective activities of quercetin sulfation by S9 protein fractions of intestinal epithelium, liver and kidney, and found 3′-O-sulfation activities were relatively high in both the intestine and liver, but not in kidney. We also revealed the 4′-O-sulfation activities were very low in all tissues. It is difficult to explain the increase in blood levels of 4′-O-sulfate in a later phase. We speculate a possibility that the accumulation of 4′-O-sulfate in the blood is associated with low excretion rate into the urine or bile of this isomer, however, it is necessary for further investigation. Unidentified small peak of sulfate represents either quercetin-3-O-sulfate or quercetin-7-O-sulfate. It has been reported that quercetin-7-O-sulfate is generated by the rat liver microsome [Citation31,Citation32], but there have been no reports on the conjugation of quercetin-3-O-sulfate in rats. Therefore, the unidentified peak in quercetin sulfate chromatogram could be quercetin-7-O-sulfate, but not quercetin-3-O-sulfate.
The existence of glucuronides, sulfates, diglucuronides, and disulfides of quercetin or methylquercetin in the blood has been known from previous studies [Citation30,Citation33]. We predicted levels of these complex quercetin conjugates in blood plasma by subtracting total concentration of quercetin derivatives detected by LC/MS/MS analyses from the value of total quercetin detected using deconjugation enzymes (data not shown). Estimated levels of the conjugates in the porto-venous difference were less than 20% in the present study. However, it is necessary to quantify di- and tri-conjugates to evaluate the whole metabolism of quercetin in the future.
In conclusion, our results using conscious rats demonstrated that the major site of glucuronidation of quercetin is the intestinal epithelium, and that quercetin-7-O-glucuronide is the major isomer generated in the intestine. We also found that the regiospecificity of sulfate conjugation periodically changed from 3′-OH to 4′-OH, which was possibly caused by the specificities of different sulfotransferases, acting at different time-intervals depending on the concentrations of quercetin aglycone. Physiological actions of quercetin may be associated with the metabolism of quercetin as shown in the present study.
Author contributions
Seiya Tanaka and Hiroshi Hara designed the experiments and wrote the manuscript. Shinichi Ikushiro also contributed manuscript preparation. Seiya Tanaka, Manami Oyama, Miyu Nishikawa and Shinichi Ikushiro performed the experiments.
Supplemental_figure.pdf
Download PDF (252.4 KB)Disclosure statement
No potential conflict of interest was reported by the authors.
Supplementary material
Supplemental data for this article can be accessed here.
Related Research Data
References
- Morand C, Crespy V, Manach C, et al. Plasma metabolites of quercetin and their antioxidant properties. Am J Physiol. 1998;275:R212–R219.
- Hertog MG, Hollman PC, Katan MB, et al. Intake of potentially anticarcinogenic flavonoids and their determinants in adults in The Netherlands. Nutr Cancer. 1993;20:21–29.
- Kleemann R, Verschuren L, Morrison M, et al. Anti-inflammatory, anti-proliferative and anti-atherosclerotic effects of quercetin in human in vitro and in vivo models. Atherosclerosis. 2011;218:44–52.
- Erlund I. Review of the flavonoids quercetin, hesperetin, and naringenin. Dietary sources, bioactivities, bioavailability, and epidemiology. Nutr Res. 2004;24:851–874.
- Lee J, Mitchell AE. Pharmacokinetics of quercetin absorption from apples and onions in healthy humans. J Agric Food Chem. 2012;60:3874–3881.
- Lee J, Mitchell AE. Quercetin and isorhamnetin glycosides in onion (Allium cepa L.): varietal comparison, physical distribution, coproduct evaluation, and long-term storage stability. J Agric Food Chem. 2011;59:857–863.
- Anach CLM, Emigne CHD, Emesy CHR, et al. Quercetin, but not its glycosides; is absorbed from the rat stomach. J Agric Food Chem. 2002;4:618–621.
- Sesink ALA, Arts ICW, Faassen-Peters M, et al. Intestinal uptake of quercetin-3-glucoside in rats involves hydrolysis by lactase phlorizin hydrolase. Journal Nutr. 2003;133:773–776.
- Day AJ, Cañada FJ, Díaz JC, et al. Dietary flavonoid and isoflavone glycosides are hydrolysed by the lactase site of lactase phlorizin hydrolase. FEBS Lett. 2000;468:166–170.
- O’Leary KA, Day AJ, Needs PW, et al Metabolism of quercetin-7- and quercetin-3-glucuronides by an in vitro hepatic model: the role of human β-glucuronidase, sulfotransferase, catechol-O-methyltransferase and multi-resistant protein 2 (MRP2) in flavonoid metabolism. Biochem Pharmacol. 2003;65:479–491.
- Graf BA, Ameho C, Dolnikowski GG, et al. Rat gastrointestinal tissues metabolize quercetin. J Nutr. 2006;136:39–44.
- Aldwell STTC, Artley RICH, Ean MIEJL, et al. Bioavailability of [2-(14)C] quercetin-4′ -glucoside in rats. J Agric Food Chem. 2008;56:12127–12137.
- Williamson G, Barron D, Shimoi K, et al. In vitro biological properties of flavonoid conjugates found in vivo. Free Radic Res. 2005;39:457–469.
- Day AJ, Bao Y, Morgan MRA, et al. Conjugation position of quercetin glucuronides and effect on biological activity. Free Radic Biol Med. 2000;29:1234–1243.
- Tanaka S, Shinoki A, Hara H. Melibiose, a nondigestible disaccharide, promotes absorption of quercetin glycosides in rat small intestine. J Agric Food Chem. 2016;64:9335–9341.
- Hara H, Funabiki R, Iwata M, et al. Portal absorption of small peptides in rats under unrestrained conditions. J Nutr. 1984;114:1122–1129.
- Emura K, Yokomizo A, Toyoshi T, et al. Effect of enzymatically modified isoquercitrin in spontaneously hypertensive rats. J Nutr Sci Vitaminol (Tokyo). 2007;53:68–74.
- Ikushiro S, Nishikawa M, Masuyama Y, et al. Biosynthesis of drug glucuronide metabolites in the budding yeast saccharomyces cerevisiae. Mol Pharm. 2016;13:2274–2282.
- Nishikawa M, Masuyama Y, Nunome M, et al. Whole-cell-dependent biosynthesis of sulfo-conjugate using human sulfotransferase expressing budding yeast. Appl Microbiol Biotechnol. 2018;102:723–732.
- Nakamura T, Kinjo C, Nakamura Y, et al. Lymphatic metabolites of quercetin after intestinal administration of quercetin-3-glucoside and its aglycone in rats. Archives Biochem Biophysics. 2018;645:126–136.
- Reeves PG, Nielsen FH, Fahey GC. AIN-93 purified diets for laboratory rodents: final report of the American institute of nutrition ad hoc writing committee on the reformulation of the AIN-76A rodent diet. J Nutr. 1993;123:1939–1951.
- Hatley OJD, Jones CR, Galetin A, et al. Optimization of intestinal microsomal preparation in the rat: a systematic approach to assess the influence of various methodologies on metabolic activity and scaling factors. Biopharm Drug Dispos. 2017;38:187–208.
- Matsumoto M, Chiji H, Hara H. Intestinal absorption and metabolism of a soluble flavonoid, α G-rutin, in portal cannulated rats. Free Radic Res. 2005;39(10):1139–1146.
- Bock KW, Winne D. Glucuronidation of 1-naphthol in the rat intestinal loop. Bioche Pharmacol. 1975;24:859–862.
- Powell GM, Miller JJ, Olavesen AH, et al.. Liver as major organ of phenol detoxification? Nature (Lond.). 1974;252:234–235.
- Koster ASJ. Intestinal glucuronidation : in vivo and in vitro model systems. In: Bock KW, Matern S, Gerok W, editors. Advances in glucuronide conjugation. Lancaster: MTP Press; 1985. p. 177–195.
- Wittig J, Herderich M, Graefe EU, et al. Identification of quercetin glucuronides in human plasma by high-performance liquid chromatography-tandem mass spectrometry. J Chromatogr B Biomed Sci Appl. 2001;753:237–243.
- Boersma MG, Van der Woude H, Bogaards J, et al. Regioselectivity of phase II metabolism of luteolin and quercetin by UDP-glucuronosyl transferases. Chem Res Toxicol. 2002;15:662–670.
- Shelby MK, Cherrington NJ, Vansell NR, et al. Tissue mRNA expression of the rat UDP-glucuronosyltransferase gene family. Drug Metab Dispos. 2003;31:326–333.
- Guo J, Du L, Shang E, et al. Conjugated metabolites represent the major circulating forms of Abelmoschus manihot in vivo and show an altered pharmacokinetic profile in renal pathology. Pharm Biol. 2016;54:595–603.
- Van Der Woude H, Boersma MG, Vervoort J, et al. Identification of 14 quercetin phase II mono- and mixed conjugates and their formation by rat and human phase II in vitro model systems. Chem Res Toxicol. 2004;17:1520–1530.
- Boonpawa R, Spenkelink A, Rietjens IMCM, et al. A physiologically based kinetic (PBK) model describing plasma concentrations of quercetin and its metabolites in rats. BiochemiPharmacol. 2014;89:287–299.
- Mullen W, Hartley RC, Crozier A. Detection and identification of 14C-labelled flavonol metabolites by high-performance liquid chromatography-radiocounting and tandem mass spectrometry. J Chromatogr A. 2003;1007:21–29.